Abstract
Mast cells (MCs) and regulatory T cells (Tregs) are the important components of the inflammatory infiltrating leukocytes in most malignant tumors. Our study was designed to investigate the infiltrating correlation between MCs and Tregs and clarify their prognostic significance in gastric cancer (GC). A total of 60 fresh GC tissues were collected and tumor-infiltrating leukocytes were isolated by gradient centrifugation. Tryptase and Foxp3 were used as markers for MCs and Tregs, respectively. The expression of tryptase and Foxp3 was determined in tumor-infiltrating leukocytes using flow cytometry. The expression of tryptase and Foxp3 were positively correlated. The increased infiltration of MCs correlated significantly with advanced stage of GC. The infiltration of MCs into the tumor may increase the number of Tregs. Tryptase is a promising marker to stratify GC patients into different risk groups.
Keywords: gastric cancer, mast cells, regulatory T cells, TNM stage, coexpression
Introduction
Gastric cancer (GC), a common malignancy of the digestive tract worldwide, remains largely incurable (1,2). It is one of the leading causes of tumor-associated mortality in a number of developing Asian countries despite declining morbidity and mortality among patients with GC in the majority of developed countries (3,4). Tumor-induced immunosuppression, which hinders the cytotoxic responses of T lymphocytes and natural killer cells, is a principal problem to be solved in cancer immunotherapy (5,6). There are various immunosuppressive strategies employed by tumors in which regulatory T cells (Tregs) play a pivotal role (7).
Tregs are a distinct lymphocyte lineage with immunosuppressive potential in maintaining immunological tolerance. The transcription factor Foxp3 is a unique marker for Tregs and is indispensable for their development (8,9)
Mast cells (MCs) are a group of long-lived heterogeneous cells originating from the bone marrow. They were recognized by their modulating activities in inflammation and angiogenesis until recent investigations revealed their roles in shaping adaptive immune responses (10). MCs have been found to accumulate in the tumor microenvironment through the SCF/c-kit signaling pathway, leading to the aggravation of inflammation and immunosuppression in the tumor microenvironment (11).
The complex reciprocal correlation between MCs and Tregs determines the functions of both cell types. This interaction of MCs with Tregs dictates the intensity of tumor-associated inflammation and thus either promotes or inhibits tumor growth (10).
In numerous experimental models and human specimens, it has been observed that the increase in the number of MCs occurs in a number of tumors (12). However, there is little evidence of a clear correlation between the number of MCs and Foxp3 expression in human GC. The purpose of this study was to assess the infiltrating correlation between MCs and Tregs in GC.
Patients and methods
Patients and specimens
Tumor samples were obtained from 60 patients with pathologically confirmed gastric adenocarcinoma from the Department of Gastrointestinal Surgery, Union Hospital (Wuhan, China). None of the patients accepted anti-cancer therapy prior to surgical resection. Clinical stages were classified according to the 7th UICC TNM staging system.
Fresh GC tissues were used for the isolation of tumor-infiltrating leukocytes, as previously described (13). The clinical characteristics of all patients are summarized in Table I. The research protocol was approved by the Institutional Review Board of Tongji Medical College of Huazhong University of Science and Technology (Wuhan, China). Written and oral consents were obtained from the patients prior to the collection of samples.
Table I.
Clinical characteristics and the stages of the patients.
| Characteristics | Number (%) |
|---|---|
| Gender (male/female) | 39/21 (65/35) |
| Age, years (range) | 30–75 |
| TNM stage | |
| I | 10 (16.7) |
| II | 15 (25) |
| III | 20 (33.3) |
| IV | 15 (25) |
Flow cytometry analysis
Tumor-infiltrating leukocytes were stained extracellularly with specific antibodies against human CD45, CD3 and CD4 (BD Biosciences, Franklin Lakes, NJ, USA), fixed and permeabilized with Perm/Fix solution (eBiosciences, San Diego, CA, USA) and finally stained intracellularly with anti-Tryptase (Millipore, Billerica, MA, USA) and anti-Foxp3 (eBiosciences). Tryptase and Foxp3 were used as the markers for MCs and Tregs, respectively. Samples were acquired on an LSR II (BD Biosciences) and data were analyzed with DIVA software (BD Biosciences).
Statistical analysis
Results are expressed as mean ± SEM. Spearman’s rank correlation coefficient test and ANOVA were carried out as indicated. P<0.05 was considered to indicate a statistically significant result. All analyses were performed using SPSS v12.0 software (Chicago, IL, USA).
Results
Tryptase and Foxp3 expression were positively correlated in human GC
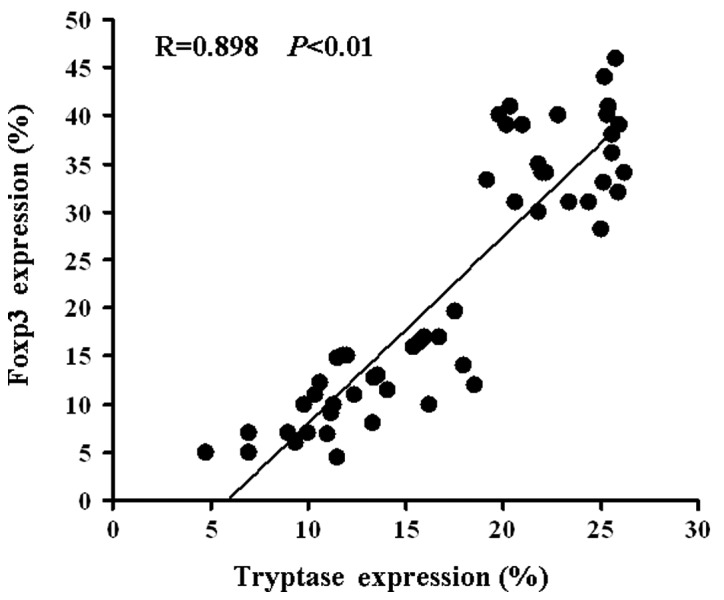
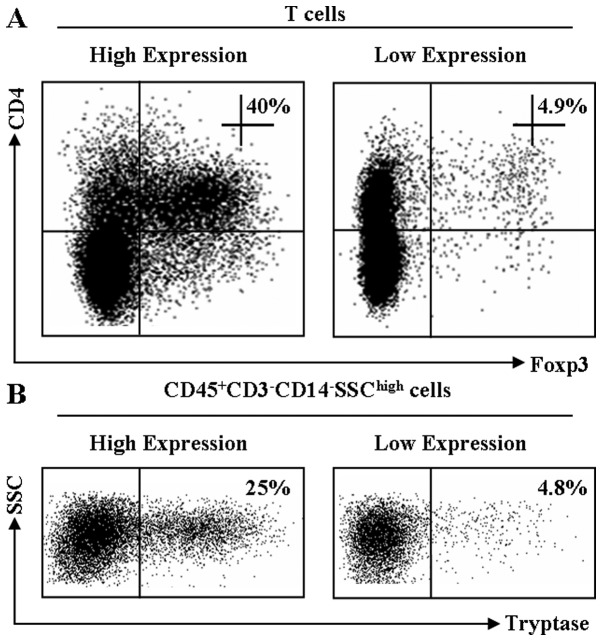
Representative dot plots for Foxp3 and tryptase expression are shown in Fig. 1. Tryptase and Foxp3 expression were positively correlated (R= 0.898, P<0.01; Fig. 2). Correlations were determined by Spearman’s rank correlation coefficients.
Figure 1.
Numbers of Tregs and MCs are increased in tumor tissues. Single-cell suspensions of normal (right) and tumor (left) tissues were prepared from fresh human GC stained with relevant antibodies. Tregs and MCs were analyzed by flow cytometry. The specimens were from 60 patients with GC (see Table I and Materials and methods). The results of one patient are shown. (A) Tregs (Foxp3) in T cells (gated CD4 cells) from the tumor were analyzed by flow cytometry. Numbers on the plots are the proportions of Foxp3+ cells in the CD4+ cells. (B) MCs in CD45+CD3−CD14−SSChigh cells. Numbers on the plots are the proportions of tryptase+ cells in the CD45+CD3−CD14−SSChigh cells. MC, mast cell; Treg, regulatory T cell; GC, gastric cancer.
Figure 2.

Correlation between MCs and Tregs. MCs were positively correlated with Tregs (R=0.898, P<0.01). Patients with more MCs had more Tregs. The percentage of tryptase expression = the percentage of tryptase in tumor tissue - the percentage of tryptase in normal tissue. The percentage of Foxp3 expression = the percentage of Foxp3 in tumor tissue - the percentage of Foxp3 in normal tissue. MC, mast cell; Treg, regulatory T cell.
Tryptase and Foxp3 coexpression was associated with TNM stage in human GC
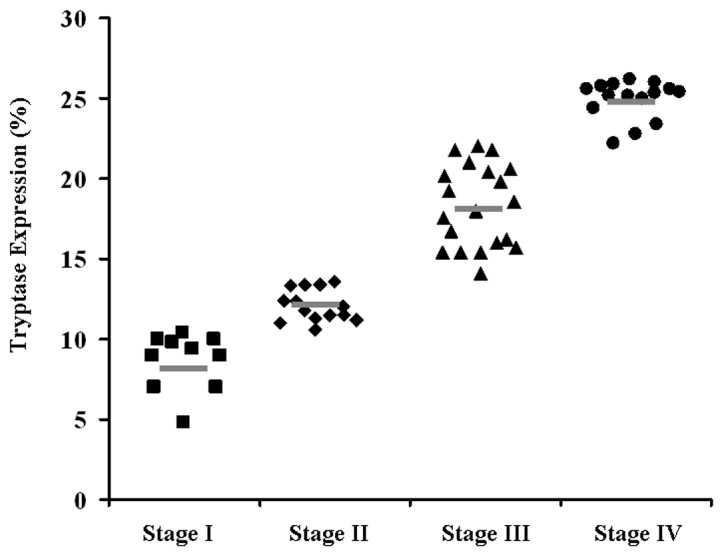
The development and progression of cancer are known to be regulated by various oncogenes and tumor suppressor genes. We analyzed 60 primary GC patients for the expression of tryptase by ANOVA. As shown in Fig. 3, a high level of tryptase expression was associated with advanced tumor stage, which is a marker of poor prognosis.
Figure 3.

Correlation between number of MCs and stage of GC in the total set of subjects. The percentages of tryptase expression are separated into four groups by the TNM stage. The short bar indicates the mean value in each group. MC, mast cell; GC, gastric cancer.
Discussion
Our study revealed that an increased number of MCs in GC patients is correlated with a higher frequency of Foxp3 expression. Numerous studies have documented an increased level of Foxp3 during GC progression (14,15). However, the role of MCs in GC remains unclear.
Ribatti et al (16) demonstrated that MC density correlates with progression of patients with gastric carcinoma. This means that the density of MCs is positively correlated with the development of the disease from stage I to stage IV. However, there have been reports of a protective role for MCs in human cancer. For instance, in a multivariate analysis of colorectal cancer patients, high counts of eosinophils and MCs predicted longer survival (17). MC tryptases activate the nuclear peroxisome proliferator-activated receptor-γ (PPAR-γ); the expression of PPAR-γ is associated with improved clinical outcome in colon cancer (18). Our findings imply a complex correlation between the increased number of infiltrating MCs and advanced stages of GC patients.
These results suggest that higher numbers of MCs are associated with poor outcomes, which is similar to the results of previous studies reported in GC and other tumors (19–23). The present study not only provides support for the correlation between MCs and the stages of GC, but also focused on mechanisms other than angiogenesis, which has already been demonstrated (16). We studied the correlation between Tregs and MCs in order to provide an explanation of the influence of MCs on the stage of GC. Several studies have researched the immune suppression mechanism of MCs in tumors (11). However, to date, no study has directly demonstrated the correlation between the increased frequency of MCs and higher levels of Foxp3 in human GC. Our data demonstrate that MCs may affect the progression of GC, partially via interaction with Tregs. Studies in liver cancer reported similar results (32). Numerous researchers consider IL-9 to be critical factor in this interaction (24–26).
In several types of cancer, an increased level of Foxp3+ Tregs has been detected in tumor tissues and peripheral blood, consistent with their presumed function in immuno-suppression (27,28). Much concern has also been attached to the roles of Foxp3 in human GC. There is a link between the concentration of Tregs and patient survival in GC (29,30). Recently, a study partly explained the mechanisms of the weakened immune reactions in GC based on the overexpression of Foxp3 (31). Yuan et al (32) demonstrated a mechanism by which tumor-infiltrating Tregs with increased Foxp3 expression mediate immune suppression via COX-2/PGE2 production in the GC microenvironment. Furthermore, Tregs with higher levels of Foxp3 were able to suppress the proliferation of autologous CD4+CD25−T cells. The suppression of the effector T-cell response was reversed by COX inhibitors and PGE2 receptor-specific antagonists. In 2011, Yuan et al (33) performed further research on Tregs in GC and found that GC cells induce the development of Tregs via the production of TGF-β, by which the existence of cross-talk between the tumor and immune cells may regulate antitumor immune responses. Our research first confirmed that the expression of Foxp3 in tumor-infiltrating T lymphocytes was higher in the GC tissues compared with normal tissues. We also identified links between MCs and Foxp3, providing a new strategy of targeting Tregs and Foxp3. As mentioned, GC cells induce human CD4+Foxp3+ Tregs through the production of TGF-β (34), and as MCs secrete TGF-β, we speculate that one of the ways in which MCs affect Tregs is their secretion of TGF-β, thus explaining the correlation between MCs and Foxp3 at the molecular level, and providing a new support and research direction for the immunosuppressive effects of MCs.
In conclusion, our results reveal that the frequency of MCs and the level of Foxp3 are increased in tumors compared with normal tissues. The significant correlation between MCs and Foxp3 may be considered to support the hypothesis that MCs play a role in immunosuppression in GC and may be, at least partially, responsible for their prognosis. These results are significant and may provide promising clinical treatments for cancer, in at least in three aspects. First, these findings show the significance of MCs in GC and provide a probable mechanism by which MCs affect GC development, thus providing references for the application of MC-regulating drugs. Second, there are few studies concerning the correlation between MCs and Foxp3 and the present study linked them and provided new insights into the mechanism of immune suppression. Third, we confirmed the close correlation between MCs and Tregs, making a foundation for the further study of the detailed mechanisms. Therefore, further studies should be performed to explore the mechanism of the correlation between MCs, Foxp3 and GC.
Acknowledgments
This study was supported by the Natural Science Foundation of Hubei Province and the Biological Targeted Therapy Laboratory Foundation of Hubei Province (02.03.2011-6).
References
- 1.Murray CJ, Lopez AD. Mortality by cause for eight regions of the world: Global Burden of Disease Study. Lancet. 1997;349:1269–1276. doi: 10.1016/S0140-6736(96)07493-4. [DOI] [PubMed] [Google Scholar]
- 2.Jemal A, Siegel R, Ward E, Hao Y, Xu J, Thun MJ. Cancer statistics, 2009. CA Cancer J Clin. 2009;59:225–249. doi: 10.3322/caac.20006. [DOI] [PubMed] [Google Scholar]
- 3.Crew KD, Neugut AI. Epidemiology of gastric cancer. World J Gastroenterol. 2006;12:354–362. doi: 10.3748/wjg.v12.i3.354. [DOI] [PMC free article] [PubMed] [Google Scholar]
- 4.Parkin DM, Bray F, Ferlay J, Pisani P. Global cancer statistics, 2002. CA Cancer J Clin. 2005;55:74–108. doi: 10.3322/canjclin.55.2.74. [DOI] [PubMed] [Google Scholar]
- 5.Dougan M, Dranoff G. Immune therapy for cancer. Annu Rev Immunol. 2009;27:83–117. doi: 10.1146/annurev.immunol.021908.132544. [DOI] [PubMed] [Google Scholar]
- 6.Rabinovich GA, Gabrilovich D, Sotomayor EM. Immunosuppressive strategies that are mediated by tumor cells. Annu Rev Immunol. 2007;25:267–296. doi: 10.1146/annurev.immunol.25.022106.141609. [DOI] [PMC free article] [PubMed] [Google Scholar]
- 7.Beyer M, Schultze JL. Regulatory T cells in cancer. Blood. 2006;108:804–811. doi: 10.1182/blood-2006-02-002774. [DOI] [PubMed] [Google Scholar]
- 8.Fontenot JD, Gavin MA, Rudensky AY. Foxp3 programs the development and function of CD4+CD25+ regulatory T cells. Nat Immunol. 2003;4:330–336. doi: 10.1038/ni904. [DOI] [PubMed] [Google Scholar]
- 9.Kryczek I, Liu R, Wang G, Wu K, Shu X, et al. FOXP3 defines regulatory T cells in human tumor and autoimmune disease. Cancer Res. 2009;69:3995–4000. doi: 10.1158/0008-5472.CAN-08-3804. [DOI] [PubMed] [Google Scholar]
- 10.Khazaie K, Blatner NR, Khan MW, et al. The significant role of mast cells in cancer. Cancer Metastasis Rev. 2011;30:45–60. doi: 10.1007/s10555-011-9286-z. [DOI] [PubMed] [Google Scholar]
- 11.Huang B, Lei Z, Zhang GM, Li D, Song C, et al. SCF-mediated mast cell infiltration and activation exacerbate the inflammation and immunosuppression in tumor microenvironment. Blood. 2008;112:1269–1279. doi: 10.1182/blood-2008-03-147033. [DOI] [PMC free article] [PubMed] [Google Scholar]
- 12.Ribatti D, Crivellato E. The controversial role of mast cells in tumor growth. Int Rev Cell Mol Biol. 2009;275:89–131. doi: 10.1016/S1937-6448(09)75004-X. [DOI] [PubMed] [Google Scholar]
- 13.Wu K, Kryczek I, Chen L, Zou W, Welling TH. Kupffer cell suppression of CD8+ T cells in human hepatocellular carcinoma is mediated by B7-H1/programmed death-1 interactions. Cancer Res. 2009;69:8067–8075. doi: 10.1158/0008-5472.CAN-09-0901. [DOI] [PMC free article] [PubMed] [Google Scholar]
- 14.Shen LS, Wang J, Shen DF, Yuan XL, Dong P, et al. CD4(+) CD25(+)CD127(low/−)regulatory T cells express Foxp3 and suppress effector T cell proliferation and contribute to gastric cancers progression. Clin Immunol. 2009;131:109–118. doi: 10.1016/j.clim.2008.11.010. [DOI] [PubMed] [Google Scholar]
- 15.Kono K, Kawaida H, Takahashi A, Sugai H, Mimura K, et al. CD4(+)CD25high regulatory T cells increase with tumor stage in patients with gastric and esophageal cancers. Cancer Immunol Immunother. 2006;55:1064–1071. doi: 10.1007/s00262-005-0092-8. [DOI] [PMC free article] [PubMed] [Google Scholar]
- 16.Ribatti D, Guidolin D, Marzullo A, et al. Mast cells and angiogenesis in gastric carcinoma. Int J Exp Pathol. 2010;91:350–356. doi: 10.1111/j.1365-2613.2010.00714.x. [DOI] [PMC free article] [PubMed] [Google Scholar]
- 17.Nielsen HJ, Hansen U, Christensen IJ, et al. Independent prognostic value of eosinophil and mast cell infiltration in colorectal cancer tissue. J Pathol. 1999;189:487–495. doi: 10.1002/(SICI)1096-9896(199912)189:4<487::AID-PATH484>3.0.CO;2-I. [DOI] [PubMed] [Google Scholar]
- 18.Ogino S, Shima K, Baba Y, Nosho K, Irahara N, et al. Colorectal cancer expression of peroxisome proliferator activated receptor gamma (PPARG, PPARgamma) is associated with good prognosis. Gastroenterology. 2009;136:1242–1250. doi: 10.1053/j.gastro.2008.12.048. [DOI] [PMC free article] [PubMed] [Google Scholar]
- 19.Elpek GO, Gelen T, Aksoy NH, et al. The prognostic relevance of angiogenesis and mast cells in squamous cell carcinoma of the oesophagus. J Clin Pathol. 2001;54:940–944. doi: 10.1136/jcp.54.12.940. [DOI] [PMC free article] [PubMed] [Google Scholar]
- 20.Takanami I, Takeuchi K, Naruke M. Mast cell density is associated with angiogenesis and poor prognosis in pulmonary adenocarcinoma. Cancer. 2000;88:2686–2692. [PubMed] [Google Scholar]
- 21.Molin D, Edström A, Glimelius I, et al. Mast cell infiltration correlates with poor prognosis in Hodgkin’s lymphoma. Br J Haematol. 2002;119:122–124. doi: 10.1046/j.1365-2141.2002.03768.x. [DOI] [PubMed] [Google Scholar]
- 22.Acikalin MF, Oner U, Topçu I, Yaşar B, Kiper H, Colak E. Tumour angiogenesis and mast cell density in the prognostic assessment of colorectal carcinomas. Dig Liver Dis. 2005;37:162–169. doi: 10.1016/j.dld.2004.09.028. [DOI] [PubMed] [Google Scholar]
- 23.Stoyanov E, Uddin M, Mankuta D, et al. Mast cells and histamine enhance the proliferation of non-small cell lung cancer cells. Lung Cancer. 2012;75:38–44. doi: 10.1016/j.lungcan.2011.05.029. [DOI] [PubMed] [Google Scholar]
- 24.Ju MJ, Qiu SJ, Gao Q, Fan J, Cai MY, et al. Combination of peritumoral mast cells and T-regulatory cells predicts prognosis of hepatocellular carcinoma. Cancer Sci. 2009;100:1267–1274. doi: 10.1111/j.1349-7006.2009.01182.x. [DOI] [PMC free article] [PubMed] [Google Scholar]
- 25.Lu LF, Lind EF, Gondek DC, et al. Mast cells are essential intermediaries in regulatory T-cell tolerance. Nature. 2006;31:997–1002. doi: 10.1038/nature05010. [DOI] [PubMed] [Google Scholar]
- 26.Eller K, Wolf D, Huber JM, et al. IL-9 production by regulatory T cells recruits mast cells that are essential for regulatory T cell-induced immune suppression. J Immunol. 2011;186:83–91. doi: 10.4049/jimmunol.1001183. [DOI] [PMC free article] [PubMed] [Google Scholar]
- 27.Yang Z, Zhang B, Li D, Lv M, Huang C, Shen GX, Huang B. Mast cells mobilize myeloid-derived suppressor cells and Treg cells in tumor microenvironment via IL-17 pathway in murine hepatocarcinoma model. PLoS One. 2010;5:e8922. doi: 10.1371/journal.pone.0008922. [DOI] [PMC free article] [PubMed] [Google Scholar]
- 28.Kobayashi N, Hiraoka N, Yamagami W, Ojima H, Kanai Y, et al. FOXP3+ regulatory T cells affect the development and progression of hepatocarcinogenesis. Clin Cancer Res. 2007;13:902–911. doi: 10.1158/1078-0432.CCR-06-2363. [DOI] [PubMed] [Google Scholar]
- 29.Griffiths RW, Elkord E, Gilham DE, Ramani V, Clarke N, Stern PL, Hawkins RE. Frequency of regulatory T cells in renal cell carcinoma patients and investigation of correlation with survival. Cancer Immunol Immunother. 2007;56:1743–1753. doi: 10.1007/s00262-007-0318-z. [DOI] [PMC free article] [PubMed] [Google Scholar]
- 30.Ichihara F, Kono K, Takahashi A, Kawaida H, Sugai H, Fujii H. Increased populations of regulatory T cells in peripheral blood and tumor-infiltrating lymphocytes in patients with gastric and esophageal cancers. Clin Cancer Res. 2003;9:4404–4408. [PubMed] [Google Scholar]
- 31.Kawaida H, Kono K, Takahashi A, Sugai H, Mimura K, Miyagawa N, Omata H, Ooi A, Fujii H. Distribution of CD4+CD25high regulatory T-cells in tumor-draining lymph nodes in patients with gastric cancer. J Surg Res. 2005;124:151–157. doi: 10.1016/j.jss.2004.10.004. [DOI] [PubMed] [Google Scholar]
- 32.Yuan XL, Chen L, Li MX, et al. Elevated expression of Foxp3 in tumor-infiltrating Treg cells suppresses T-cell proliferation and contributes to gastric cancer progression in a COX-2-dependent manner. Clin Immunol. 2010;134:277–288. doi: 10.1016/j.clim.2009.10.005. [DOI] [PubMed] [Google Scholar]
- 33.Yuan XL, Chen L, Zhang TT, et al. Gastric cancer cells induce human CD4+Foxp3+ regulatory T cells through the production of TGF-β1. World J Gastroenterol. 2011;17:2019–2027. doi: 10.3748/wjg.v17.i15.2019. [DOI] [PMC free article] [PubMed] [Google Scholar]
- 34.Sayed BA, Christy A, Quirion MR, Brown MA. The master switch: the role of mast cells in autoimmunity and tolerance. Annu Rev Immunol. 2008;26:705–739. doi: 10.1146/annurev.immunol.26.021607.090320. [DOI] [PubMed] [Google Scholar]


