

Abstract
Considering the various pharmacological activities of epigallocatechin-3-O-gallate (EGCG) including anticancer, and anti-inflammatory, antidiabetic, and so forth, relatively less attention has been paid to the antiaging effect of EGCG on primary cells. In this study, the preventive effects of EGCG against serial passage-induced senescence were investigated in primary cells including rat vascular smooth muscle cells (RVSMCs), human dermal fibroblasts (HDFs), and human articular chondrocytes (HACs). The involvement of Sirt1 and acetylated p53 was examined as an underlying mechanism for the senescence preventive activity of EGCG in HDFs. All cells were employed with the initial passage number (PN) between 3 and 7. For inducing senescence, the cells were serially passaged at the predetermined times and intervals in the absence or presence of EGCG (50 or 100 μM). Serial passage-induced senescence in RVSMCs and HACs was able to be significantly prevented at 50 μM EGCG, while in HDFs, 100 μM EGCG could significantly prevent senescence and recover their cell cycle progression close to the normal level. Furthermore, EGCG was found to prevent serial passage- and H2O2-induced senescence in HDFs by suppressing p53 acetylation, but the Sirt1 activity was unaffected. In addition, proliferating HDFs showed similar cellular uptake of FITC-conjugated EGCG into the cytoplasm with their senescent counterparts but different nuclear translocation of it from them, which would partly account for the differential responses to EGCG in proliferating versus senescent cells. Taking these results into consideration, it is suggested that EGCG may be exploited to craft strategies for the development of an antiaging or age-delaying agent.
1. Introduction
Cellular senescence means a state of irreversible growth arrest by which normal cells lose the ability to divide generally after about 50 cell divisions in vitro [1]. Some cells become senescent after fewer replication cycles as a result of DNA double-strand breaks. This phenomenon, also known as replicative senescence, was first reported by Hayflick and Moorhead observing that normal human fibroblasts were able to enter a state of irreversible growth arrest after serial cultivation in vitro; meanwhile cancer cells did not enter this growth arrest state and proliferated indefinitely [1]. Cellular senescence can be triggered by multiple mechanisms including telomere shortening, the epigenetic derepression of the cyclin-dependent kinase (CDK) inhibitor 2A locus, and DNA damage [2]. Moreover, these mechanisms limit excessive or aberrant cellular proliferation, and so the state of senescence protects against the development of cancer and is involved in aging [2]. During the last decade, much evidence suggests that resveratrol, a polyphenol found in red wine, exerts a calorie restriction mimetic activity with a potential antiaging property by activating silent information regulator (SIR) genes (sirtuins) or inhibiting cAMP-degrading phosphodiesterases [3–6].
From this point of view, our attention has been paid to epigallocatechin3-O-gallate (EGCG), since it has a very similar structure to that of resveratrol including hydroxyls in the two metapositions of the A ring, trans to the B ring with a 4′ or 3′, 4′ hydroxyl pattern [6]. EGCG, the most active and major component of polyphenols in green tea, is well known to be a primary contributor to the potential benefits of green tea to human health [7–9]. But the role of EGCG in the etiology and treatment of aging-related diseases, including neurodegeneration, carcinogenesis, atherosclerosis and obesity is hardly definitive, and some have still challenged the very nature of its action mechanism within the body [10, 11]. Although the mechanism of action is disputed by certain investigators, there remains a clear recognition based on many in vitro, in vivo, and epidemiologic studies suggesting that EGCG possesses beneficial health effects [12, 13]. The main action mechanisms of EGCG have been suggested as being involved in its potent antioxidant activity, which allows neuroprotection and cardioprotection [14, 15]. Other favored mechanisms entail chemopreventive, anti-inflammatory, antithrombotic, and even cytoprotective effects of EGCG [16–18]. In the present study, we investigated the preventive effects of EGCG against serial passage- and H2O2-induced senescence in primary cells. As a potential mechanism for this senescence preventive activity of EGCG, we determined the involvement of Sirt1 and acetylated p53 expression. In addition, we examined differential responses to EGCG in proliferating versus senescent primary cells by comparing the incorporation pattern of EGCG conjugated with fluorescein-4-isothiocyanate (FITC) in proliferating fibroblasts with that in their senescent counterparts.
2. Materials and Methods
2.1. Cell Culture and Conditions
Rat vascular smooth muscle cells (RVSMCs) were isolated by limited enzymatic digestion from the tunica media of thoracic aorta of male young adult (10 wk old) Wistar rats (280 ~ 300 g in weight, Shimizu Laboratory Supplies, Kyoto, Japan) as previously reported [19]. The primarily cultured RVSMCs were maintained in Dulbecco's modified Eagle's medium (DMEM, Sigma-Aldrich Co., St. Louis, MO, USA) supplemented with 10% fetal bovine serum (FBS, Sigma-Aldrich Co.) and 1% antibiotic antimycotic solution (including 10,000 units penicillin, 10 mg streptomycin, and 25 μg amphotericin B per mL, Sigma-Aldrich Co.) at 37°C in 95% humidity and 5% CO2. Studies were performed with the cells third to fifth passage. Human articular chondrocytes (HACs) were kindly supported from Dr. J. Y. Bae (Institute for Frontier Medical Sciences, Kyoto University, Japan) and subcultured in DMEM/HAM's F-12 (Sigma-Aldrich Co.) supplemented with 10% FBS (Sigma-Aldrich Co.) and 1% antibiotic-antimycotic solution under the same conditions as reported elsewhere [20]. HACs below fifth passage were plated prior to the usage. Human dermal fibroblasts (HDFs) were kindly supported from Professor D. K. Rah (Department of Plastic and Reconstructive Surgery, Yonsei University College of Medicine, Seoul, Korea) and routinely maintained in a complete DMEM under the same conditions as previously reported [21]. Studies were performed within the initial passage number (PN) of 5 ~ 7.
2.2. Cytotoxicity Assay
EGCG (MW 458.4) was kindly supported from BMG Inc. (Kyoto, Japan). The number of viable cells was indirectly quantified using highly water-soluble tetrazolium salt [WST-8, 2-(2-methoxy-4-nitrophenyl)-3-(4-nitrophenyl)-5-(2,4-disulfophenyl)-2H-tetrazolium, monosodium salt] (Dojindo Lab., Kumamoto, Japan) reduced to a water-soluble formazan dye by mitochondrial dehydrogenases. The cell viability is well known to be directly proportional to the metabolic reaction products obtained in WST-8. After grown to 80% confluence, all primary cells (RVSMCs, HDFs, and HACs) were treated with increasing concentrations (0 ~ 2,000 μM) of EGCG and then incubated with WST-8 for the last 4 hrs of the culture period (24 h) at 37°C in the dark. In order to avoid a direct reaction between antioxidant, EGCG and WST-8 to be reduced, the excess EGCG, was completely removed, and the medium was exchanged before adding WST-8. Parallel sets of wells containing freshly cultured nontreated cells were regarded as negative (−) controls. The absorbance was determined at 450 nm using an ELISA reader (SpectraMax 340, Molecular Device Co., Sunnyvale, CA, USA). The relative cell viability was determined as the percentage ratio of the optical density in the medium (containing EGCG at each concentration) to that in the fresh control medium. The IC50 value, the concentration (%) inhibiting the growth of cells by 50%, was estimated from the relative cell viability profile.
2.3. Senescence Induction by Serial Passage and EGCG Treatment
For inducing senescence, primary cells were serially passaged at the predetermined number of times and intervals in the absence or presence of EGCG [22]. All cells were plated into 48-well plates with the initial seeding number of 2 × 10⁴ cells/mL and grown to 80% confluence by incubation for 48 h. Every passage was followed by cultivation for 24 h in a CO2 incubator with media refreshment. From passage 3 to 20, EGCG was added to the culture media of RVSMCs and HACs every time at 50 μM with media refreshment during serial culture. HDFs were subcultured serially from passage 7 to ≥40 in the presence of EGCG (50 and 100 μM). The concentration of EGCG, which exerted no adverse effects on the viability of each primary cell, was determined from each cytotoxicity profile. After serial passage with or without EGCG treatment, cellular senescence assay, morphological observation, cell cycle analysis, and western blot analysis were performed as described below in details.
2.4. Cellular Senescence Assay
To compare the senescence levels of serially passaged primary cells treated with or without EGCG, the activity of senescence-associated β-galactosidase (SABG), a marker of cellular senescence, was determined by using a cellular senescence assay kit (Chemicon International Inc., Temecula, CA, USA) according to the manufacturer's instructions. After aspirating the growth media, the cells were washed once with 2 mL phosphate-buffered saline (PBS, pH 7.0), added to 1 mL 1X fixing solution per well and incubated at room temperature for 10 ~ 15 min. After removal of the fixing solution, the cells were washed again with 2 mL PBS. Then 2 mL of freshly prepared 1X SABG detection solution was added, and the mixture was incubated at 37°C without CO2 and protected from the light for at least 4 h. The blue stained cells were counted under an Olympus IX70 inverted microscope (Olympus Optical Co., Osaka, Japan), and the number of senescent cells per mm2 was graphed.
2.5. Cell Cycle Analysis
For cell cycle analysis, each cell, following serial passage in the absence or presence of EGCG, was collected by trypsinization and washed with cold PBS (pH 7.2). The cells were resuspended in 95% cold methanol for 1 h at 4°C and then centrifuged at 120 ×g for 5 min. The resultant pellet was washed twice with cold PBS and incubated with RNase A (at 20 units/mL final concentration, Sigma-Aldrich Co.) at 37°C for 30 min. Intracellular DNA was labeled with 100 μg/mL propidium iodide (PI, Sigma-Aldrich Co.) for 1 h. At least 20,000 cells were counted by a flow cytometer (FACSCalibur, BD Biosciences, San Jose, CA, USA), and the data obtained were with the ModFit LT program for Mac version 3.0 software (Verity Software House, Topsham, ME, USA).
2.6. Western Blot Analysis
After serial passage and H2O2 addition at 150 μM for 1 h, in the absence or presence of EGCG, HDFs were washed twice with cold PBS (10 mM, pH 7.4). Ice-cold RIPA lysis buffer (Santa Cruz Biotechnology Inc., Santa Cruz, CA, USA) was added to the cells for 5 min. The cells were scraped, and the lysate was cleared by centrifugation at 14,000 ×g for 20 min at 4°C. Proteins were extracted from the total lysate, and the protein concentration was determined by a BCATM protein assay according to the manufacturer's protocol (Pierce, Rockford, IL, USA). For immunoblot analysis, 35–40 μg of protein was run on a 4/20 polyacrylamide-SDS gel (Daiichi Pure Chemicals Co., Ltd., Tokyo, Japan) for 1 h at 30 mA and blotted to a PVDF membrane for 50 min at 35 mA. The membrane was blocked in a blocking buffer (Nacalai Tesque Inc., Kyoto, Japan) for 1 h at room temperature and then incubated with primary antibody (Ab). The membrane was treated with either an antimouse IgG (1:2,000, Amersham Biosciences, Buckinghamshire, UK) or an antirabbit IgG secondary Ab (1:5,000, Santa Cruz Biotechnology Inc.), horseradish peroxidase-conjugated. Protein expression was detected by a Chemilumi-one chemiluminescent kit (Nacalai Tesque Inc.) and X-ray film (Fujifilm, Tokyo, Japan). Densitometric analyses were performed with a Scion image (Scion Corporation, Frederick, MD, USA). Immunoblotting was performed using Abs directed against the following antigens: Sirt1 (mouse monoclonal IgG1) and acetyl-p53 (rabbit polyclonal Ab) used in a 1:500–1,000 dilution from Upstate Biotechnology Inc. (Lake Placid, NY, USA), p53 (rabbit polyclonal Ab) and p21 (rabbit monoclonal Ab) at 1 : 500 dilution from Cell Signaling Technology Inc. (Danvers, MA, USA), and as the reference, glyceraldehyde-3-phosphate dehydrogenase (GAPDH, mouse monoclonal Ab) at 1 : 5,000 dilution from Chemicon International Inc.
2.7. Cellular Uptake of FITC-EGCG in HDFs
In order to examine the differential incorporation patterns of EGCG into the proliferating HDFs (with 5 PN) and their senescent counterparts (with 30 PN), EGCG was conjugated with FITC (Dojindo Lab., Kumamoto, Japan) by using the same procedures as reported elsewhere [23]. When the cells reached 80% confluence, they were treated with 100 μM FITC-EGCG for 8 h and then fixed with 3.5% paraformaldehyde in 0.1 M phosphate buffer (pH 7.0) for 5 min at room temperature. Afterwards, the cellular uptake of FITC-EGCG was examined with a fluorescence microscope (Biozero-8000, Keyence, Osaka, Japan) and a confocal laser scanning microscope (LSM 510, Carl Zeiss Advanced Imaging Microscopy, Jena, Germany).
2.8. Statistical Analysis
All variables were tested in three independent cultures for each experiment, which was repeated twice (n = 6). The results are reported as a mean ± standard deviation (SD) compared with the nontreated controls. A one-way analysis of variance (ANOVA, SAS Institute Inc., Cary, NC, USA), which was followed by a Tukey honestly significant difference (HSD) test for the multiple comparisons, was used to detect the senescence level and cell cycle progression of serially passaged primary cells before and after EGCG treatment and effects of EGCG on Sirt1, acetyl-p53, p53, and/or p21 expression in serially passaged and H2O2-treated HDFs. The P value <0.05 was considered statistically significant.
3. Results and Discussion
3.1. Cytotoxicity of EGCG to Proliferating and Senescent Cells
Cytotoxicity of EGCG to proliferating and senescent primary cells was determined by WST-8 assay as shown in Table 1. Proliferating (PN 3) RVSMCs and their senescent (PN 20) counterparts exposed to EGCG for 24 h showed a dose-dependent decrease in the relative cell viability (data not shown) with the IC50 values of about 1,100 and 1,155 μM, respectively. In proliferating and senescent HACs treated with the concentrations of EGCG up to 2,000 μM, the IC50 values were shown to be approximately 320 and 327 μM, respectively. The IC50 values of EGCG were determined as 620 and 631 μM for proliferating and senescent HDFs, respectively. Other study revealed that IC50 values of EGCG were 78.0 and 84.4 μM for young and old human diploid fibroblasts, respectively [24]. Those values were about four times lower than our results. There are a number of explanations for this inconsistency, including difference in cell source (IMR-90 from human lung), the method (Alamar blue staining) for determining cell viability, EGCG treatment period (7 d), and senescent levels of young (population doubling levels of 25 ~ 30) and old (population doubling levels of >45) cells. From these results, it was found that RVSMCs were the least sensitive to EGCG among the primary cells employed in this study. This result implies that the cellular response and sensitivity to EGCG were different according to the cell species and tissue origin, which resulted in the variation of the IC50 value of EGCG to the primary cells, namely, the differential cytotoxicity exerted by EGCG.
Table 1.
IC50 values of EGCG to proliferating and senescent primary cells.
| Primary cells | IC50 of EGCG, μM (μg/mL) |
|---|---|
| Proliferating RVSMCs | 1100 (≈500) |
| Senescent RVSMCs | 1155 (≈529) |
| Proliferating HACs | 320 (≈147) |
| Senescent HACs | 327 (≈150) |
| Proliferating HDFs | 620 (≈284) |
| Senescent HDFs | 631 (≈289) |
3.2. Senescence Level of Serially Passaged Primary Cells before and after EGCG Treatment
Cellular senescence is the phenomenon, where cell division rate slows or ceases with the cells becoming unresponsive to mitogenic stimuli but remaining viable for extended periods of time [25]. Upon entering the state of senescence, cells undergo a dramatic change in morphology—their volume increases and they lose their original shape, acquiring a flattened cytoplasm [25]. For inducing senescence here, RVSMCs and HACs with the initial PN below 5 were serially passaged at the predetermined times and intervals in the absence or presence of 50 μM EGCG. After serial passage, SABG assay and optical microscopy were performed in order to compare the senescence levels and morphologies of the cells, respectively, treated with and without EGCG (Figure 1). RVSMCs and HACs stained with SABG were less readily detected at early passage with a small degree of changes in their size and morphology (Figures 1(a) and 1(b)). However, most of nontreated cells were stained blue after serial subculture (at 20 passages). On the other hand, when the cells were treated with 50 μM EGCG, the number of cells stained with SABG was very small or undetected. The quantitative results revealed that serial passage-induced senescence in RVSMCs and HACs was significantly (P < 0.05) prevented by 50 μM EGCG treatment (Figures 1(c) and 1(d)).
Figure 1.
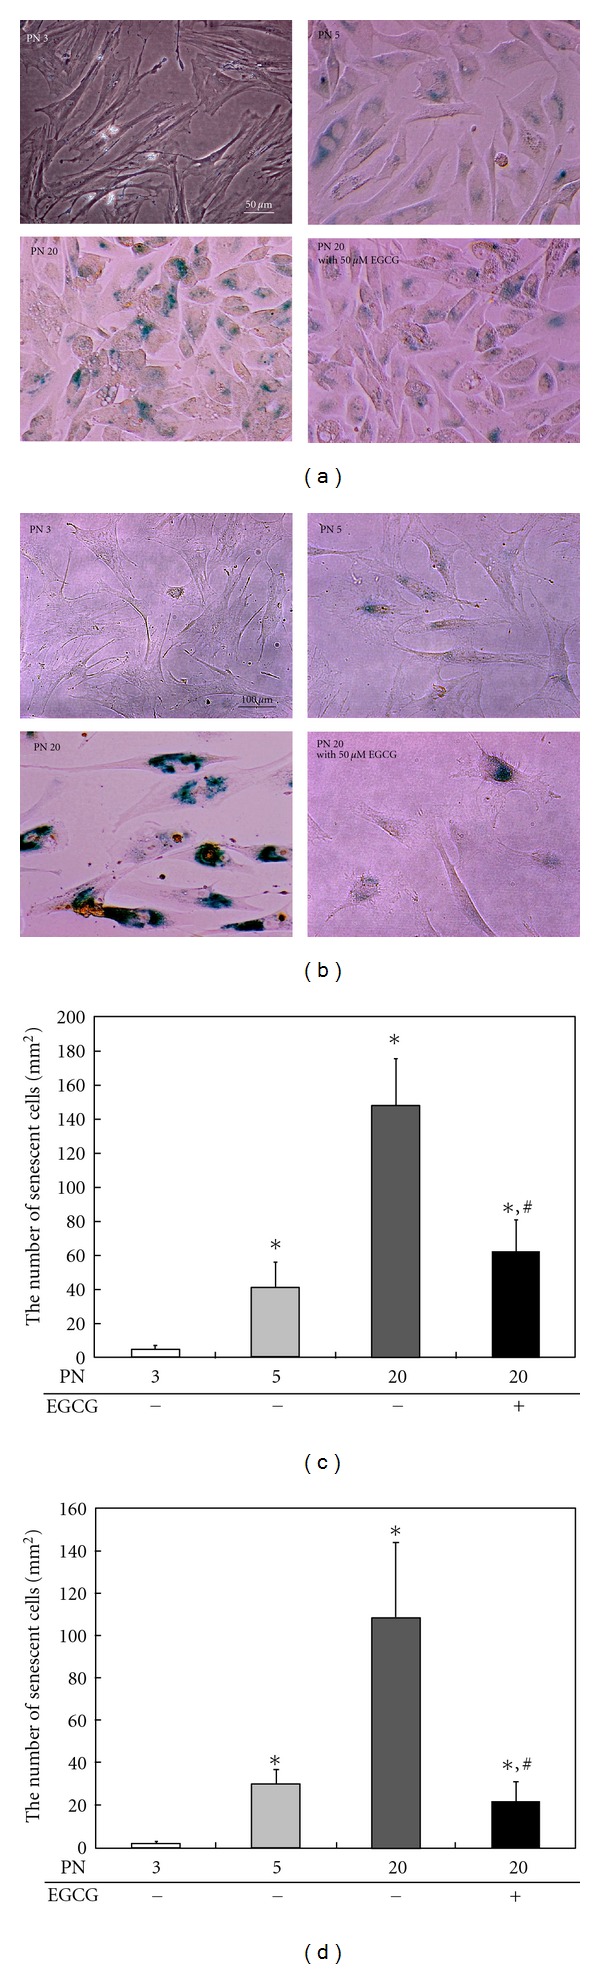
SABG expression of serially passaged RVSMCs (a) and HACs (b) in the absence or presence of 50 μM EGCG. The quantitative results showed that the RVSMCs (c) and HACs (d) at early passage (PN 3 or 5) that were not treated with EGCG did not stain blue or only a few stained, but the cells at late passage (PN 20) showed much blue staining of senescent cells. Furthermore, both cells treated with EGCG showed the number of senescent cells comparable to those with 5 PN. All variables were tested in three independent cultures for each experiment, which was repeated twice independently (n = 6). The results are reported as a mean ± SD and analyzed by a Tukey HSD test. *P < 0.05 versus nontreated cells of 3 PN; # P < 0.05 versus nontreated cells of 20 PN.
In the case of HDFs with the initial PN between 5 and 7, the cells before senescence exhibited spindle-shaped morphology, whereas after serial passages they grew larger, flattened shape and expressed blue spots showing lipofuscin accumulation (Figure 2(a)). Serial passage-induced senescence in HDFs was partly prevented at 50 μM EGCG, while 100 μM EGCG significantly (P < 0.05) prevented cellular senescence (Figure 2(b)). A seminal report demonstrated that the aging level of human dermal microvascular endothelial cells with 20 PN noticeably decreased by the treatment with antiaging agents such as kinetin, EGCG, all-trans retinoic acid, and selenium; meanwhile the proliferative and metabolic activity significantly increased [26].
Figure 2.
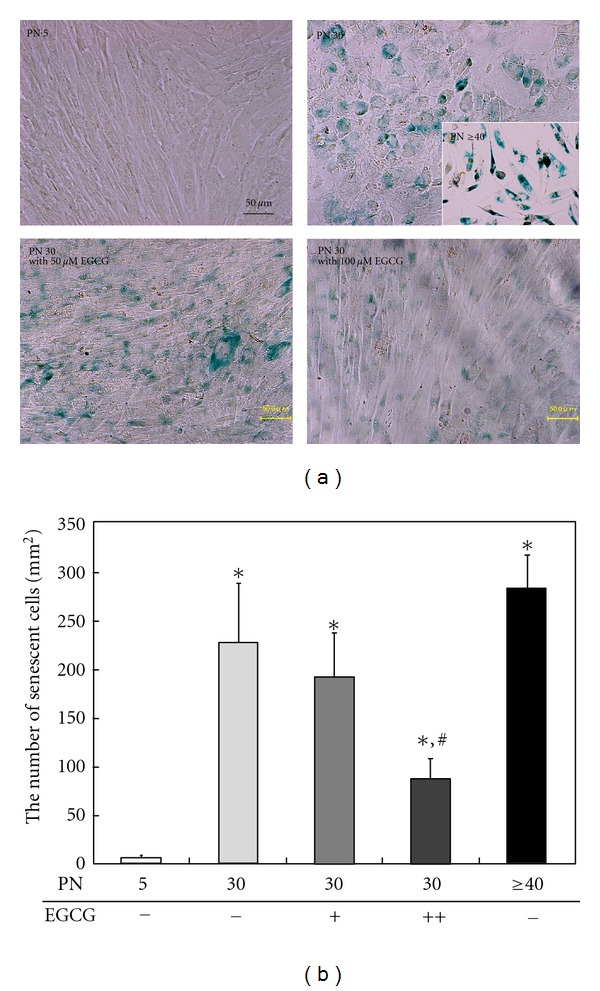
SABG expression (a) of serially passaged HDFs in the absence or presence of 50 and 100 μM EGCG. The quantitative result (b) showed that the HDFs at early passage (PN 5) that were not treated with EGCG did not stain blue, but the cells at late passage (PN 30 or ≥40) showed much blue staining of senescent cells. Serial passage-induced senescence in HDFs was partly prevented at 50 μM EGCG, while 100 μM EGCG treatment significantly reduced the number of senescent cells. All variables were tested in three independent cultures for each experiment, which was repeated twice independently (n = 6). The results are reported as a mean ± SD and analyzed by a Tukey HSD test. *P < 0.05 versus nontreated cells of 5 PN; # P < 0.05 versus nontreated cells of 30 or ≥40 PN.
3.3. Cell Cycle Progression in Serially Passaged Primary Cells before and after EGCG Treatment
To quantify cell cycle progression, the DNA content was analyzed by FACS with PI staining (Table 2). In RVSMCs at late passage (20 PN) without EGCG treatment, 82.1% of the cells had arrested at the G0/G1 phase with concomitant decrease in the S phase (Table 2(a)). However, RVSMCs treated with 50 μM EGCG showed that the cell populations at the G0/G1, S, and G2/M phases returned to 61.0, 24.4, and 14.6%, respectively, after serial passage, although they were not the normal levels. At late passage (30 PN), without or with 50 μM EGCG, the number of HDFs at the G0/G1 phase significantly (P < 0.05) increased, while the cell population in the S phase significantly (P < 0.05) decreased (Table 2(b)). Cells that reach replicative senescence are impaired in their ability to undergo cell division and are unable to pass the G1/S restriction point [27]. Accordingly, senescent cells following serum stimulation can express early and middle G1 genes, but not late G1 or S phase genes [22]. This inability to traverse the G1/S barrier results from the inability of senescent cells to activate complexes of CDK 2 with cyclin E and cyclin D [28].
Table 2.
Cell cycle progression in serially passaged RVSMCs (a), HDFs (b), and HACs (c) before and after EGCG treatment.
(a)
| RVSMCs | % Cell population | ||
|---|---|---|---|
| G0/G1 | S | G2M | |
| Controla | 52.5 ± 4.3 | 35.7 ± 5.1 | 11.8 ± 3.3 |
| non-treated | 82.1 ± 8.2* | 8.4 ± 2.8* | 9.5 ± 5.2 |
| EGCG-treated | 61.0 ± 4.0∗,# | 24.4 ± 4.7∗,# | 14.6 ± 4.6 |
(b)
| HDFs | % Cell population | ||
|---|---|---|---|
| G0/G1 | S | G2M | |
| Controla | 52.2 ± 5.2 | 31.3 ± 4.2 | 16.5 ± 3.8 |
| non-treated | 78.3 ± 7.1* | 8.4 ± 3.1* | 13.3 ± 4.6 |
| 50 μM EGCG-treated | 69.4 ± 6.0∗,# | 15.4 ± 3.6∗,# | 15.2 ± 4.9 |
| 100 μM EGCG-treated | 58.1 ± 5.2# | 27.2 ± 6.3# | 14.7 ± 5.5 |
(c)
| HACs | % Cell population | ||
|---|---|---|---|
| G0/G1 | S | G2M | |
| Controla | 71.4 ± 7.1 | 14.9 ± 5.8 | 13.7 ± 4.0 |
| non-treated | 90.5 ± 8.8* | 5.1 ± 2.0* | 4.4 ± 1.5* |
| EGCG-treated | 75.6 ± 6.5# | 11.7 ± 3.5# | 12.7 ± 3.4# |
(aProliferating cells at early passage (PN 3 or 5)). All variables were tested in three independent cultures for each experiment, which was repeated twice independently (n = 6). The results are reported as a mean ± SD and analyzed by a Tukey HSD test. *P < 0.05 versus control; # P < 0.05 versus non-treated cells.
On the other hand, the treatment with 100 μM EGCG induced the recovery of cell cycle progression close to the normal level. In particular, the number of cells arrested at the G0/G1 phase was significantly (P < 0.05) low in the cells treated with EGCG at 100 μM. Cyclin D is a protein that contributes to the early G1 phase and G1/S transition by binding to CDK4 and CDK6 [19], and its expression in the cells at late passage treated with kinetin or selenium was increased as compared to the expression in untreated cells [26]. Defects in CDK4 and CDK6 activity, caused by both a decrease in CDK4 protein level and increased expression of CDK inhibitors p21 and p16, are responsible for cellular senescence [29]. Accordingly, human fibroblasts with knocked-out p21 bypass replicative senescence and become immortalized [30]. The progression of cell cycle in HACs before and after EGCG treatment showed the similar pattern to that in HDFs (Table 2(c)). Nevertheless, precise mechanisms for this effect of EGCG remain not to be elucidated yet.
3.4. Effects of EGCG on Sirt1 and Acetylated p53 Expression in Serially Passaged and H2O2-Treated HDFs
The p53, a tumor suppressor protein, can induce either cell cycle arrest or apoptosis in response to stress signals such as DNA damage and reactive oxygen species (ROS) [31]. It has been reported that p53 acetylation, which promotes cellular senescence, can be regulated by the Sirt1, the human homolog of yeast SIR2, a protein that modulates lifespan [32]. It is well established that reducing food intake (calorie restriction) extends the life span in a wide range of species [33–35]. The protein involved in this life span extension is the Sirt1, an enzyme that belongs to a nicotinamide adenine dinucleotide (NAD)+-dependent protein deacetylases. SIRs regulate gene silencing, DNA repair, rDNA recombination, and ageing, apart from regulating programmed cell death [35]. Furthermore, it has been demonstrated that neurons in neurodegenerative disease are rescued by the overexpression of Sirt1, induced by either calorie restriction or administration of resveratrol [36, 37]. To characterize potential mechanisms involved in the senescence preventive activity of EGCG, the expression levels of such proteins as Sirt1, acetylated p53, and p53 in HDFs after serial passage in the absence or presence of EGCG were examined by western blot analysis (Figure 3). The Sirt1 expression slightly decreased as the PN increased up to 30, whereas EGCG maintained its expression level to some extent even after 30 passages. On the contrary, the expression levels of acetylated p53 and p53 were remarkably enhanced after serial passage to 30, while they dramatically decreased by EGCG treatment. We could get some meaningful results for the suppressive effects of EGCG on the acetylated p53 expression in serially passaged RVSMCs like HDFs, but not in HACs (data not shown). These findings might be partly explained by the fact that HACs were the most sensitive to EGCG among the primary cells employed in this study (Table 1). Generally, articular chondrocytes exhibit an age-related decline in proliferative and synthetic capacity while maintaining the ability to produce proinflammatory mediators and matrix degrading enzymes [38]. Although the replicative senescence with serial passage in HACs contributes to the propensity to lose their ability to divide, their function may begin to deteriorate before they reach cell cycle arrest, which includes abnormal protein synthesis, altered growth factor responses, and longer population doubling times [39].
Figure 3.
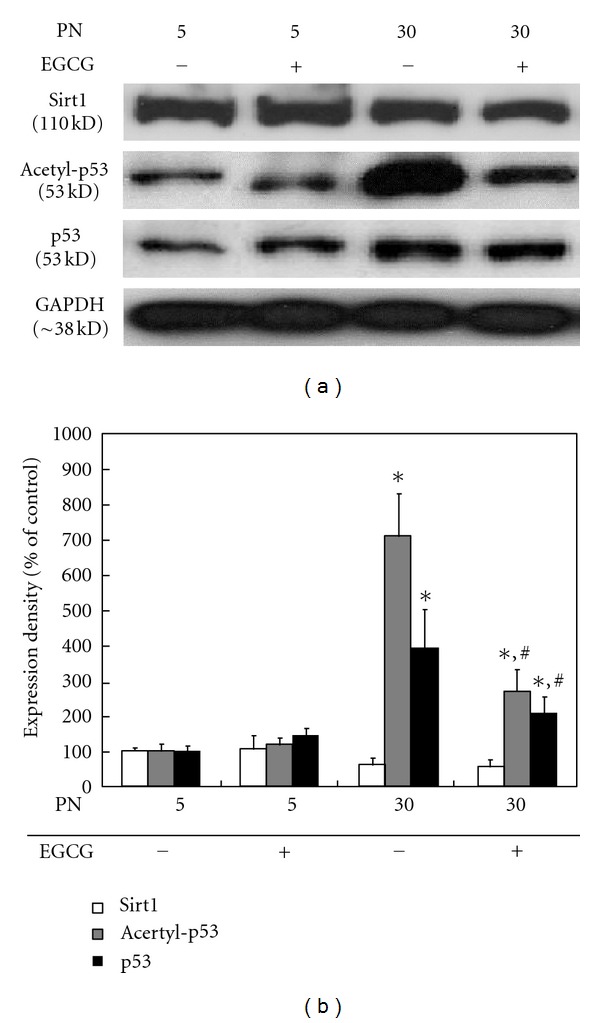
Effects of EGCG on Sirt1, acetylated p53, and p53 expression in serially passaged HDFs. After treatment with 100 μM EGCG, the expression levels of Sirt1, acetylated p53, and p53 (a) were determined by western blotting as described in Section 2. Results from representative experiments were normalized to GAPDH expression by densitometry. The quantitative result (b) is shown below. All variables were tested in three independent cultures for each experiment, which was repeated twice independently (n = 6). The results are reported as a mean ± SD and analyzed by a Tukey HSD test. *P < 0.05 versus nontreated cells of 5 PN; # P < 0.05 versus nontreated cells of 30 PN.
These results were compared with the effects of EGCG on alterations in expression of Sirt1, acetylated p53, and p21 in HDFs treated with 150 μM H2O2 (Figure 4). Some reports have already revealed that H2O2 treatment induces the cellular senescence by changing the intracellular ROS [40, 41]. The expression of Sirt1 was little changed in spite of H2O2 treatment. However, the expression of acetylated p53 and p21, which is a transcriptional target of p53, significantly (P < 0.05) increased by H2O2 treatment. H2O2 was shown to accelerate cellular senescence by accumulation of acetylated p53 via decrease in the function of sirt1 by NAD+ depletion [35]. On the other hand, H2O2-induced p53 acetylation and p21 expression decreased by EGCG treatment. It was reported that the expression of p16, p21, p27, and p53 in primary cells treated with antiaging agents such as kinetin and selenium was significantly reduced [25]. It is considered that Sirt1 might allow the repair of oxidative stress-induced damage to the intracellular proteins [42]. This possibility is explained partly by the fact that EGCG could partially maintain the activity of Sirt1 and concomitantly stimulate p53 acetylation.
Figure 4.
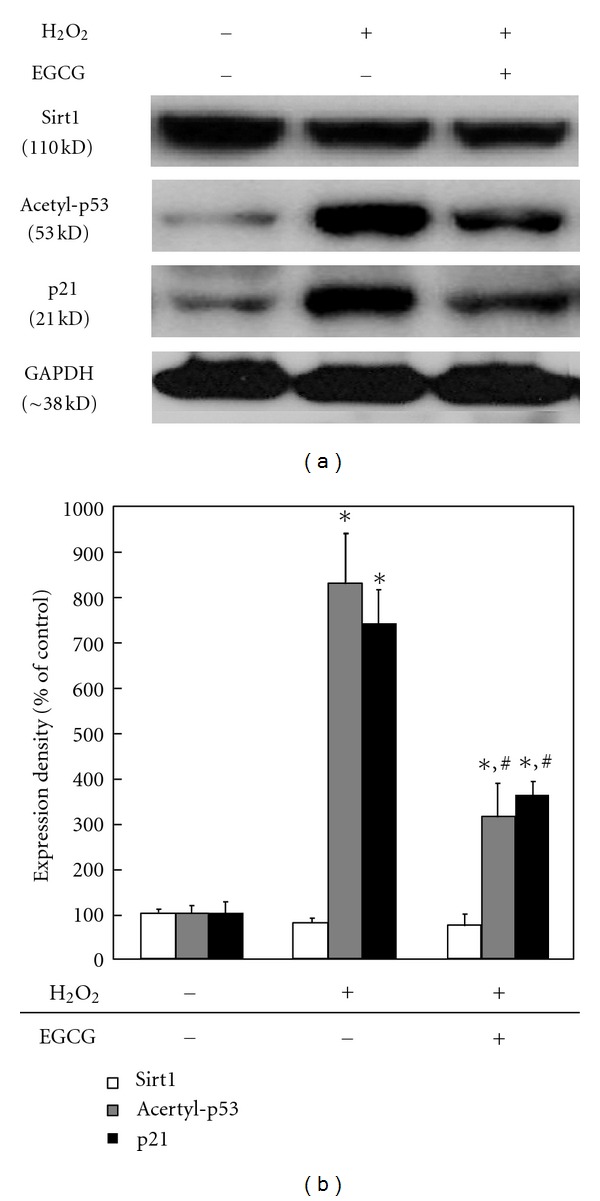
Effects of EGCG on Sirt1, acetylated p53, and p21 expression in H2O2-treated HDFs. After treatment with 100 μM EGCG, the expression levels of Sirt1, acetylated p53, and p21 (a) were determined by western blotting as described in Section 2. Results from representative experiments were normalized to GAPDH expression by densitometry. The quantitative result (b) is shown below. All variables were tested in three independent cultures for each experiment, which was repeated twice independently (n = 6). The results are reported as a mean ± SD and analyzed by a Tukey HSD test. *P < 0.05 versus nontreated cells of 5 PN; # P < 0.05 versus nontreated cells of 30 PN.
3.5. Differential Incorporation Pattern of FITC-EGCG into Proliferating versus Senescent HDFs
To compare the internalization of EGCG into the cytoplasm and its further nuclear translocation in proliferating (PN 5) HDFs with those of their senescent (PN 30) counterparts, fluorescence microscopy was performed in both cells treated with 100 μM FITC-EGCG. Although the cellular response to FITC-EGCG and its binding pattern to membrane receptors would be different from those of EGCG, FITC-EGCG was seen mainly at the cytoplasm of the proliferating cells, but not at the nucleus after 8 h of treatment (Figure 5(a)). In contrast, FITC-EGCG was entirely distributed inside the senescent cells including the cytoplasm and nucleus (Figure 5(b)). This incorporation pattern of FITC-EGCG into the senescent cells was almost similar to that of L-929 fibroblastic cell line [23].
Figure 5.
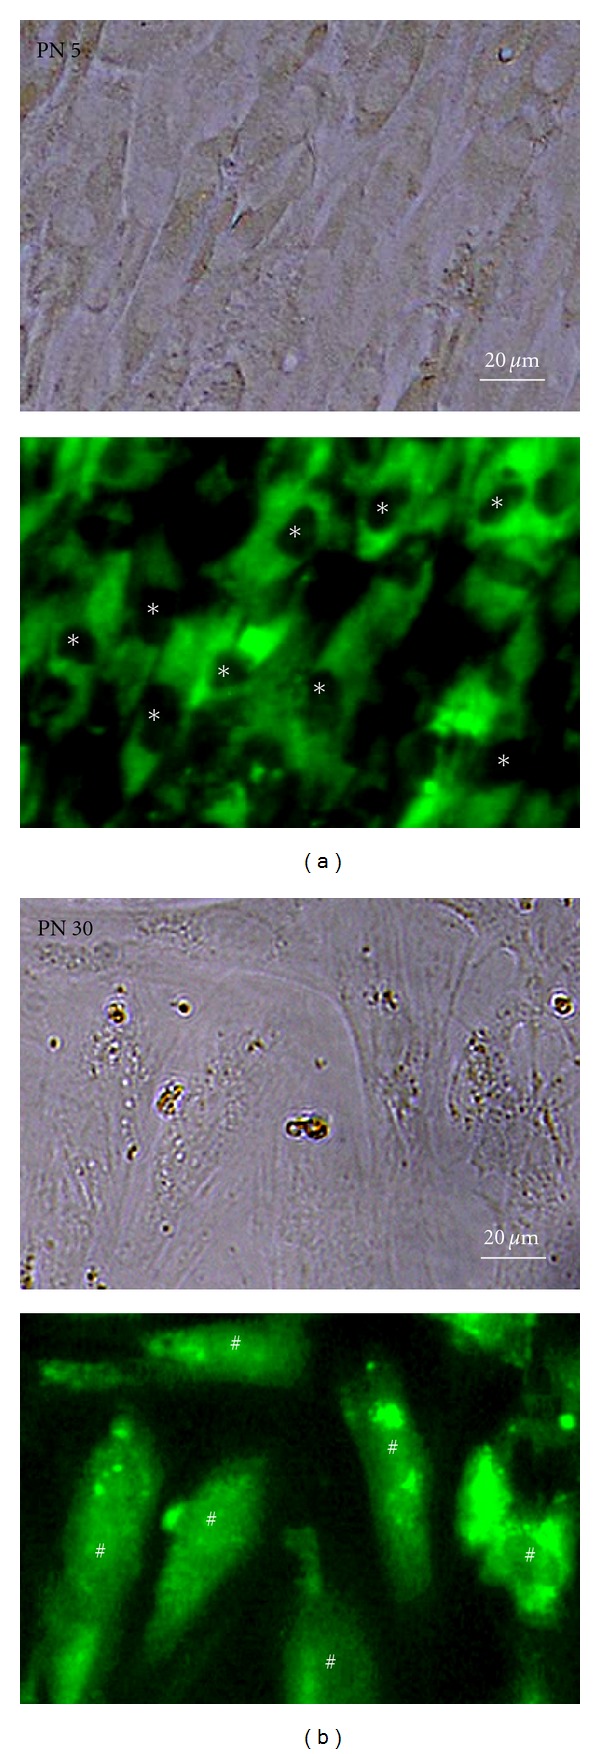
Fluorescence microscopic photographs of proliferating (PN 5) (a) and senescent (PN 30) (b) HDFs treated with 100 μM FITC-EGCG for 8 h. The micrographs (magnification, ×250) shown in this figure are obtained with a fluorescence microscope and representative of six independent experiments with similar results. The asterisks in (a) and sharps in (b) indicate the cell nucleus. All photographs (original magnification, ×250) shown in this figure are representative of six independent experiments with similar results.
These results were more confirmed by confocal microscopy performed under the same conditions as fluorescence microscopy. FITC-EGCG was observed to be adsorbed onto the membrane and incorporated in the cytoplasm of the proliferating HDFs, particularly with intense bright green fluorescence (Figure 6(a)). At higher magnification, FITC-EGCG was clearly found to be partially translocated into the nucleus, bound to endosome-like structures. This nuclear translocation pattern of FITC-EGCG in the proliferating cells was completely different from that in the senescent cells, which is considered as an important contributor to the differential responses to EGCG in proliferating versus senescent cells. Confocal micrographs of the senescent cells showed that FITC-EGCG was widely distributed into the cytoplasm and the nucleus (Figure 6(b)). Moreover, the senescent cells were subjected to the nuclear translocation of FITC-EGCG comparable to normal cells experiencing apoptosis [21] and human fibrosarcoma (HT-1080) cells (as the cancer counterparts of HDFs) [31]. Although the exact mechanism of the incorporation of EGCG into the cells has not been fully elucidated yet, some evidence has demonstrated that EGCG can be bound to the membrane and internalized into the cytoplasm and nucleus of cancer cells such as PC-9 and HT-29 cells treated with [3H]EGCG [43, 44]. These quantitative results using [3H]EGCG agree well with our qualitative results showing that the FITC-EGCG was incorporated into the cytoplasm of the proliferating cells and their senescent counterparts. However, the nuclear translocation pattern of FITC-EGCG in the proliferating cells was completely different from that in the senescent cells. Another study has revealed that expression of the metastasis-associated 67 kDa laminin receptor might confer EGCG responsiveness to cancer cells, suggesting that the gallate moiety of EGCG may be critical for receptor binding and subsequent activity [45]. These results imply that FITC-EGCG can be incorporated into the cytoplasm of the cells, irrespective of the proliferating and senescent, through binding to specific receptors and forming complexes with them, whereas it may be differentially translocated into the nucleus in the proliferating versus the senescent cells.
Figure 6.
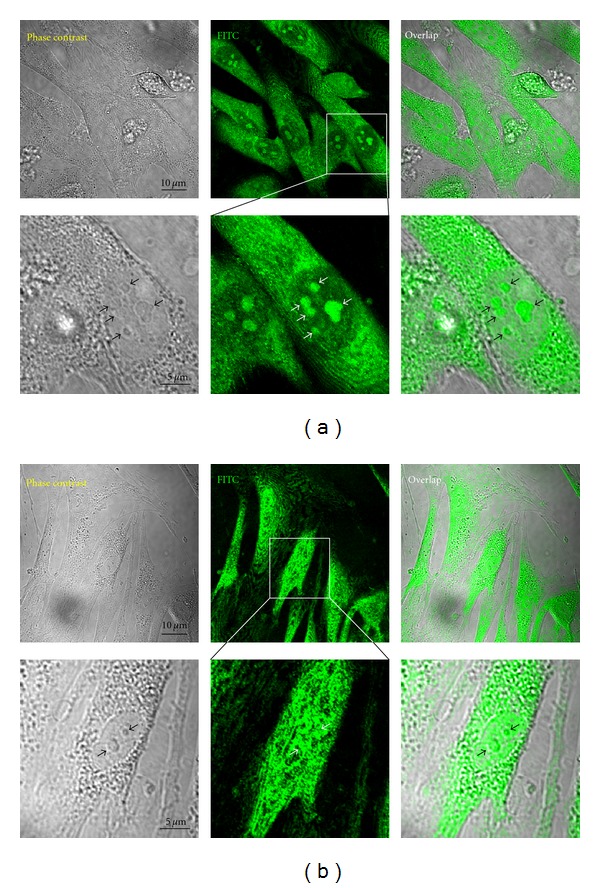
Differential cellular uptake of FITC-EGCG in proliferating (PN 5) (a) versus senescent (PN 30) (b) HDFs. Cells were incubated with 100 μM FITC-EGCG for 8 h and then observed under a confocal laser scanning microscope. The micrographs shown in this figure are representative of six independent experiments, showing similar results (original magnification: ×500 and ×2000 ((a) and (b), resp.,)). Arrows in this figure indicate endosome-like structures, where FITC-EGCG was bound for translocation into the nucleus.
In conclusion, we found that EGCG at 100 μM, which might be difficult to achieve through diet, could prevent serial passage- and H2O2-induced senescence in HDFs via significantly suppressing the p53 acetylation without affecting the Sirt1 activity as well as showing the differential cellular response to EGCG and uptake pattern of EGCG in proliferating versus senescent HDFs. From these results, it is suggested that EGCG may be exploited to craft strategies for the development of an antiaging or age-delaying agent. Although the concentrations of EGCG remained in the plasma after oral and intraperitoneal treatments may be much lower than those used here [46], such preventive effects of EGCG against cellular senescence can occur at relatively higher levels. Thus, directions for future research include investigations of the physiological relevance of the findings in relationship to the normal consumption of green tea, the pharmacokinetics and roles of EGCG metabolites, and the potential synergisms of EGCG with other antioxidants or drugs.
Supplementary Material
Materials and Methods. Fluorescence Microscopic Observation for Cellular Uptake of FITC-EGCG. To compare the cellular uptake patterns of EGCG into human dermal fibroblasts (HDFs) (primary cells at 5 ~ 7 passages) and L-929 cells (murine fibroblastic cell line), fluorescence microscopy was performed in the cells either suspended or cultured with FITC-EGCG treatment. After 30 min of preincubation in phosphate-buffered saline (PBS, pH 7.4), suspended cells were treated with FITC-EGCG (50 µM) in PBS for 4 h, washed three times with PBS and then centrifuged at 250 × g for 5 min at 4°C. After centrifugation, the cell pellets were reuspended in PBS and fixed with 3.5% paraformaldehyde in 0.1 M phosphate buffer (pH 7.0) for 5 min at room temperature. The incorporation of FITC-EGCG into the cytoplasm of the cells and its subsequent nuclear translocation were immediately observed under a fluorescence microscope (Biozero – 8000, Keyence, Osaka, Japan). For studies in cultured cells, 2 × 10⁵ cells in growth medium were plated into each well of a 24-well plate. When reached 80% confluence, the cells were treated with FITC-EGCG (100 µM) for 8 h and then fixed with 3.5% paraformaldehyde as described above. After incubation, the cellular uptake of FITC-EGCG was observed under a fluorescence microscope.
Conflict of Interests
The authors declare that there is no conflict of interests.
Acknowledgments
This work was partly supported by a Grant from the Fundamental R&D Program for Core Technology of Materials funded by the Ministry of Knowledge Economy, Republic of Korea (K0006028) and by Basic Science Research Program through the National Research Foundation of Korea (NRF) funded by the Ministry of Education, Science, and Technology (2012-0003645).
Abbreviations
- Ab:
Antibody
- CDK:
Cyclin-dependent kinase
- DMEM:
Dulbecco's modified Eagle's medium
- EGCG:
Epigallocatechin3-O-gallate
- FBS:
Fetal bovine serum
- FITC:
Fluorescein-4-isothiocyanate
- HACs:
Human articular chondrocytes
- HDFs:
Human dermal fibroblasts
- HSD:
Honestly significant difference
- NAD:
Nicotinamide adenine dinucleotide
- PBS:
Phosphate-buffered saline
- PI:
Propidium iodide
- PN:
Passage number
- ROS:
Reactive oxygen species
- RVSMCs:
Rat vascular smooth muscle cells
- SD:
Standard deviation
- SABG:
Senescence-associated β-galactosidase
- SIR:
Silent information regulator
- WST-8:
Water-soluble tetrazolium salt.
References
- 1.Hayflick L, Moorhead PS. The serial cultivation of human diploid cell strains. Experimental Cell Research. 1961;25(3):585–621. doi: 10.1016/0014-4827(61)90192-6. [DOI] [PubMed] [Google Scholar]
- 2.Collado M, Blasco MA, Serrano M. Cellular senescence in cancer and aging. Cell. 2007;130(2):223–233. doi: 10.1016/j.cell.2007.07.003. [DOI] [PubMed] [Google Scholar]
- 3.Park S-J, Ahmad F, Philp A, et al. Resveratrol ameliorates aging-related metabolic phenotypes by inhibiting cAMP phosphodiesterases. Cell. 2012;148(3):421–433. doi: 10.1016/j.cell.2012.01.017. [DOI] [PMC free article] [PubMed] [Google Scholar]
- 4.Allard JS, Perez E, Zou S, de Cabo R. Dietary activators of Sirt1. Molecular and Cellular Endocrinology. 2009;299(1):58–63. doi: 10.1016/j.mce.2008.10.018. [DOI] [PMC free article] [PubMed] [Google Scholar]
- 5.Blagosklonny MV. An anti-aging drug today: from senescence-promoting genes to anti-aging pill. Drug Discovery Today. 2007;12(5-6):218–224. doi: 10.1016/j.drudis.2007.01.004. [DOI] [PubMed] [Google Scholar]
- 6.Howitz KT, Bitterman KJ, Cohen HY, et al. Small molecule activators of sirtuins extend Saccharomyces cerevisiae lifespan. Nature. 2003;425(6954):191–196. doi: 10.1038/nature01960. [DOI] [PubMed] [Google Scholar]
- 7.Mak JC. Potential role of green tea catechins in various disease therapies: progress and promise. Clinical and Experimental Pharmacology and Physiology. 2012;39(3):265–273. doi: 10.1111/j.1440-1681.2012.05673.x. [DOI] [PubMed] [Google Scholar]
- 8.Ahmed S. Green tea polyphenol epigallocatechin 3-gallate in arthritis: progress and promise. Arthritis Research and Therapy. 2010;12(2, article 208) doi: 10.1186/ar2982. [DOI] [PMC free article] [PubMed] [Google Scholar]
- 9.Pandey KB, Rizvi SI. Plant polyphenols as dietary antioxidants in human health and disease. Oxidative Medicine and Cellular Longevity. 2009;2(5):270–278. doi: 10.4161/oxim.2.5.9498. [DOI] [PMC free article] [PubMed] [Google Scholar]
- 10.Obrenovich ME, Nair NG, Beyaz A, Aliev G, Reddy VP. The role of polyphenolic antioxidants in health, disease, and aging. Rejuvenation Research. 2010;13(6):631–643. doi: 10.1089/rej.2010.1043. [DOI] [PubMed] [Google Scholar]
- 11.Queen BL, Tollefsbol TO. Polyphenols and aging. Current Aging Science. 2010;3(1):34–42. doi: 10.2174/1874609811003010034. [DOI] [PMC free article] [PubMed] [Google Scholar]
- 12.Kim JA. Mechanisms underlying beneficial health effects of tea catechins to improve insulin resistance and endothelial dysfunction. Endocrine, Metabolic and Immune Disorders. 2008;8(2):82–88. doi: 10.2174/187153008784534349. [DOI] [PubMed] [Google Scholar]
- 13.Bulku E, Zinkovsky D, Patel P, et al. A novel dietary supplement containing multiple phytochemicals and vitamins elevates hepatorenal and cardiac antioxidant enzymes in the absence of significant serum chemistry and genomic changes. Oxidative Medicine and Cellular Longevity. 2010;3(2):129–144. doi: 10.4161/oxim.3.2.7. [DOI] [PMC free article] [PubMed] [Google Scholar]
- 14.Mandel SA, Amit T, Weinreb O, Youdim MBH. Understanding the broad-spectrum neuroprotective action profile of green tea polyphenols in aging and neurodegenerative diseases. Journal of Alzheimer’s Disease. 2011;25(2):187–208. doi: 10.3233/JAD-2011-101803. [DOI] [PubMed] [Google Scholar]
- 15.Stangl V, Lorenz M, Stangl K. The role of tea and tea flavonoids in cardiovascular health. Molecular Nutrition and Food Research. 2006;50(2):218–228. doi: 10.1002/mnfr.200500118. [DOI] [PubMed] [Google Scholar]
- 16.Shanmugam MK, Kannaiyan R, Sethi G. Targeting cell signaling and apoptotic pathways by dietary agents: role in the prevention and treatment of cancer. Nutrition and Cancer. 2011;63(2):161–173. doi: 10.1080/01635581.2011.523502. [DOI] [PubMed] [Google Scholar]
- 17.Pan MH, Lai CS, Dushenkov S, Ho CT. Modulation of inflammatory genes by natural dietary bioactive compounds. Journal of Agricultural and Food Chemistry. 2009;57(11):4467–4477. doi: 10.1021/jf900612n. [DOI] [PubMed] [Google Scholar]
- 18.Bae JY, Kanamune J, Han DW, Matsumura K, Hyon SH. Reversible regulation of cell cycle-related genes by epigallocatechin gallate for hibernation of neonatal human tarsal fibroblasts. Cell Transplantation. 2009;18(4):459–469. doi: 10.3727/096368909788809776. [DOI] [PubMed] [Google Scholar]
- 19.Cho HH, Han DW, Matsumura K, Tsutsumi S, Hyon SH. The behavior of vascular smooth muscle cells and platelets onto epigallocatechin gallate-releasing poly(l-lactide-co-ε-caprolactone) as stent-coating materials. Biomaterials. 2008;29(7):884–893. doi: 10.1016/j.biomaterials.2007.10.052. [DOI] [PubMed] [Google Scholar]
- 20.Bae JY, Han DW, Matsumura K, Wakitani S, Nawata M, Hyon SH. Nonfrozen preservation of articular cartilage by epigallocatechin-3-gallate reversibly regulating cell cycle and nf-κB expression. Tissue Engineering A. 2010;16(2):595–603. doi: 10.1089/ten.TEA.2009.0484. [DOI] [PubMed] [Google Scholar]
- 21.Han DW, Lee MH, Kim HH, Hyon SH, Park JC. Epigallocatechin-3-gallate regulates cell growth, cell cycle and phosphorylated nuclear factor-κB in human dermal fibroblasts. Acta Pharmacologica Sinica. 2011;32(5):637–646. doi: 10.1038/aps.2011.17. [DOI] [PMC free article] [PubMed] [Google Scholar]
- 22.Marcotte R, Lacelle C, Wang E. Senescent fibroblasts resist apoptosis by downregulating caspase-3. Mechanisms of Ageing and Development. 2004;125(10-11):777–783. doi: 10.1016/j.mad.2004.07.007. [DOI] [PubMed] [Google Scholar]
- 23.Han DW, Matsumura K, Kim B, Hyon SH. Time-dependent intracellular trafficking of FITC-conjugated epigallocatechin-3-O-gallate in L-929 cells. Bioorganic and Medicinal Chemistry. 2008;16(22):9652–9659. doi: 10.1016/j.bmc.2008.10.009. [DOI] [PubMed] [Google Scholar]
- 24.Meng Q, Velalar CN, Ruan R. Effects of epigallocatechin-3-gallate on mitochondrial integrity and antioxidative enzyme activity in the aging process of human fibroblast. Free Radical Biology and Medicine. 2008;44(6):1032–1041. doi: 10.1016/j.freeradbiomed.2007.11.023. [DOI] [PubMed] [Google Scholar]
- 25.Ben-Porath I, Weinberg RA. When cells get stressed: an integrative view of cellular senescence. Journal of Clinical Investigation. 2004;113(1):8–13. doi: 10.1172/JCI200420663. [DOI] [PMC free article] [PubMed] [Google Scholar]
- 26.Lee JH, Chung KY, Bang D, Lee KH. Searching for aging-related proteins in human dermal microvascular endothelial cells treated with anti-aging agents. Proteomics. 2006;6(4):1351–1361. doi: 10.1002/pmic.200500287. [DOI] [PubMed] [Google Scholar]
- 27.Cristofalo VJ, Phillips PD, Sorger T, Gerhard G. Alterations in the responsiveness of senescent cells to growth factors. Journals of Gerontology. 1989;44(6):55–62. doi: 10.1093/geronj/44.6.55. [DOI] [PubMed] [Google Scholar]
- 28.Dulic V, Drullinger LF, Lees E, Reed SI, Stein GH. Altered regulation of G1 cyclins in senescent human diploid fibroblasts: accumulation of inactive cyclin E-Cdk2 and cyclin D1-Cdk2 complexes. Proceedings of the National Academy of Sciences of the United States of America. 1993;90(23):11034–11038. doi: 10.1073/pnas.90.23.11034. [DOI] [PMC free article] [PubMed] [Google Scholar]
- 29.Brown JP, Wei W, Sedivy JM. Bypass of senescenoe after disruption of p21(CIP1)/(WAF1) gene in normal diploid human fibroblasts. Science. 1997;277(5327):831–834. doi: 10.1126/science.277.5327.831. [DOI] [PubMed] [Google Scholar]
- 30.Stein GH, Drullinger LF, Robetorye RS, Pereira-Smith OM, Smith JR. Senescent cells fail to express cdc2, cycA, and cycB in response to mitogen stimulation. Proceedings of the National Academy of Sciences of the United States of America. 1991;88(24):11012–11016. doi: 10.1073/pnas.88.24.11012. [DOI] [PMC free article] [PubMed] [Google Scholar]
- 31.Lee MH, Han DW, Hyon SH, Park JC. Apoptosis of human fibrosarcoma HT-1080 cells by epigallocatechin-3-O-gallate via induction of p53 and caspases as well as suppression of Bcl-2 and phosphorylated nuclear factor-κB. Apoptosis. 2011;16(1):75–85. doi: 10.1007/s10495-010-0548-y. [DOI] [PubMed] [Google Scholar]
- 32.Kume S, Haneda M, Kanasaki K, et al. Silent information regulator 2 (SIRT1) attenuates oxidative stress-induced mesangial cell apoptosis via p53 deacetylation. Free Radical Biology and Medicine. 2006;40(12):2175–2182. doi: 10.1016/j.freeradbiomed.2006.02.014. [DOI] [PubMed] [Google Scholar]
- 33.Cohen HY, Miller C, Bitterman KJ, et al. Calorie restriction promotes mammalian cell survival by inducing the SIRT1 deacetylase. Science. 2004;305(5682):390–392. doi: 10.1126/science.1099196. [DOI] [PubMed] [Google Scholar]
- 34.Kennedy BK, Steffen KK, Kaeberlein M. Ruminations on dietary restriction and aging. Cellular and Molecular Life Sciences. 2007;64(11):1323–1328. doi: 10.1007/s00018-007-6470-y. [DOI] [PMC free article] [PubMed] [Google Scholar]
- 35.Pallàs M, Verdaguer E, Tajes M, Gutierrez-Cuesta J, Camins A. Modulation of sirtuins: New targets for antiageing. Recent Patents on CNS Drug Discovery. 2008;3(1):61–69. doi: 10.2174/157488908783421492. [DOI] [PubMed] [Google Scholar]
- 36.Srivastava S, Haigis MC. Role of sirtuins and calorie restriction in neuroprotection: implications in Alzheimer’s and Parkinson’s diseases. Current Pharmaceutical Design. 2011;17(31):3418–3433. doi: 10.2174/138161211798072526. [DOI] [PubMed] [Google Scholar]
- 37.Kelly GS. A review of the sirtuin system, its clinical implications, and the potential role of dietary activators like resveratrol: part 2. Alternative Medicine Review. 2010;15(4):313–328. [PubMed] [Google Scholar]
- 38.Loeser RF. Aging and osteoarthritis: the role of chondrocyte senescence and aging changes in the cartilage matrix. Osteoarthritis and Cartilage. 2009;17(8):971–979. doi: 10.1016/j.joca.2009.03.002. [DOI] [PMC free article] [PubMed] [Google Scholar]
- 39.Martin JA, Buckwalter JA. Aging, articular cartilage chondrocyte senescence and osteoarthritis. Biogerontology. 2002;3(5):257–264. doi: 10.1023/a:1020185404126. [DOI] [PubMed] [Google Scholar]
- 40.Wang Y, Meng A, Zhou D. Inhibition of phosphatidylinostol 3-kinase uncouples H2O2-induced senescent phenotype and cell cycle arrest in normal human diploid fibroblasts. Experimental Cell Research. 2004;298(1):188–196. doi: 10.1016/j.yexcr.2004.04.012. [DOI] [PubMed] [Google Scholar]
- 41.Furukawa A, Tada-Oikawa S, Kawanishi S, Oikawa S. H2O2 accelerates cellular senescence by accumulation of acetylated p53 via decrease in the function of SIRT1 by NAD+ depletion. Cellular Physiology and Biochemistry. 2007;20(1–4):45–54. doi: 10.1159/000104152. [DOI] [PubMed] [Google Scholar]
- 42.Afanas’ev I. Reactive oxygen species and age-related genes p66shc, Sirtuin, FOX03 and Klotho in senescence. Oxidative medicine and cellular longevity. 2010;3(2):77–85. doi: 10.4161/oxim.3.2.2. [DOI] [PMC free article] [PubMed] [Google Scholar]
- 43.Okabe S, Suganuma M, Hayashi M, Sueoka E, Komori A, Fujiki H. Mechanisms of growth inhibition of human lung cancer cell line, PC-9, by tea polyphenols. Japanese Journal of Cancer Research. 1997;88(7):639–643. doi: 10.1111/j.1349-7006.1997.tb00431.x. [DOI] [PMC free article] [PubMed] [Google Scholar]
- 44.Hong J, Lu H, Meng X, Ryu JH, Hara Y, Yang CS. Stability, cellular uptake, biotransformation, and efflux of tea polyphenol (-)-epigallocatechin-3-gallate in HT-29 human colon adenocarcinoma cells. Cancer Research. 2002;62(24):7241–7246. [PubMed] [Google Scholar]
- 45.Tachibana H, Koga K, Fujimura Y, Yamada K. A receptor for green tea polyphenol EGCG. Nature Structural and Molecular Biology. 2004;11(4):380–381. doi: 10.1038/nsmb743. [DOI] [PubMed] [Google Scholar]
- 46.Lambert JD, Lee MJ, Lu H, et al. Epigallocatechin-3-Gallate is absorbed but extensively glucuronidated following oral administration to mice. Journal of Nutrition. 2003;133(12):4172–4177. doi: 10.1093/jn/133.12.4172. [DOI] [PubMed] [Google Scholar]
Associated Data
This section collects any data citations, data availability statements, or supplementary materials included in this article.
Supplementary Materials
Materials and Methods. Fluorescence Microscopic Observation for Cellular Uptake of FITC-EGCG. To compare the cellular uptake patterns of EGCG into human dermal fibroblasts (HDFs) (primary cells at 5 ~ 7 passages) and L-929 cells (murine fibroblastic cell line), fluorescence microscopy was performed in the cells either suspended or cultured with FITC-EGCG treatment. After 30 min of preincubation in phosphate-buffered saline (PBS, pH 7.4), suspended cells were treated with FITC-EGCG (50 µM) in PBS for 4 h, washed three times with PBS and then centrifuged at 250 × g for 5 min at 4°C. After centrifugation, the cell pellets were reuspended in PBS and fixed with 3.5% paraformaldehyde in 0.1 M phosphate buffer (pH 7.0) for 5 min at room temperature. The incorporation of FITC-EGCG into the cytoplasm of the cells and its subsequent nuclear translocation were immediately observed under a fluorescence microscope (Biozero – 8000, Keyence, Osaka, Japan). For studies in cultured cells, 2 × 10⁵ cells in growth medium were plated into each well of a 24-well plate. When reached 80% confluence, the cells were treated with FITC-EGCG (100 µM) for 8 h and then fixed with 3.5% paraformaldehyde as described above. After incubation, the cellular uptake of FITC-EGCG was observed under a fluorescence microscope.