
Figure 2.
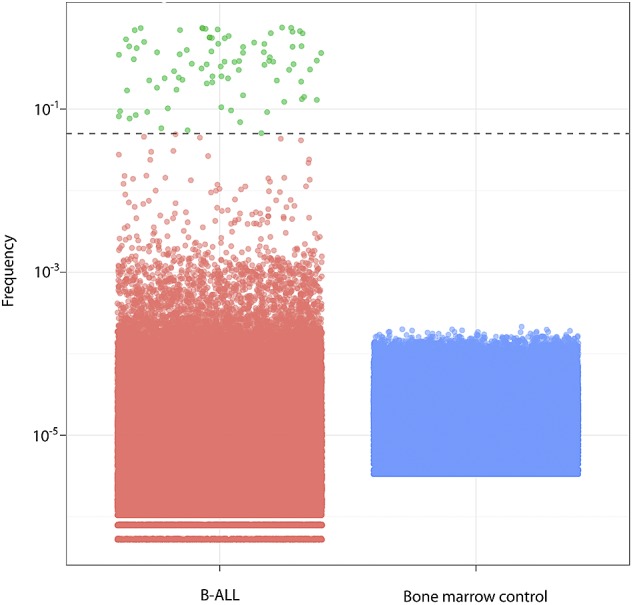
Clone frequencies in B-ALL (green and red) and normal bone marrow controls (blue), with each dot representing a single clone. The dashed line indicates the 5% threshold for index clone selection; green represents B-ALL clones; and red, other clones.