Summary
Meso-diencephalic dopaminergic (mdDA) neurons are critical for motor control and cognitive functioning and their loss or dysfunction is associated with disorders such as Parkinson's disease (PD), schizophrenia and addiction. However, relatively little is known about the molecular mechanisms underlying mdDA neuron development and maintenance. Here, we determined the spatiotemporal map of genes involved in the development of mdDA neurons to gain further insight into their molecular programming. Genome-wide gene expression profiles of the developing ventral mesencephalon (VM) were compared at different developmental stages leading to the identification of novel regulatory roles of neuronal signaling through nicotinic acthylcholine receptors (Chrna6 and Chrnb3 subunits) and the identification of novel transcription factors (Oc2 and 3) involved in the generation of the mdDA neuronal field. We show here that Pitx3, in cooperation with Nurr1, is the critical component in the activation of the Chrna6 and Chrnb3 subunits in mdDA neurons. Furthermore, we provide evidence of two divergent regulatory pathways resulting in the expression of Chrna6 and Chrnb3 respectively.
Keywords: Neuronal, Development, Onecut, Pitx3, Nurr1
Introduction
Mesodiencephalic dopaminergic (mdDA) neurons comprising the substantia nigra (SN) and ventral tegmental area (VTA) are known to be crucial for diverse yet essential brain functions, such as associative motor learning, emotion and reinforcement (Berke and Hyman, 2000). Moreover, dysfunction of the mdDA system has been associated with a number of neurological and psychiatric diseases, such as PD and schizophrenia (Barzilai and Melamed, 2003; Sesack and Carr, 2002). The mdDA system also plays a pivotal role in drug addiction, as many drugs of abuse target mdDA neurons and their projections to stimulate dopamine release in the striatum and prefrontal cortex. Apart from PD, which is due to the progressive and selective loss of mdDA neurons in the SN, most of the neurological and psychiatric disease associated with the mdDA system results from an imbalance in dopamine neurotransmission with no apparent morphological changes (Wong and van Tol, 2003).
Efficacy of transplanted fetal VM tissue in some PD patients has initiated rigorous interest to develop appropriate transplantable neural progenitors from diverse stem cell lineages, with little success (Freed et al., 2001; Olanow et al., 2009). The underlying predicament here lies with our little understanding of mdDA system development. Deeper insights into mdDA system development is imperative not only to develop novel therapeutic approaches to treat PD, but also to have further insight and possibilities to develop pharmacological agents selectively targeted to different mdDA neuronal functions.
The development of mdDA neurons is a tightly controlled and highly dynamic process requiring concerted action of both extrinsic and intrinsic signals during different stages of development. The early developmental process from E10.5 until E13.5 can be categorized into three phases pertaining to the early patterning, fate determination and specification of mdDA neurons. Early patterning is mediated by extrinsic signals such as Shh (sonic hedgehog), FGF8 (fibroblast growth factor 8), TGF-β (transforming growth factor β) and Wnts followed by activation of several key transcription factors including Lmx1a, Lmx1b, En1, En2, Pitx3 and Nurr1 (Smidt and Burbach, 2007; Prakash and Wurst, 2006). Since most of these extrinsic and intrinsic factors bring forth their actions by interacting directly or indirectly with other genes within the mdDA area, we analyzed genome-wide gene expression profiles of the developing ventral mesodiencephalic region at four consecutive time points (E10.5-E13.5) to identify additional key molecular players involved in mdDA neuron development and function.
Through analysis of temporal expression patterns on basis of the expression of known transcriptional regulators, we identified the Chrna6 subunit of cholinergic receptors by following the temporal expression profile of Pitx3. Consecutive analysis of other members of the cholinergic receptor subunit-family identified Chrnb3 and confirmed that both Chrna6 and Chrnb3 are downstream targets of Pitx3 in concert with Nurr1.
In addition, we identified novel transcription factors (Onecut (Oc)2 and 3) that are expressed in the mdDA region at early stages and have a role in the proper generation of the mdDA neuronal field. Taken together, time-line analysis of the developing mesodiencephalon provided data that broadened our understanding of key players involved in the development and adult function of mdDA neurons.
Materials and Methods
Animals
E14.5 Pitx3−/−, Nurr1−/− and Chrna6−/− mice and littermate controls were generated as described previously (Jacobs et al., 2009b; Champtiaux et al., 2002; Saucedo-Cardenas et al., 1998). Heterozygous Pitx3gfp/+ and Pitx3gfp/− embryos were obtained as described (Jacobs et al., 2009b). Pregnant C57BL/6 mice [embryonic day 0.5 (E0.5) is defined as the morning of plug formation] were killed by cervical dislocation in accordance with Institutional animal care and use committee regulations. Embryos were collected in ice-cold HBSS, and ventral mesodiencephalic dissection from embryos at E10.5, E11.5, E12.5 and E13.5 was performed as described previously (Simon et al., 2001) with the rostral extension to include the prosomer (P) 1 and 2 region. For each time point at least two to three pregnant mice were sacrificed.
Microarray analysis
Total RNA was isolated from embryonic ventral midbrain tissue using Trizol (Invitrogen) and purified using RNeasy columns (Qiagen) according to the manufacturer's protocol. All RNA samples were assayed to ensure the highest RNA quality using a NanoDrop ND3300 (NanoDrop Technologies) fluorospectrometer and compared to a set RNA standards. Microarray analysis was performed in triplicates and for each experimental sample a dye swap was performed to correct for dye effects. Each experimental sample consisted of pooled RNA derived from three embryonic VMs, which was hybridized to a reference pool consisting of RNA derived from dissected adult VMs. Microarray analysis was performed as described with slight modifications (Hamatani et al., 2004). Agilent whole mouse genome microarray (Agilent, G4122F) sets were used for all hybridizations. The array set is comprised of 60-mer oligonucleotide probes representing over 41.000 mouse genes and transcripts. Hybridized slides were scanned on an Agilent scanner (G2565AA) at 100% laser power, 30% PMT. After data extraction using ImaGene 8.0 (BioDiscovery), print-tip Loess normalization was performed on mean spot intensities. Data were analyzed using ANOVA (R version 2.2.1/MAANOVA version 0.98-7; http://www.r-project.org). P-values were determined by a permutation F2 test, in which residuals were shuffled 5000 times globally. Genes with P<0.01 after family-wise error correction (or Benjamini-Hochberg correction) were considered significantly changed. ArrayExpress accession: GEO:GSE35326. HCl clustering was done using K-means with Euclidean metrics. Gene ontology (GO) using Cytoscape plugin BiNGO (http://www.cytoscape.org) was performed on the separate timed samples as follows: Significant regulated genes (Manoova, FWER, P<0.001) compared to the reference pool were selected and an additional selection was performed on M values (M>3 or M<−3). The resulting gene-lists were used for BiNGO analysis with a cut-off of P<0.05 (Hypergeometric test, FWER). The categories (GO biological process) that were over-represented after correction were selected.
In situ hybridization (ISH)
ISH was performed as described previously (Smits et al., 2003; Smidt et al., 2004; Kolk et al., 2009). The Chrnb3 ISH material was embedded with Fluorsafe (Calbiochem). The following digoxigenin (DIG)-labeled probes were used: Chrna6, bp 1-255 of the mouse cDNA (NM_021369); Chrnb3, bp 238-492 (NM_173212); Chrna3, bp 426–680 (NM_145129); Chrna4, bp 830–1728 (NM_015730); Chrna5, bp 253–507 of NM_176844; Th, 1142 bp of rat cDNA as described previously (Smidt et al., 1997); Pitx3, bp 1–1243 of the rat coding sequence as described previously (Smidt et al., 1997); En1 as described (Jacobs et al., 2009b); Ahd2 as described (Jacobs et al., 2007); Chrnb2, bp 486–1388 of NM_009602; Oc1, bp 77–754 of NM_008262; Oc2, bp 439–1664 of AY242995 (Genbank); Oc3, bp 361–1102 of NM_139226.3.
Immunohistochemistry (IHC)
Fluorescence/DAB immunohistochemistry was carried out as described previously (Kolk et al., 2009; Fenstermaker et al., 2010). Briefly, following incubation with rabbit anti-Th antibody (Pel-Freez) sections were incubated with goat anti-rabbit Alexafluor-594 or anti-rabbit biotinylated conjugate (Invitrogen), washed extensively with PBS and embedded in 90% glycerol. ABC/DAB staining was performed as described (Smidt et al., 2004).
Tissue culture
Ventral midbrains of Pitx3gfp/+ and Pitx3gfp/− E13.5 embryos were dissected in L15 medium (Gibco) and cultured in Neurobasal Medium (Gibco) supplemented with 2% (v/v) B-27 supplement (Gibco), 18 mM HEPES-KOH (pH 7.5), 0.5 mM l-glutamine, 26 µM β-mercaptoethanol and 100 units/ml penicillin/streptomycin. Cultures were treated with (0.6 mM) or without sodium butyrate (Sigma) for 48 hours.
FACS sorting
Cultured ventral midbrains were dissociated using a Papain Dissociation System (Worthington) and cells were sorted on a Cytopeia Influx cell sorter. Sort gates were set on forward scatter versus side scatter (live cell gate), on forward scatter versus pulse width (elimination of clumps) and on forward scatter versus fluorescence channel 1 (528/38 filter, GFP fluorescence). Cells were sorted using a 100 µm nozzle at a pressure of 15 PSI with an average speed of 7000 cells/second.
Quantitative real-time reverse transcriptase PCR
Total RNA was extracted from sorted cells using RNAeasy columns (Qiagen). One-step real time reverse transcription-polymerase chain reaction (qPCR), to quantify the relative mRNA expression of Chrna6, Chrnb3 and Vmat2 was performed on a light cycler 1.5 (Light Cycler System, Roche Diagnostics) using a 2× Quantitect SYBR-green one-step reverse transcription PCR kit (Qiagen). The primers (Invitrogen) were optimized prior to the relative quantification of gene expression. Sequences for the forward and reverse primers were as follows: 5′-GAGACACTTCGAGTTCCAGCAG-3′ and 5′- GGTCCAGGTTATCACACCGTCA-3′ for Chrna6; 5′- AGCAGACTCCTACCAGTGATGG-3′ and 5′-GGTCAAGAACCTGAGCCACGAA-3′ for Chrnb3; 5′-CCTCTTACGACCTTGCTGAAGG 3′ and 5′- GCTGCCACTTTCGGGAACACAT-3′ for Vmat2; and 5′ AGGATCCAGGAATTGGAGGAC-3′ and 5′ATCACTCAGCTGCTGCTGCAT-3′ for TATA-binding protein (Tbp). The cycle number (Ct) at which the signals crossed a threshold set within the logarithmic phase was recorded. For quantification, we evaluated the difference in cycle threshold (Δt) between the samples of each gene. The efficiency of amplification of each pair of primers was 2. Each sample was normalized with the loading references Tbp. The Ct values used were the means of triplicates. Experiments were repeated at least three times.
Statistical analysis
Quantified results represent the average values of experiments performed in triplicate and presented data represent means with standard errors (s.e.m.). Statistical analysis was performed using Student's t-test (two-way unpaired). P≤0.05 was considered significant and is indicated with a single asterisk, P<0.01 is indicated with triple asterisks.
Results
Spatiotemporal gene expression profiling of the developing ventral mesodiencephalon
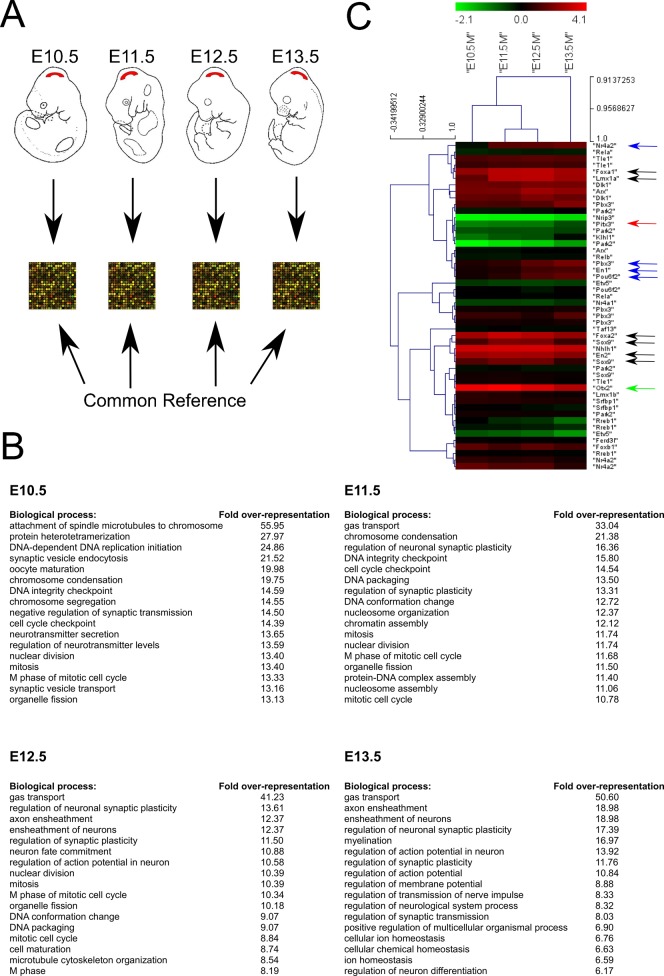
In order to identify novel genes and their expression patterns during mdDA neuron development, we performed an in vivo expression analysis of the developing ventral mesodiencephalon at four successive time points (E10.5-E13.5). To obtain proper biological and technical replicates, RNA extracted from three micro-dissected embryonic brains was pooled at each of the time points thereby minimizing complications caused by embryo-to-embryo variations in gene expression levels (Peng et al., 2003). Three independent RNA samples from each time point were used for probe labeling and hybridization. RNA pooled from three dissected adult mouse ventral mesodiencephalons was used as a common reference for all developmental stages allowing inter-time point comparisons. To circumvent a gene-specific-dye bias, dual channel microarrays were carried out by dye-swap replicates (Fig. 1A).
Fig. 1. Gene expression profiling during early mesodiencephalic development in the mouse.
(A) Schematic representation of the microarray setup aiming to identify transcripts during the early development of the mesodiencephalon (for details, see Material and Methods). (B) Overrepresentation of gene ontology (GO) terms enriched in the analyzed area across different developmental timepoints. (C) Heat-map of known essential mdDA transcription factors, represented through clustering (HCL).
Functional interpretation of up- and downregulated genes was determined by gene ontology (GO) analysis defining the dominant biological processes occurring in the time frame used for micro-array analysis (Fig. 1B). The highest over-representation scores were clearly changing over time. Genes found regulated at early time points appeared to be more involved in generating the neuronal precursor area while genes found highly expressed at E12.5 or later had roles in neuronal maturation and terminal differentiation.
In order to gain more insight in the transcriptional profile of transcription factors involved in mdDA development, we first selected mdDA expressed genes as identified through public databases (Allen Brain Atlas/GenePaint) and from our own other published work or that of others (results not shown). From this dataset all the transcription factors were selected. The resulting gene list with corresponding expression levels, as compared to the common reference, were clustered (HCL clustering, Mev4) (Fig. 1C). The data indicated that some genes, like Lmx1a, FoxA1/2, Sox9, Arx and En2, are at their peak level at E11.5 and E12.5 (Fig. 1C, black arrows), suggesting a clear role in early neuronal differentiation.
Other transcription factors showed a gradual upregulation in time, with highest levels at the latest time point, as was apparent for Nr4a2 (Nurr1), Pbx3, En1, and Pou6f2 (Fig. 1C, blue arrows). Genes known to be essential in late differentiation, such as Pitx3, showed relatively low expression compared to the common reference, which gradually increased in time (E13.5) (Fig. 1C, red arrow). Interestingly, the strong expression of Otx2, which decreased in time (Fig. 1C, green arrow), corresponded nicely with the time-dependent expression-area restriction reported for Otx2 leading to an almost unique expression in the VTA in the adult stage (Di Salvio et al., 2010).
Oc2, Oc3 and Chrna6 are identified in early and late mdDA development, respectively
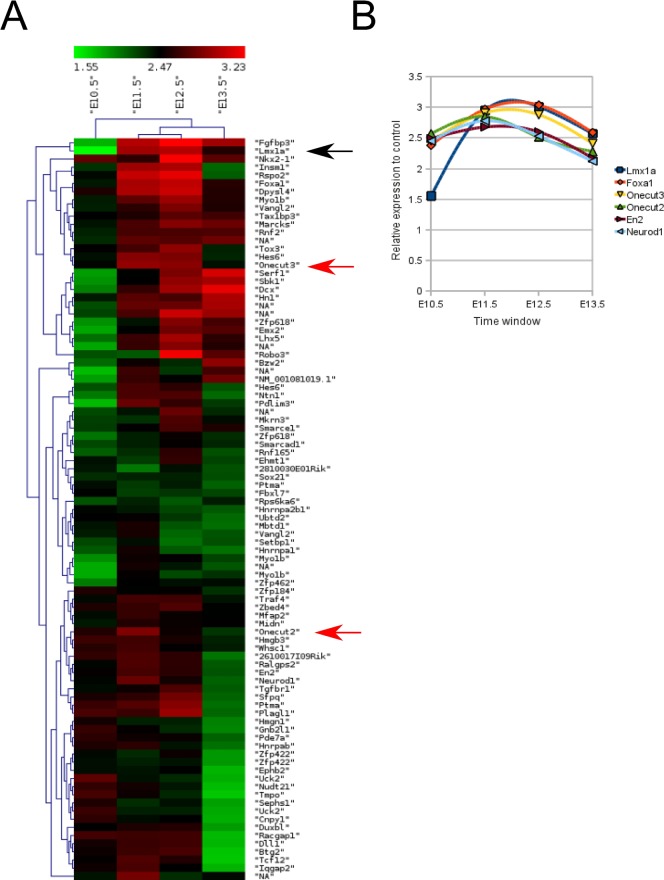
In order to identify novel transcription factors that may be involved in the early steps of mdDA specification and differentiation, we clustered the array dataset and located the cluster where Lmx1a was expressed, using it as an early mdDA differentiation marker (Fig. 2A, black arrow). After close examination of this cluster we noticed that two members of the Onecut family of transcription factors (Oc2 and 3) (Fig. 2A, red arrows) were mapping within this cluster. Closer examination of the exact expression profiles of Oc2 and Oc3 in time compared to Lmx1a, Foxa1, En2 and Neurod1 (Fig. 2B), showed that these transcription factors displayed a very similar expression profile from E10.5 to E13.5, suggestive of a function during similar developmental processes.
Fig. 2. Temporal map of genes clustering with the expression profile of Lmx1a.
(A) Heat-map visualization obtained by HCL of genes clustering with Lmx1a (black arrow) in order to identify transcription factors or transcriptional targets that may play an important role in mdDA specification and differentiation. Within this cluster we identified novel transcription factor family members expressed within this region, Onecut2 and Onecut3 (red arrows). (B) The exact expression level over the E10.5-E13.5 window is plotted for Lmx1a, FoxA1, Oncut3, Onecut2, En2 and Neurod1, all present in the heat map presented in (A).
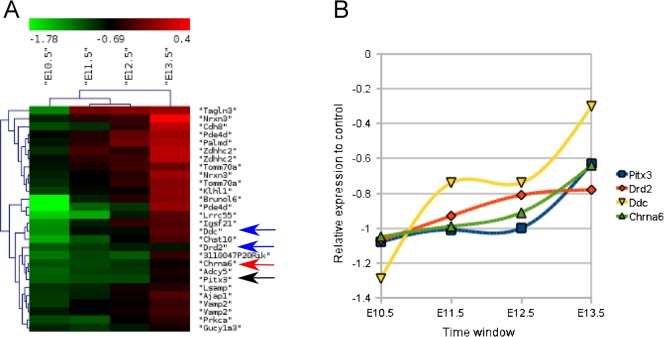
In a similar approach, we isolated a cluster containing the essential transcription factor Pitx3 (Fig. 3A, black arrow), acting in the phase of terminal differentiation (Smidt et al., 1997; Smidt et al., 2004). Pitx3 clustered together with its known targets as Aadc and Drd2 (Fig. 3A, blue arrows). In addition, close to the position of Pitx3 in the cluster, we identified the cholinergic receptor subunit Chrna6 (Fig. 3A, red arrow). Interestingly, from public databases (Allen Brain Atlas) it was clear that similar to Pitx3 the expression of Chrna6 is restricted to the mdDA neuronal population, suggesting that Pitx3 may have a role in the regulation of the Chrna6 gene. Closer examination of the profile (Fig. 3B) suggested that the Chrna6 gene is expressed in almost the exact temporal manner as Pitx3, confirming the possible transcriptional relationship.
Fig. 3. Temporal map of genes clustering with the expression profile of Pitx3.
(A) Heat-map visualization obtained by HCL of genes clustering with Pitx3 (black arrow) in order to identify other genes that may play an important role in the late mdDA differentiation phase (Ddc, Drd2; blue arrows) and in mature mdDA neuronal function. Within this cluster we identified a known cholinergic receptor subunit, Chrna6 (red arrow). (B) The exact expression level over the E10.5-E13.5 window was plotted for Pitx3, Drd2, Ddc and Chrna6, all present in the heat map presented in (A).
In order to further understand the relationship of Oc2/3 towards early mdDA development and Chrna6 in terminal differentiation, possible regulated by Pitx3, these genes were studied in more detail.
The Oc family is expressed in the developing mesodiencephalon
To examine the role of the Oc family in mdDA development, we performed in situ hybridization experiments on E11.5-E13.5 coronal brain sections of the mesodiencephalon (Fig. 4). As a reference to indicate the position where mdDA neurons are born and developing, Th gene expression was analyzed on adjacent sections to the Oc1/2/3 series. At E11.5, all Oc members were restricted to the ventral wall of the mesodiencephalon. The spatial overlap with Th expression was highest, at this stage, for Oc3. However the overlap was mostly restricted to the lateral areas, especially in the case of Oc1 and Oc2. At E12.5 the expression of Oc1 in the region was diminished, whereas the expression of Oc2 and Oc3 was expanded to the floorplate area, creating an almost 100 percent spatial overlap with mdDA neurons at the ventral side. At E13.5, expression of Oc1 and Oc2 had almost disappeared, whereas Oc3 was still highly expressed throughout the entire region showing overlapping with the mdDA neuronal domain. We performed micro array experiments on sorted mdDA neurons (from Pitx3-Gfp/+ material) (Jacobs et al., 2009b) and these data indicate that the Oc1-3 family members are expressed within mdDA neurons at E12.5 (data not shown). The observed spatiotemporal expression pattern suggested that during the early phases of mdDA neuronal development cells are mainly exposed to Oc1 signaling in the ventral/lateral domains, which is most prominent at E12.5. At later stages, Oc3 might be involved in late differentiation events of mdDA neurons.
Fig. 4. Expression analysis of Onecut transcription factors during mdDA neuron development.
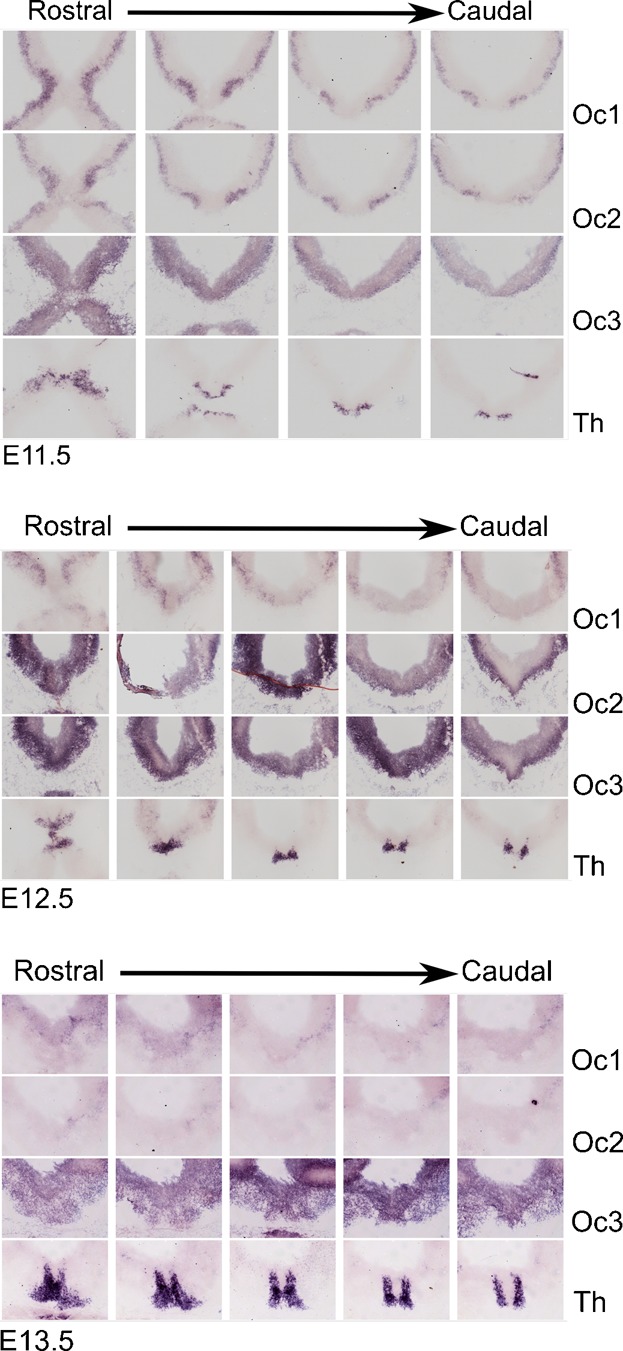
Adjacent coronal sections of E11.5, E12.5 and E13.5 mouse brains were hybridized with Onecut (Oc)1 (upper panel), Oc2 (medial panel) and Oc3 (lower panel) RNA probes. The region shown starts rostrally at the diencephalon and ends caudally at the midbrain. To identify the region, Th in situ hybridization was performed on adjacent sections.
Oc family members are involved in the proper development of mdDA neurons
In order to elucidate the influence of Oc transcription factors during the development of mdDA neurons, we studied Oc1 and Oc1/2 knockout mice (Fig. 5), the latter regarded as an Oc1/2/3 triple knockout (Espana and Clotman, 2012). In this experiment, we used E12.5 embryos of either genotype and compared them to wild-type (WT) littermates. Th-protein expression was used as a marker for the mdDA neuronal population. In sagittal sections through the medial part of the mdDA neuronal pool, we noticed that the number of Th-positive neurons present at the caudal limit of the system was diminished in both Oc1 and Oc1/2 double knockout mice as compared to WT (Fig. 5A,B, arrows). In addition, the Th-positive region was remarkably flattened in the absence of Oc proteins, especially in Oc1/2(/3) knockout mice (Fig. 5B). In a similar experiment using coronal sections of the same age, we also noticed a flattening of the Th-positive field in the medial/caudal area of the mesencephalon and a lateral expansion of Th expression (Fig. 5C, arrows). These data suggest that a specific part of the mdDA neuronal area is under the influence of Oc family members during development. Moreover, the additional removal of Oc2, over Oc1, increased the defect found in the Oc1 knockout mouse. This suggests that Oc1 and Oc2 (and Oc3) play non-redundant roles in similar cellular processes during mdDA development.
Fig. 5. Onecut transcription factors are important for the correct generation of the mdDA neuronal population.
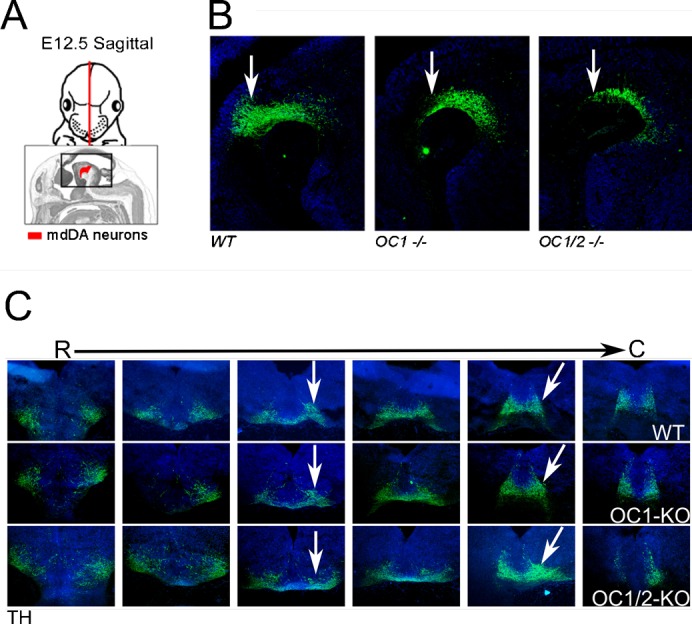
(A) Schematic representation of the region analyzed for Th immunohistochemistry as shown in (B). (B) Sagittal sections showing the organization of the mdDA neuronal population through the presence of Th protein. The arrow indicates a region where a severe flattening of the neuronal population is present in the Oc1−/− and Oc1/2−/− mice. (C) Coronal sections from rostral (R) to caudal (C) encompassing the mdDA neuronal population as shown by Th protein expression. The flattening of the mdDA neuronal pool as observed in the sagittal sections (B) is confirmed in these sections as indicated by arrows.
mdDA neurons contain cholinergic receptors build by Chrna4, Chrna6, Chrnb2, and Chrnb3 subunits
The Chrna6 subunit displayed a similar temporal expression pattern as was found for Pitx3 (Fig. 3). Interestingly, in the mouse genome (mouse chromosome 8) the Chrna6 gene is paired with the Chrnb3 gene in a tail-to-tail orientation on opposite strands (Fig. 6A). This led us to investigate the exact expression patterns of both subunits in mdDA neurons (Fig. 6B). In an in situ hybridization experiment using sagittal sections of E12.5 WT mouse brains, we found Chrna6 and Chrnb3 expression in the exact same location in the mesencephalon, restricted to the region covered by expression of Th. Interestingly, the expression was not evenly distributed over all mdDA neurons. Especially Chrnb3 was more expressed in the rostral/lateral mdDA area as compared to medial/caudal regions. This suggests that the gene regulation of Chrna6 and Chrnb3 is not equal despite their proximity in the mouse genome. Moreover, the data indicate that specific subsets of mdDA neurons exist that have different types of cholinergic receptors. In order to confirm that these subunits are expressed within mdDA neurons, we performed a double in situ hybridization/immunohistochemistry experiment (Fig. 6C). From this experiment it is clear that mdDA neurons express Chrna6 and Chrnb3. Subset specific levels are emphasized by the low abundance of Chrnb3 in the medial/caudal area. To investigate whether this initial subset specific expression of Chrnb3 leads to the same distribution in the adult mdDA area, we performed in situ hybridization on adult coronal brain sections (Fig. 7). Indeed, in the adult the expression of Chrnb3 was limited to subsets of neurons in the SNc area (rostral) and a very small group in the most caudal/lateral area of the VTA.
Fig. 6. The cholinergic receptor subunits a6 (Chrna6) and b3 (Chrnb3) are (subset) specifically expressed in mdDA neurons during development.
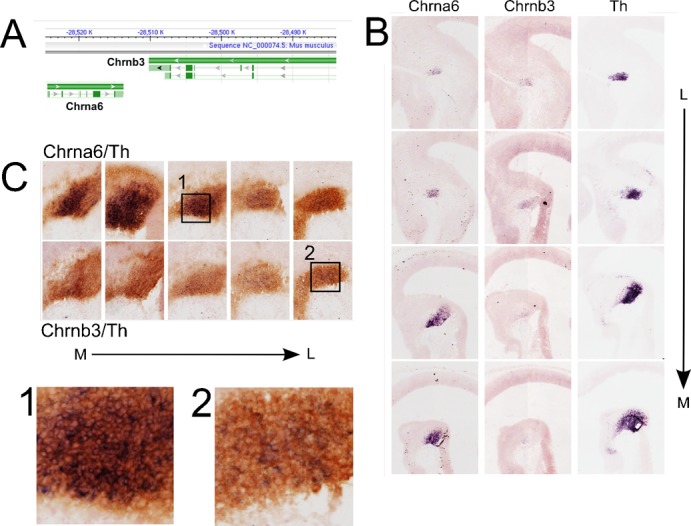
(A) The Chrna6 and Chrnb3 genes are organized as a tandem in the mouse genome (chromosome 8) in a tail to tail orientation. (B) In situ hybridization (ISH) experiments for Chrna6, Chrnb3 and Th (position control) on sagittal sections of E13.5 mouse brain. The expression patterns of Chrna6 and Chrnb3 are restricted to the mdDA neuronal region and appear to be restricted to a subset of mdDA neurons. (C) Combined ISH (purple) and immunohistochemistry (brown) experiment using Chrna6 and Chrnb3 probes with Th antibodies confirm the co-localization and restriction to the mdDA neuronal pool of the Chrna6 and Chrnb3 transcripts. L, lateral; M, medial.
Fig. 7. The cholinergic receptor subunit b3 (Chrnb3) is limited to the rostral part of the SNc and to the most caudal/lateral area of the ventral tegmental area (VTA) at the adult stage.
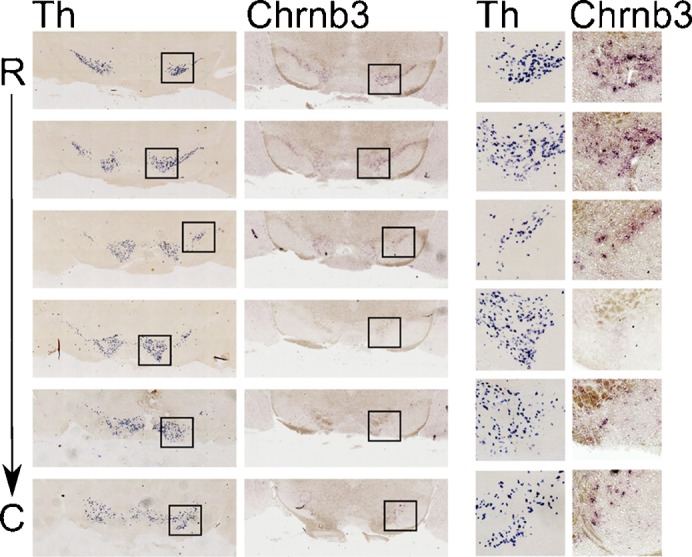
In situ hybridization for Th and Chrnb3 on coronal sections (adjacent, 30 µm apart) covering the mdDA neuronal region at the adult stage. Squared regions are shown in detail on the right. C, caudal; R, rostral.
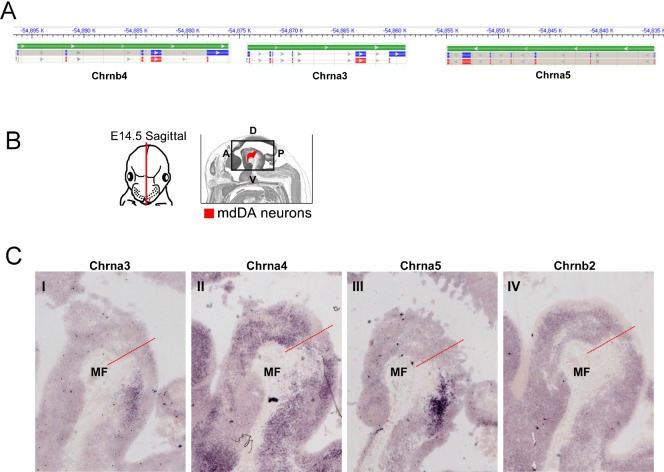
The composition of the pentamer cholinergic receptors is not exactly known in mdDA neurons. To solve this issue, we searched the initial microarray dataset and found most Chrn-subunits to be expressed in the mdDA region (data not shown). Interestingly, some of these subunits (Chrnb4, Chrna3 and Chrna5) were clustered together in the genome (mouse chromosome 9) (Fig. 8A), as was found for Chrna6 and Chrnb3. In situ hybridization for Chrna3, Chrna4, Chrna5 and Chrnb2 on sagittal mouse brain section of E14.5 showed that of the Chrn subunits detected Chrna4 and Chrnb2 are expressed in the mdDA region, although not restricted to mdDA neurons, as was observed for Chrna6 and Chrnb3 (Fig. 8B,C). This suggests that mdDA neurons can form pentamer cholinergic receptors with Chrna6, Chrnb3, Chrna4 and Chrnb2 as building blocks, where the Chrnb3 subunit is restricted to the lateral/rostral group of mdDA neurons. Since the process of nAChR assembly is tightly regulated requiring subunit-subunit interactions (Millar and Harkness, 2008) it is tempting to speculate that cholinergic receptor pentamers in the mdDA system are primarily composed of a combination of α6β, α4αβ, α6ββ and α4αββ subunits.
Fig. 8. Expression of other genomic-clustered Chrn subunits in the mesodiencephalon.
(A) Schematic representation illustrating the assembly of the Chrnb4, Chrna3 and Chrna5 genes on mouse chromosome 9. (B) Schematic representation of the sagittal plane of the in situ hybridization experiments as shown in (C). The position of mdDA neurons is indicated in red. (C) In addition to Chrna6 and Chrnb3 (Fig. 6) the cholinergic receptor subunits Chrna4 and Chrnb2 are expressed within the mdDA region. A, anterior; D, dorsal; P, posterior; V, ventral.
The cholinergic receptor Chrna6 subunit is not required for normal mdDA neuronal development
Adult Chrna6 knockout mice do not exhibit any gross neurological or behavioral deficits as was described previously (Champtiaux et al., 2002). Since the Chrna6 subunit is expressed at high levels during mdDA neuronal development, we analyzed the effect of Chrna6 ablation in developing mdDA neurons. To this end, we first performed in situ hybridization for Th and Ahd2 in Chrna6 knockout mice and WT littermates at E14.5. The latter probe (Ahd2) selectively marks the most lateral/rostral mdDA subset (Jacobs et al., 2007). The expression level and distribution of Th mRNA was unaltered in Chrna6 knockout embryos (Fig. 9A). Similarly, the level and distribution Ahd2 expression was not altered. Additional analyzes of Th protein in the adult mouse brain did not reveal any clear abnormalities in the mdDA neuronal field or axonal projections (Fig. 9B,C). Taken together, Chrna6 knockout mice do not display clear abnormalities in the mdDA neuronal field at E14.5 and in the adult. This suggests that changes in the subunit composition of cholinergic receptors may not have dramatic influences on mdDA development.
Fig. 9. Loss of the cholinergic receptor subunit Chrna6 does not alter the development and organization of the mdDA system.
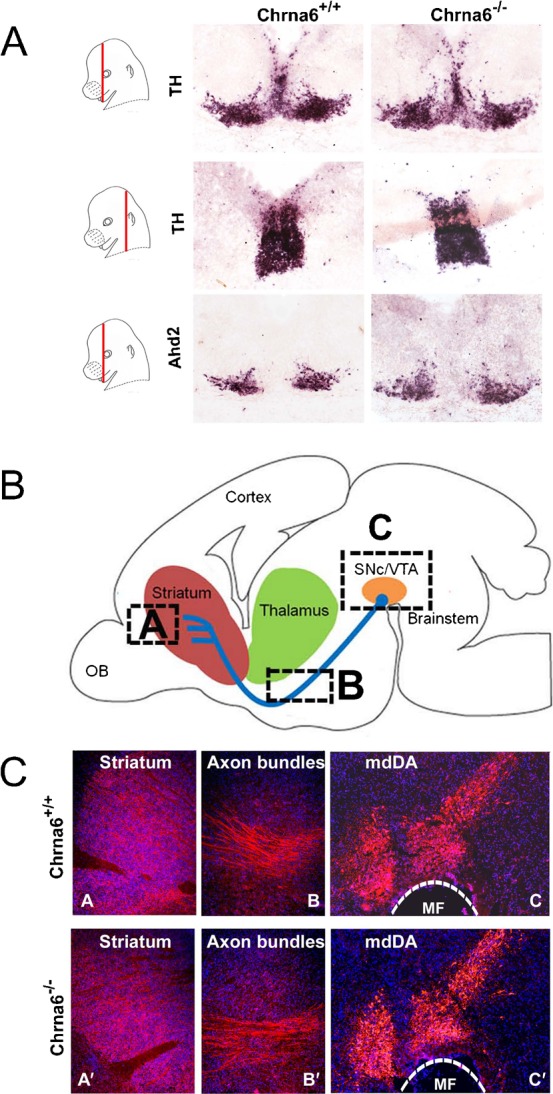
(A) In situ hybridization experiments with the mdDA neuronal marker Th and the rostral mdDA subset marker Ahd2 in wild type and Chrna6−/− mice. The expression pattern indicated that during development there is no clear alteration in the morphology or number of mdDA neurons. (B) Schematic representation of the position of mdDA neurons and their projections in the adult brain (sagittal plane). The boxes A, B and C depict the areas shown in (C). Immunohistochemistry for Th in adult sagittal section in Chrna6+/+ and Chrna6−/− animals. In accordance to the absence of an early defect (A), the adult system does not seem to be affected in terms of neuronal field (mdDA, panels C), formation of the medial forebrain bundle (Axon bundles, panels B) and the target innervation in the striatum (Striatum, panels A). MF, mesencephalic flexure.
Chrna6 and Chrnb3 expression depends on Pitx3 and Nurr1 activity
The fact that the temporal expression profile of Chrna6 mimics that of Pitx3 together with the close association of Chrna6 and Chrnb3 on the genome (Fig. 6) suggests that both genes may be regulated through a common mechanism and that Pitx3 may play a role in this regulation. In order to solve this question, we performed in situ hybridization experiments for Chrna6 and Chrnb3 on Pitx3 mutant mice and their WT littermates (Fig. 10). In adjacent sagittal sections of E14.5 WT embryos matched to Th expression, we confirmed the expression patterns that were described earlier (Fig. 6). In contrast, in the Pitx3 mutant the expression of both Chrna6 and Chrnb3 was diminished with only low levels of Chrna6 remaining. These data suggest that both cholinergic receptor subunits rely on Pitx3 activity.
Fig. 10. Expression of the cholinergic receptor subunits Chrna6 and Chrnb3 depends on Pitx3.
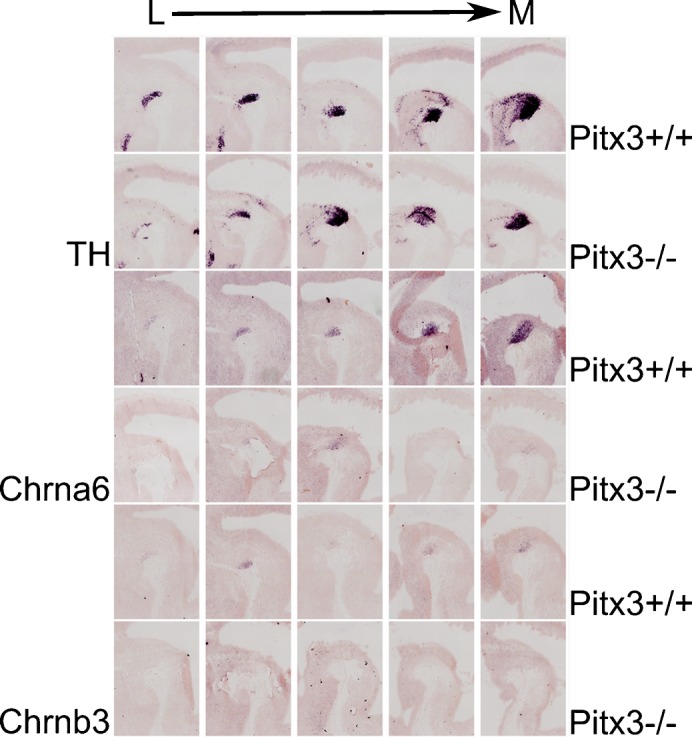
In situ hybridization for Th, Chrna6 and Chrnb3 on sagittal sections of Pitx3+/+ and Pitx3−/− mice. The expression of Chrna6 is prominently downregulated in a medial subset of mdDA neurons as a consequence of Pitx3 ablation, whereas the transcript of Chrnb3 could not be detected in any mdDA neurons in Pitx3−/− mice. L, lateral; M, medial.
We have shown earlier that Nurr1 and Pitx3 act in concert in the activation of many Pitx3/Nurr1 target genes (Jacobs et al., 2009b). Since Chrna6 and Chrnb3 rely on Pitx3 activity we also investigated the role of Nurr1 in this mechanism. Analysis of E14.5 Nurr1 knockout embryos against WT littermates showed that ablation of Nurr1 led to a direct loss of both cholinergic receptor subunits (supplementary material Fig. S1) in the mdDA neuronal field (supplementary material Fig. S1). This was not due to cell loss at this stage, since En1 was still present in adjacent sections (supplementary material Fig. S1).
Pitx3 and Nurr1 control Chrna6 and Chrnb3 gene expression via alternative molecular mechanisms
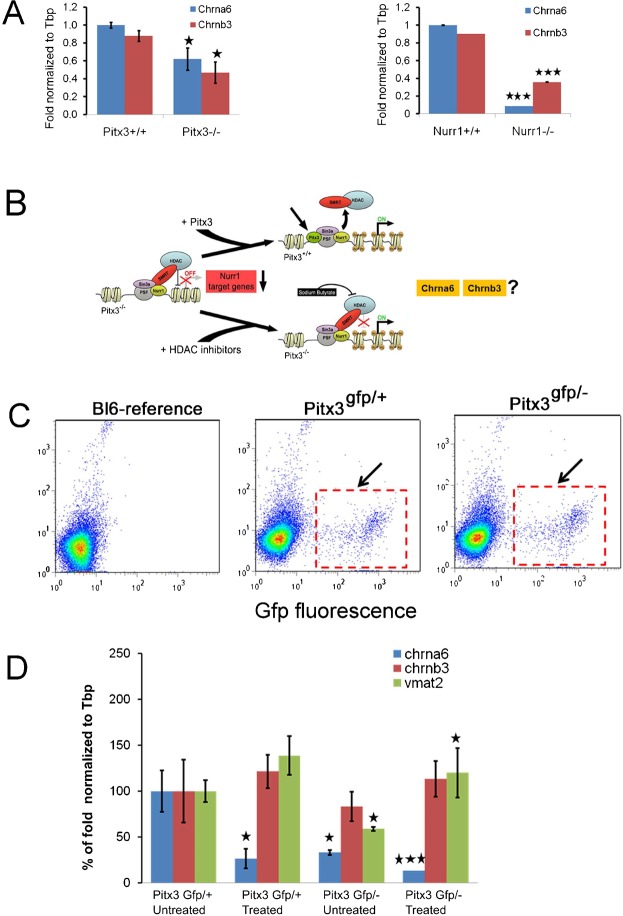
To further substantiate our findings and determine the quantitative loss of Chrna6 and Chrnb3 transcripts in Pitx3 and Nurr1 null mutants, we performed qPCR on E14.5 VM from Pitx3 and Nurr1 null embryos and their respective littermate controls (Fig. 11A). Tbp was taken as a housekeeping control gene and the relative expression of Chrna6 and Chrnb3 was normalized to Tbp. The qPCR data showed a significant loss of Chrna6 and Chrnb3 transcripts (P<0.01 and P<0.04 respectively) in Pitx3−/− animals compared to control (Fig. 11A), in agreement with our in situ hybridization data (Fig. 10). In Nurr1−/− animals the observed the loss of Chrna6 transcript was even more dramatic compared to Pitx3−/− mutants. The relative transcript level of Chrna6 was reduced by 90% (P<0.001) in Nurr1−/− mutants compared to controls. The relative transcript level of Chrnb3 was reduced by about 65% (P<0.001) in Nurr1−/− animals (Fig. 11A) compared to littermate control.
Fig. 11. Chrna6 and Chrnb3 expression depends Pitx3 and Nurr1 but through a different mechanism reported for Vmat2.
(A) QPCR analysis of Chrna6 and Chrnb3 in Pitx3 (sorted mdDA neurons) and Nurr1 mutants compared to heterozygotes and wildtypes, respectively. In both mutants, the level of Chrna6 and Chrnb3 transcript is significantly downregulated. (B) Putative role of SMRT/HDAC-mediated repression of Nurr1 transcriptional activity modulated by Pitx3 in Chrna6 and Chrnb3 gene regulation. (C) FACS sorting data of E14.5 Pitx3-Gfp/+ and Pitx3-Gfp/− mice midbrain dissections. The arrow points to the Gfp positive cells that are sorted and used for mRNA isolation and subsequent QPCR analysis. The FACS sorting gate was set using an E14.5 C57Bl6-Jico (Bl6) reference sample to select GFP-positive mdDA neurons from either genotype. (D) QPCR analysis (n = 3) on sorted cells of sodium butyrate treated Pitx3-Gfp/− and Pitx3-Gfp/+ mice suggests that HDAC inhibition does not significantly rescue Chrna6 and Chrnb3 expression, as was shown for Vmat2. * P<0.05; *** P<0.01.
We previously proposed a molecular model of the combinatorial action of Nurr1 and Pitx3, where the full activation of Nurr1 target genes depends on the release of the SMRT/HDAC-mediated repression of the Nurr1 transcriptional complex through the regulatory action of Pitx3 (Jacobs et al., 2009a; Jacobs et al., 2009b). We asked if the expression of the identified Pitx3 and Nurr1 target genes Chrna6 and Chrnb3 also depends on SMRT/HDAC-mediated repression mechanism (Fig. 11B). Neurons from the mdDA system were isolated for expression analysis by FACS sorting (Fig. 11C) following previously described procedures (Jacobs et al., 2009b). VM regions of Pitx3gfp/+ and Pitx3gfp/− embryos were dissected at E13.5. To interfere with HDAC activity, we treated the explants cultures with the HDAC inhibitor sodium butyrate for 2 days, after which Gfp-positive mdDA neurons were isolated through FACS. Equal amounts of RNA, estimated through FACS cell counts, from Gfp-positive mdDA neurons were subjected to qPCR to determine the relative transcript levels of Chrna6, Chrnb3, and Vmat2 (Fig. 11D). The relative expression in untreated heterozygous Pitx3gfp/+ mdDA neurons was set to ‘100%’ after normalization to Tbp. In order to ensure that we performed the experiment as described before we added the control gene Vmat2 which was already described to be activated in Pitx3 mutants after HDAC inhibitor treatment. In concordance with our previous data the Vmat2 gene was significantly activated after sodium butyrate treatment of Pitx3gfp/− explants. Surprisingly, in the treated control (Pitx3gfp/+) the level of Chrna6 was significantly lower (30% of untreated) indicating that the release of HDACs on this promoter leads to repression of the Chrna6 gene. This effect was also observed in the treated Pitx3gfp/− cultures were the already low level of Chrna6 was significantly decreased after treatment. Interestingly, an opposite effect was observed for Chrnb3, in both Pitx3gfp/+ and Pitx3gfp/− cultures the Chrnb3 gene was activated after HDAC inhibition (Fig. 11D).
Discussion
Spatiotemporal gene expression profiling of the developing ventral mesodiencephalon
In order to further our understanding of mdDA development we carried out a genome-wide gene-expression analysis of microdissected mouse tissue from the ventral mesodiencephalic region at early stages of mdDA development (E10.5-E13.5). Our strategy allowed us to obtain sufficient tissue for microarray analysis without RNA amplification, circumventing problems concerning selective amplification and inter-sample variance. Functional analysis of the dataset through GO-analysis showed that neuronal differentiation was dominantly overrepresented at E12.5, whereas at later stages neuronal maturation and terminal differentiation were the main processes. Close examination of the temporal expression profiles of known transcription factors in our dataset indicated that the expression of some of these factors was highest at the onset of mdDA neuronal development, e.g. Lmx1a and FoxA1/2. This profile confirms the known functions of these genes. Genes like Nurr1 and En1 were identified with increasing relative temporal expression, hinting increasingly critical roles during mdDA development, as is known from transgenic ablation models where both genes are identified as critical for mdDA development (Jacobs et al., 2009a; Alves dos Santos and Smidt, 2011). In this study, cluster analysis and selection through known essential transcription factors involved in early (Lmx1a) and late (Pitx3) developmental processes of mdDA development identified novel transcription factors (Oc family) and new transcriptional targets of the critical terminal differentiation gene Pitx3 (Chrna6 and Chrnb3) in mdDA development.
Oc family members are involved in the formation of the mdDA neuronal region
Until now the involvement of Oc1, Oc2 and Oc3 in dopaminergic development had not been described. The fact that the Oc expression profile matched that of Lmx1a suggested a role during early mdDA neuron development as has been reported for Lmx1a. Analysis of Oc1 and Oc1/Oc2 double knockout mice indicated that the formation of the mdDA neuronal field is influenced by these Oc family members. Especially at the caudal border of the midbrain a flattening of the Th expressing region, as shown in sagittal and coronal views on the system, was observed indicating the relative importance of Oc1 and Oc2 at this position. Interestingly the phenotype increased with the additional deletion of Oc2, suggesting that Oc family members act in similar molecular pathways. Importantly, the phenotype does not directly represent the presence of the Oc family members as shown in Fig. 4. The lateral position seems to express all Oc members and still the medial domain seems most affected. This suggests a selective molecular mechanism that directs the vulnerability of the system towards the medial/caudal domain. This supports the notion that molecular subsets exist within the mdDA neuronal pool (Smits et al., 2006; Smidt and Burbach, 2007). The interplay of Oc family members is currently unknown as is the role these factors might play in other areas of the developing brain. In the developmental retina, Oc1 and Oc2 factors are found in proliferating progenitors as well as in postmitotic retinal cells (Wu et al., 2012), indicating a role for these transcription factors in pre-and postmitotic cells. The exact mechanism of action and the interplay with other critical mdDA developmental factors remains to be elucidated for the Oc family, despite their important role in mdDA development.
The cholinergic receptor subunits Chrna6 and Chrnb3 are under the control of the combinatorial action of Nurr1 and Pitx3
The appearance of the cholinergic receptor subunit Chrna6 within the expression profile of Pitx3, and the close genomic association of Chrna6 and Chrnb3 led to the close investigation of these receptor subunits in mdDA neurons. Spatiotemporal expression analysis revealed that these subunits are uniquely expressed in (subsets) of mdDA neurons detectable at E13.5. The selective expression in time and place triggered the hypothesis that Pitx3 and/or Nurr1 might be involved in regulating the expression of these subunits in mdDA neurons. Analysis of the respective genetic ablation models indicated that, indeed Chrna6 and Chrnb3 depend on the activity of both Nurr1 and Pitx3. These close transcriptional connections between Nurr1/Pitx3 and Chrna6/Chrnb3 have consequences for the role Nurr1/Pitx3 activity might have on the behavioral output of the mdDA system, since it has been described that small differences in Chrna6 and Chrnb3 function influences alcohol consumption (Hoft et al., 2009).
Since a molecular mechanism of Pitx3 action in concert with Nurr1 has been proposed (Jacobs et al., 2009a) we aimed to elucidate whether these cholinergic subunits are regulated through release of the HDAC mediated repression of Nurr1. In an ex vivo culture experiment using sodium butyrate as a general HDAC inhibitor we were able to confirm the regulation of the well-described Nurr1/Pitx3 target Vmat2 (Jacobs et al., 2009a). However, Chrnb6 behaved in the exact opposite direction. HDAC inhibition suppressed the expression of Chrna6 in both WT and Pitx3 mutant conditions. Interestingly, Chrnb3 did respond in the same manner as Vmat2, although the effect size was too small to generate a statistical significant result within this experimental setup (N = 3). These data suggest that the close association of these genes on mouse chromosome 8 does not lead to a similar program of gene activation, emphasized by the difference in molecular regulation as well as expression differences in mdDA subset specificity.
The function of Chrna6 is not essential for the development of mdDA neurons, since ablation of the gene did not lead to any clear abnormalities in these neurons. Moreover, it was already known from initial mouse knockout studies that ablation of Chrna6 does not lead to gross abnormalities or behavioral defects (Champtiaux et al., 2002). The changes as a consequence of Chrna6 ablation are merely in the fine-tuning of the dopaminergic response to nicotine signaling (Champtiaux et al., 2003; Drenan et al., 2008). Our results indicate that these subtle but essential roles are indirectly controlled by Pitx3 and Nurr1.
Neuronal nAChRs are composed of α- or β-subunits and exist as heteropentamers composed of combinations of α- and β-subunits in different ratios or as homopentamers of α- and β-subunits and thereby influence DA transmission as a consequence of nicotine signaling (Gotti et al., 2006; Klink et al., 2001; Azam et al., 2007). The presence of Chrnb3 and Chrna6 specifically in mdDA neurons together with the more broadly expressed subunits Chrna4 and Chrnb2, suggests that mdDA neurons can form pentamer cholinergic receptors with Chrna6, Chrnb3, Chrna4 and Chrnb2 as building blocks, where the Chrnb3 subunit is restricted mainly to the lateral/rostral group of mdDA neurons. Since the process of nAChR assembly is tightly regulated requiring subunit-subunit interaction (Millar and Harkness, 2008) it is interesting to speculate the possible subunit assembly giving rise to pentamers primarily constitute of α6β, α4αβ, α6ββ and α4α β2β in developing mdDA neurons.
Interestingly, Chrnb3 containing pentamers will be primarily restricted to SNc neurons. This will provide the SNc and the most caudal/lateral part of the VTA with a different response profile to nicotine compared to other mdDA neurons (Keath et al., 2007) as has also been suggested for differences in contributions of Chrna4-, Chrnb3- and Chrna6-containing subtypes to the reinforcing effects of Nicotine (Exley et al., 2011; Thorgeirsson et al., 2010).
Taken together, our studies into the transcriptional profile of the mesodiencephalic area has uncovered novel transcription factors of the Oc family involved in the formation of the mdDA neuronal population and have added two new members to the growing list of Pitx3/Nurr1 targets generating new knowledge on the full mdDA transcriptional profile (Fig. 12).
Fig. 12. Overview of the molecular program essential to build mdDA neurons.
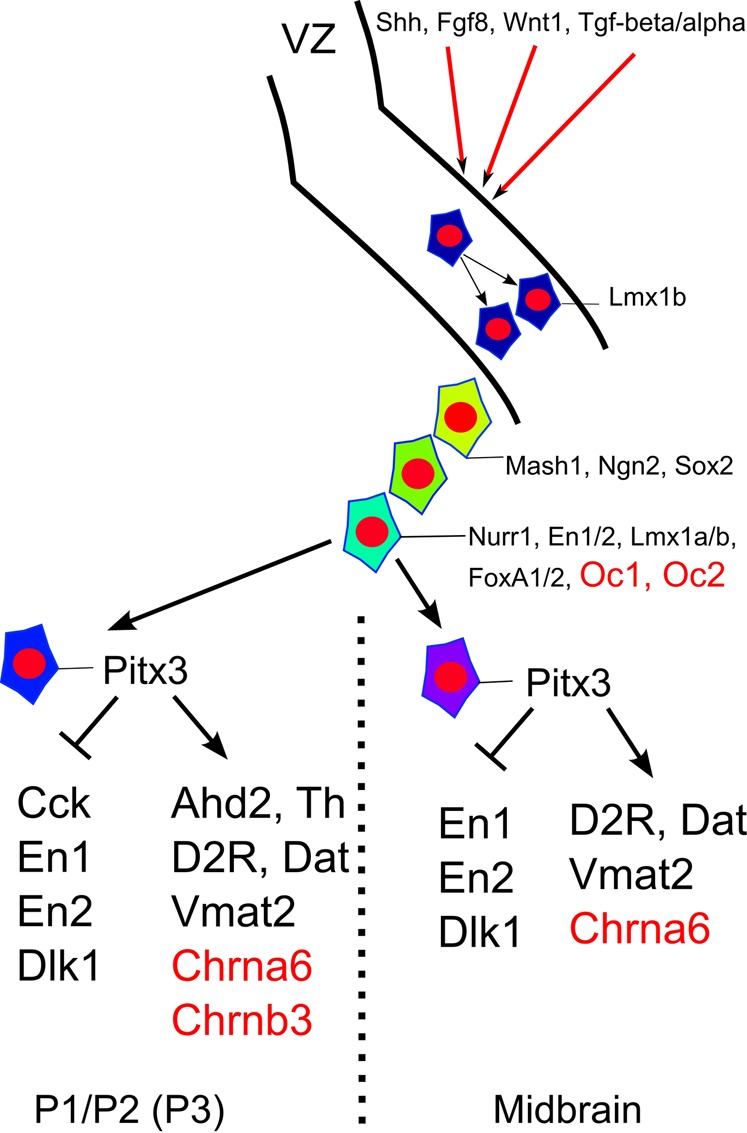
The genes identified in this study (in red) have been added to the programming details of mdDA neurons. Depending on time and position in the developing mesodiencephalon these genes act in early phases (Oc family) or terminal differentiation (Chrna6, Chrnb3) of mdDA neurons.
Supplementary Material
Acknowledgments
We thank Uwe Maskos and Jean-Pierre Changeux for the Chrna6 knock-out mice, Ger Arkenstein for assistance with FACS sorting. This work was supported by TI Pharma grant to M.P.S and R.J.P, by a VICI-grant (no. 865.09.002) to M.P.S., EU/FP7 funding to the mdDAneurodev consortium (222999), coordinated by M.P.S., the Netherlands Organization for Health Research and Development (ZonMW-VIDI and ZonMW-TOP), the Human Frontier Science Program (HFSP-CDA) to R.J.P. Please note that a change to the list of authors occurred during the publishing process.
Footnotes
Competing interests: The authors declare that there are no competing interests.
References
- Alves dos Santos M. T., Smidt M. P. (2011). En1 and Wnt signaling in midbrain dopaminergic neuronal development. Neural Dev. 6, 23 10.1186/1749-8104-6-23 [DOI] [PMC free article] [PubMed] [Google Scholar]
- Azam L., Chen Y., Leslie F. M. (2007). Developmental regulation of nicotinic acetylcholine receptors within midbrain dopamine neurons. Neuroscience 144, 1347–1360 10.1016/j.neuroscience.2006.11.011 [DOI] [PMC free article] [PubMed] [Google Scholar]
- Barzilai A., Melamed E. (2003). Molecular mechanisms of selective dopaminergic neuronal death in Parkinson’s disease. Trends Mol. Med. 9, 126–132 10.1016/S1471-4914(03)00020-0 [DOI] [PubMed] [Google Scholar]
- Berke J. D., Hyman S. E. (2000). Addiction, dopamine, and the molecular mechanisms of memory. Neuron 25, 515–532 10.1016/S0896-6273(00)81056-9 [DOI] [PubMed] [Google Scholar]
- Champtiaux N., Han Z. Y., Bessis A., Rossi F. M., Zoli M., Marubio L., McIntosh J. M., Changeux J. P. (2002). Distribution and pharmacology of alpha 6-containing nicotinic acetylcholine receptors analyzed with mutant mice. J. Neurosci. 22, 1208–1217. [DOI] [PMC free article] [PubMed] [Google Scholar]
- Champtiaux N., Gotti C., Cordero-Erausquin M., David D. J., Przybylski C., Léna C., Clementi F., Moretti M., Rossi F. M., Le Novère N. et al. (2003). Subunit composition of functional nicotinic receptors in dopaminergic neurons investigated with knock-out mice. J. Neurosci. 23, 7820–7829. [DOI] [PMC free article] [PubMed] [Google Scholar]
- Di Salvio M., Di Giovannantonio L. G., Acampora D., Prosperi R., Omodei D., Prakash N., Wurst W., Simeone A. (2010). Otx2 controls neuron subtype identity in ventral tegmental area and antagonizes vulnerability to MPTP. Nat. Neurosci. 13, 1481–1488 10.1038/nn.2661 [DOI] [PubMed] [Google Scholar]
- Drenan R. M., Grady S. R., Whiteaker P., McClure-Begley T., McKinney S., Miwa J. M., Bupp S., Heintz N., McIntosh J. M., Bencherif M. et al. (2008). In vivo activation of midbrain dopamine neurons via sensitized, high-affinity alpha 6 nicotinic acetylcholine receptors. Neuron 60, 123–136 10.1016/j.neuron.2008.09.009 [DOI] [PMC free article] [PubMed] [Google Scholar]
- Espana A., Clotman F. (2012). The Onecut transcription factors are required for the second phase of development of the A13 dopaminergic nucleus in the mouse. J. Comp. Neurol. 520, 1424–1441 10.1002/cne.22803 [DOI] [PubMed] [Google Scholar]
- Exley R., Maubourguet N., David V., Eddine R., Evrard A., Pons S., Marti F., Threlfell S., Cazala P., McIntosh J. M. et al. (2011). Distinct contributions of nicotinic acetylcholine receptor subunit α4 and subunit α6 to the reinforcing effects of nicotine. Proc. Natl. Acad. Sci. USA 108, 7577–7582 10.1073/pnas.1103000108 [DOI] [PMC free article] [PubMed] [Google Scholar]
- Fenstermaker A. G., Prasad A. A., Bechara A., Adolfs Y., Tissir F., Goffinet A., Zou Y., Pasterkamp R. J. (2010). Wnt/planar cell polarity signaling controls the anterior-posterior organization of monoaminergic axons in the brainstem. J. Neurosci. 30, 16053–16064 10.1523/JNEUROSCI.4508-10.2010 [DOI] [PMC free article] [PubMed] [Google Scholar]
- Freed C. R., Greene P. E., Breeze R. E., Tsai W. Y., DuMouchel W., Kao R., Dillon S., Winfield H., Culver S., Trojanowski J. Q. et al. (2001). Transplantation of embryonic dopamine neurons for severe Parkinson’s disease. N. Engl. J. Med. 344, 710–719 10.1056/NEJM200103083441002 [DOI] [PubMed] [Google Scholar]
- Gotti C., Zoli M., Clementi F. (2006). Brain nicotinic acetylcholine receptors: native subtypes and their relevance. Trends Pharmacol. Sci. 27, 482–491 10.1016/j.tips.2006.07.004 [DOI] [PubMed] [Google Scholar]
- Hamatani T., Carter M. G., Sharov A. A., Ko M. S. (2004). Dynamics of global gene expression changes during mouse preimplantation development. Dev. Cell 6, 117–131 10.1016/S1534-5807(03)00373-3 [DOI] [PubMed] [Google Scholar]
- Hoft N. R., Corley R. P., McQueen M. B., Huizinga D., Menard S., Ehringer M. A. (2009). SNPs in CHRNA6 and CHRNB3 are associated with alcohol consumption in a nationally representative sample. Genes Brain Behav. 8, 631–637 10.1111/j.1601-183X.2009.00495.x [DOI] [PMC free article] [PubMed] [Google Scholar]
- Jacobs F. M. J., Smits S. M., Noorlander C. W., von Oerthel L., van der Linden A. J. A., Burbach J. P. H., Smidt M. P. (2007). Retinoic acid counteracts developmental defects in the substantia nigra caused by Pitx3 deficiency. Development 134, 2673–2684 10.1242/dev.02865 [DOI] [PubMed] [Google Scholar]
- Jacobs F. M., van Erp S., van der Linden A. J., von Oerthel L., Burbach J. P., Smidt M. P. (2009a). Pitx3 potentiates Nurr1 in dopamine neuron terminal differentiation through release of SMRT-mediated repression. Development 136, 531–540 10.1242/dev.029769 [DOI] [PubMed] [Google Scholar]
- Jacobs F. M., van der Linden A. J., Wang Y., von Oerthel L., Sul H. S., Burbach J. P., Smidt M. P. (2009b). Identification of Dlk1, Ptpru and Klhl1 as novel Nurr1 target genes in meso-diencephalic dopamine neurons. Development 136, 2363–2373 10.1242/dev.037556 [DOI] [PMC free article] [PubMed] [Google Scholar]
- Keath J. R., Iacoviello M. P., Barrett L. E., Mansvelder H. D., McGehee D. S. (2007). Differential modulation by nicotine of substantia nigra versus ventral tegmental area dopamine neurons. J. Neurophysiol. 98, 3388–3396 10.1152/jn.00760.2007 [DOI] [PubMed] [Google Scholar]
- Klink R., de Kerchove d’Exaerde A., Zoli M., Changeux J. P. (2001). Molecular and physiological diversity of nicotinic acetylcholine receptors in the midbrain dopaminergic nuclei. J. Neurosci. 21, 1452–1463. [DOI] [PMC free article] [PubMed] [Google Scholar]
- Kolk S. M., Gunput R. A., Tran T. S., van den Heuvel D. M., Prasad A. A., Hellemons A. J., Adolfs Y., Ginty D. D., Kolodkin A. L., Burbach J. P. et al. (2009). Semaphorin 3F is a bifunctional guidance cue for dopaminergic axons and controls their fasciculation, channeling, rostral growth, and intracortical targeting. J. Neurosci. 29, 12542–12557 10.1523/JNEUROSCI.2521-09.2009 [DOI] [PMC free article] [PubMed] [Google Scholar]
- Millar N. S., Harkness P. C. (2008). Assembly and trafficking of nicotinic acetylcholine receptors (Review). Mol. Membr. Biol. 25, 279–292 10.1080/09687680802035675 [DOI] [PubMed] [Google Scholar]
- Olanow C. W., Kordower J. H., Lang A. E., Obeso J. A. (2009). Dopaminergic transplantation for Parkinson’s disease: current status and future prospects. Ann. Neurol. 66, 591–596 10.1002/ana.21778 [DOI] [PubMed] [Google Scholar]
- Peng X., Wood C. L., Blalock E. M., Chen K. C., Landfield P. W., Stromberg A. J. (2003). Statistical implications of pooling RNA samples for microarray experiments. BMC Bioinformatics 4, 26 10.1186/1471-2105-4-26 [DOI] [PMC free article] [PubMed] [Google Scholar]
- Prakash N., Wurst W. (2006). Genetic networks controlling the development of midbrain dopaminergic neurons. J. Physiol. 575, 403–410 10.1113/jphysiol.2006.113464 [DOI] [PMC free article] [PubMed] [Google Scholar]
- Saucedo-Cardenas O., Quintana-Hau J. D., Le W. D., Smidt M. P., Cox J. J., De Mayo F., Burbach J. P., Conneely O. M. (1998). Nurr1 is essential for the induction of the dopaminergic phenotype and the survival of ventral mesencephalic late dopaminergic precursor neurons. Proc. Natl. Acad. Sci. USA 95, 4013–4018 10.1073/pnas.95.7.4013 [DOI] [PMC free article] [PubMed] [Google Scholar]
- Sesack S. R., Carr D. B. (2002). Selective prefrontal cortex inputs to dopamine cells: implications for schizophrenia. Physiol. Behav. 77, 513–517 10.1016/S0031-9384(02)00931-9 [DOI] [PubMed] [Google Scholar]
- Simon H. H., Saueressig H., Wurst W., Goulding M. D., O’Leary D. D. (2001). Fate of midbrain dopaminergic neurons controlled by the engrailed genes. J. Neurosci. 21, 3126–3134. [DOI] [PMC free article] [PubMed] [Google Scholar]
- Smidt M. P., Burbach J. P. (2007). How to make a mesodiencephalic dopaminergic neuron. Nat. Rev. Neurosci. 8, 21–32 10.1038/nrn2039 [DOI] [PubMed] [Google Scholar]
- Smidt M. P., van Schaick H. S., Lanctôt C., Tremblay J. J., Cox J. J., van der Kleij A. A., Wolterink G., Drouin J., Burbach J. P. (1997). A homeodomain gene Ptx3 has highly restricted brain expression in mesencephalic dopaminergic neurons. Proc. Natl. Acad. Sci. USA 94, 13305–13310 10.1073/pnas.94.24.13305 [DOI] [PMC free article] [PubMed] [Google Scholar]
- Smidt M. P., Smits S. M., Bouwmeester H., Hamers F. P., van der Linden A. J., Hellemons A. J., Graw J., Burbach J. P. (2004). Early developmental failure of substantia nigra dopamine neurons in mice lacking the homeodomain gene Pitx3. Development 131, 1145–1155 10.1242/dev.01022 [DOI] [PubMed] [Google Scholar]
- Smits S. M., Ponnio T., Conneely O. M., Burbach J. P., Smidt M. P. (2003). Involvement of Nurr1 in specifying the neurotransmitter identity of ventral midbrain dopaminergic neurons. Eur. J. Neurosci. 18, 1731–1738 10.1046/j.1460-9568.2003.02885.x [DOI] [PubMed] [Google Scholar]
- Smits S. M., Burbach J. P., Smidt M. P. (2006). Developmental origin and fate of meso-diencephalic dopamine neurons. Prog. Neurobiol. 78, 1–16 10.1016/j.pneurobio.2005.12.003 [DOI] [PubMed] [Google Scholar]
- Thorgeirsson T. E., Gudbjartsson D. F., Surakka I., Vink J. M., Amin N., Geller F., Sulem P., Rafnar T., Esko T., Walter S. et al. ENGAGE Consortium(2010). Sequence variants at CHRNB3-CHRNA6 and CYP2A6 affect smoking behavior. Nat. Genet. 42, 448–453 10.1038/ng.573 [DOI] [PMC free article] [PubMed] [Google Scholar]
- Wong A. H., van Tol H. H. (2003). Schizophrenia: from phenomenology to neurobiology. Neurosci. Biobehav. Rev. 27, 269–306 10.1016/S0149-7634(03)00035-6 [DOI] [PubMed] [Google Scholar]
- Wu F., Sapkota D., Li R., Mu X. (2012). Onecut 1 and Onecut 2 are potential regulators of mouse retinal development. J. Comp. Neurol. 520, 952–969 10.1002/cne.22741 [DOI] [PMC free article] [PubMed] [Google Scholar]
Associated Data
This section collects any data citations, data availability statements, or supplementary materials included in this article.


