Abstract
A simple, accurate and sensitive spectroscopic method has been proposed for the assay of ciprofloxacin in tablet by least square treatment of fourier transform infrared spectrometric data obtained at the wavenumber corresponding to the carbonyl group centered at 1707 cm-1. The method involves the extraction of the active ingredient with methanol followed by phosphate buffer pH 6.0. The excipients in the commercial tablet preparation did not interfere with the assay. The specifity, linearity, detection limits, precision and accuracy of the calibration curve, drug extraction, infrared analysis and data manipulation were determined in order to validate the method. Moreover, the statistical results were compared with other methods for quantification of ciprofloxacin.
Keywords: Ciprofloxacin, FTIR, method validation
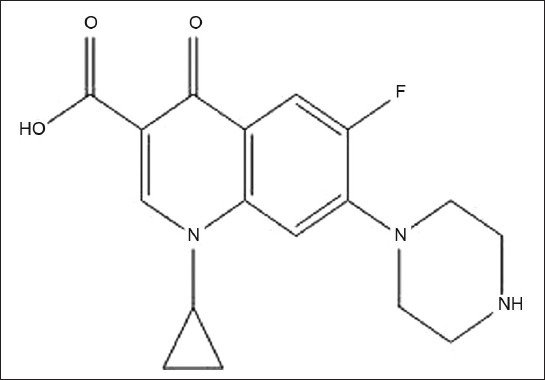
Ciprofloxacin hydrochloride, 1-cyclopropyl-6- fluoro-1,4-dihydro-4-oxo-7-(1-piperazinyl)-3- quinoline carboxilic acid (CPX), is a broad spectrum fluoroquinolone antibacterial agent used in the treatment of various bacterial infections caused by gram-positive and gram-negative microorganisms[1,2] (fig. 1). CPX is official in IP, USP and BP and their monograph revealed that RP- HPLC method (IP and USP) and non-aqueous titrimetric method (BP) were described for its estimation[3,4,5]. Others workers have reported methods ranging from derivatization coupled with ion-pair complexation reaction, capillary electrophoresis, high performance liquid chromatography (HPLC), colorimetry to spectrophotometric technique[5–8]. The literature shows variety of methods to analyze raw CPX and in pharmaceutical preparation. The recovery studies for non-aqueous titrimetric assay[9] using tetra-N-butylammonium hydroxide as titrant and pyridine as solvent; the visual titrimetric, pH metric, conductometric and spectrophotometric[10] techniques for CPX as bulk drug and in commercial formulations were found satisfactory.
Fig. 1.

Structural formula of Ciprofloxacin hydrochloride
Potentiometric titration avoids the interference of the excipients since completion of reaction is detected through slope change in graph between EMF (or pH) vs volume of titrant. The work is based on the fast complexation reaction between iron (III) and CPX in sulfuric acid media by using silver amalgam electrode[11]. The spectrofluorimetric assay[12] was performed by using wavelengths of excitation and emission at 290 and 450 nm, respectively and Spectrophotometric determination following oxidation with cerium sulphate at λmax 470 nm[13]. The capillary zone electrophoresis (CZE) has been elaborated for separation, identification and determination of CPX and its impurities. The phosphate buffer (pH 6.0) was supplemented with 0.075 M pentane-1-sulfonic acid sodium salt. The validation results were found applicable to the analysis of different medicinal products containing CPX[14].
The HPLC method is used worldwide for quality control of CPX. This method allows determination of CPX in different pharmaceutical dosage forms in the presence of its potential impurities and degradation products[15,16].
However, to date, no analytical method has been described in the literature that uses fourier transform infrared spectroscopy for quantitative analysis of CPX in pharmaceutical tablet. The aim of the present study is to investigate the validation and application of analytical methods for quality control of 100 mg CPX hydrochloride tablet formulations.
All solvents and reagents were of analytical reagent grade, double distilled water was used throughout. Pharmaceutical grade CPX (>99 %) was obtained from Pegasus Farmaco India (P) LTD, Roorkee, India. Methanol was obtained from E. Merck, Mumbai (India). The commercial pharmaceutical containing CPX hydrochloride, Ciplox was procured from local drugstores. All dilutions were performed in standard volumetric glasswares. The IR analysis was performed in a Spectrum Two FTIR spectrometer (Perkin Elmer, USA) by using circular KBr cell window, 0.05 mm round Teflon spacers, Spectrum 10 software (Perkin Elmer, USA), Homogenizer (Trumark, India).
An accurately weighed quantity of CPX HCl was dissolved in small quantity of phosphate buffer pH 6.0 and the final volume was made up to 100 ml with methanol as solvent to get 500 μg/ml concentration of standard stock solution. Various working concentrations were made by further dilution with same medium.
Ten tablets were taken for assay, finely powdered and homogenized. An accurately weighed quantity of powder was dissolved in 5 ml phosphate buffer pH 6.0 followed by 20 ml of methanol. The solution is maintained under stirring for 5 min and was centrifuged in order to separate excipients. The supernatant solution was further diluted with 25 ml of methanol to get 150 μg/ml solutions. All the determinations were conducted in triplicate taking the absorbance of each solution at 1707 cm-1wavenumber. The method validation was done by evaluating selectivity and linearity, limit of detection (LOD) and limit of quantitation (LOQ), accuracy, precision as indicated in the ICH guidelines[17].
For the Selectivity and linearity, the primary stock of CPX solution was diluted as appropriate with methanol and phosphate buffer to obtain final dilutions in three replicates. The calibration curve for CPX was obtained by plotting the peak area (carbonyl group centered at 1707 cm-1) versus concentration.
The LOD is the lowest concentration of an analyte that the analytical process can reliably detect and the LOQ refers to the smallest concentration or the mass which can be quantitatively analyzed with reasonable reliability by a given procedure[18]. The LOD and LOQ were calculated by instrumental and statistical methods. For the instrumental method LOD is determined as the lowest amount to detect and LOQ is the lowest amount to quantify by the detector. For statistical method LOD and LOQ determined by statistical formula. LOD= 3.3 σ/Slope, LOQ= 10 σ/ Slope, where, σ is standard deviation.
Accuracy of an analytical method describes the closeness of mean test results obtained by the method to the true value (concentration) of the analyte. This is sometimes termed as trueness[19]. The statistical accuracy was determined by adding known amount of CPX reference standard to the sample at the beginning of the process. Amount of 1.0, 2.0 and 3.0 ml of CPX standard solution (500 μg/ml) and a aliquot of 2 ml of this solution (150 μg/ml) was transferred to 100 ml volumetric flask, respectively B1, B2 and B3. The percentage recovery was also performed for B1, B2, and B3 for three days in triplicate. Precision is the closeness of individual measures of an analyte when the procedure is applied repeatedly. The % Relative standard deviation (RSD) is indication of repeatability (precision) and reproducibility of an experiment. %RSD of peak areas of carbonyl group was calculated for B1, B2 and B3 solution.
The accuracy and precision of the assay, as well linearity of the calibration curve, were determined. Having established the quantitative relationships between the parameters studied, and knowing the predictive performance of their association model, a linear simple regression by the least squares method was applied. The statistical analysis was calculated by ANOVA.
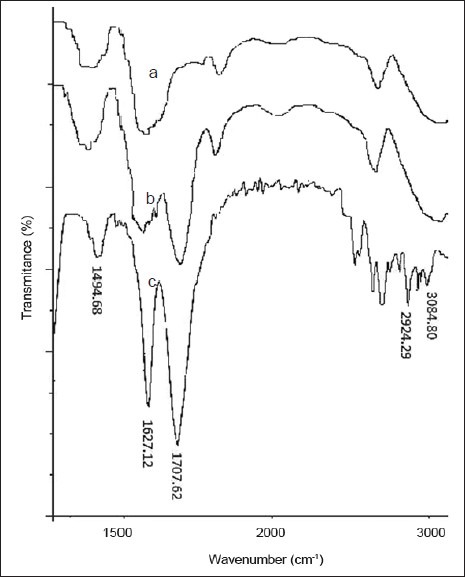
The linearity results were evaluated by linear regression analysis based on the minimum square method. The correlation coefficient value obtained over the range of 2-20 μg/ml is r=0.998. The result shows linear correlation between analytical responses and drug concentration. The ability to assess unequivocally the analyte in presence of excipients was tested. The method is found to be selective (fig. 2).
Fig. 2.

Infrared spectra of samples.
Infrared spectra (a) of excipients (b) Tablet of ciprofloxacin (c) ciprofloxacin monitored at 1707 cm-1.
The LOD and LOQ is found 0.068 μg/ml and 0.450 μg/ml respectively. The %RSD values are indication of repeatability and reproducibility of an experiment and the error and recovery values shows Accuracy of analytical determination. The FTIR analytical method showed good accuracy, evaluated by the recovery test (Table 1). The mean recovery percentages for products B1, B2 and B3 respectively 101.72, 98.34, 100.41, corroborated satisfactory recovery.
TABLE 1.
ACCURACY DATA

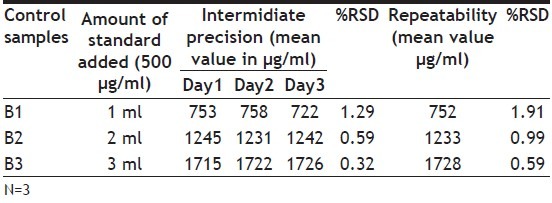
The precision was determined by means of a one-way ANOVA including 3 replicates carried out on three successive days The percentage relative standard deviations for repeatability and intermediate precision were 1.16 and 0.73. These experimental results confirmed good precision of the method when performed on the same or different days by different analysts (Table 2).
TABLE 2.
PRECISION DATA

The robustness test examines the experimental conditions for the method, and the potentially responsible factors such as experimental and environmental conditions, to be taken into account during method development. To demonstrate the robustness of the method the following conditions were changed i.e. cuvette (CaF2 and KBr) and temperature. For this sample solution B2 was used in triplicate. For FTIR analytical methods, the low RSD values demonstrated that the analysis factors (cuvette and room temperature) did not have a significant effect on analytical responses (Table 3).
TABLE 3.
ROBUSTNESS DATA

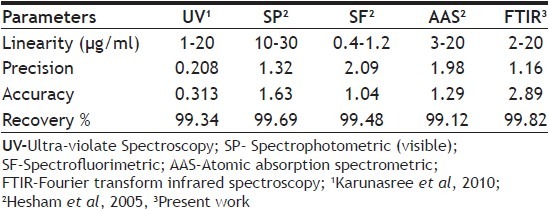
Table 4 shows labeled amount of active ingredient and the percentage recovery values obtained for CPX pharmaceuticals. The recovery values are with in acceptable limits as recommended by pharmacopeias (90-110% in BP, USP). Table 5 compares the linearity, accuracy, precision and recovery of present method with other techniques reported in literatures[20,21]. The quantification of CPX through FTIR method presents lower precision than other methods reported in Table 5. The low precision of FTIR, UV/Vis method might be attributed to the extraction of the active ingredient from the pharmaceutical that is required in order to perform assay. The recovery values found were similar for all methods.
TABLE 4.
QUANTIFICATION OF CPX HYDROCHLORIDE THROUGH FTIR IN PHARMACEUTICAL PRODUCTS

TABLE 5.
COMPARISON OF FTIR METHOD WITH OTHER METHODS FOR ASSAY OF CIPROFLOXACIN

All validation parameters were found to be highly satisfactory, indicating linearity, selectivity, precision, accuracy, robustness and adequate detection and quantification limit. The method is therefore shown to be suitable for evaluation of CPX hydrochloride pharmaceutical tablet and for routine use in quality control laboratories.
This technique extends the use of a standard IR spectrophotometer, typically used for identification purpose. The present method opens the possibility of applying IR spectroscopy to quantify other active ingredient than CPX.
REFERENCES
- 1.Budavari S, editor. 13th ed. NJ: Merck and Co; 2001. The Merck Index; p. 403. [Google Scholar]
- 2.Mishra L, editor. Delhi: Lorina Publications (India) Inc; 2006. Drug Today; p. 265. [Google Scholar]
- 3.Vol. 1. Delhi: Government of India, The Controller of Publications; 1996. Indian Pharmacopoeia; p. 187. [Google Scholar]
- 4.The United States Pharmacopoeia. Rockville, MD: United States Pharmacopoeial Convention Inc; 2003. 26th Rev; p. 457. [Google Scholar]
- 5.London: Her Majesty's Stationary Office; 2000. British Pharmacopoeia; p. 399. [Google Scholar]
- 6.Nagaralli BS, Seetharamappa J, Melwanki MB. Sensitive spectrophotometer methods for the determination of amoxycillin, ciprofloxacin and piroxicam in pure and pharmaceutical formulations. J Pharm Biomed Anal. 2002;29:859–64. doi: 10.1016/s0731-7085(02)00210-8. [DOI] [PubMed] [Google Scholar]
- 7.Eboka CJ, Aigbovboa J, Akerele JO. Colorimetric determination of the fluoroquinolones. J Antimicrob Ther. 1997;39:639–41. doi: 10.1093/jac/39.5.639. [DOI] [PubMed] [Google Scholar]
- 8.Kanakapura B, Paregowda N, Bankavadi CS, Veeraiah R. Spectrophotometric and titrimetric determination of ciprofloxacin based on reaction with cerium (IV) sulphate. ScienceAsia. 2006;32:403–9. [Google Scholar]
- 9.Kilic E, Koseoglu F, Akay MA. The non-aqueous titrimetric assay of selected antibiotics using tetra-N-butyl ammonium hydroxide as titrant. J Pharm Biomed Anal. 1994;12:347–52. doi: 10.1016/0731-7085(94)90010-8. [DOI] [PubMed] [Google Scholar]
- 10.Basavaiah K, Nagegowda P. Titrimetric and spectrophotometric assay methods for ciprofloxacin in pharmaceuticals based on neutralization reaction. Nat Acad Sci Lett. 2006;29:189–94. [Google Scholar]
- 11.Abdalla MA, Sultan SM, Al-olyn AM, Al-Ghannam SM. Differential electrolytic potentiometric titration method for the determination of ciprofloxacin in drug formulations. Talanta. 2003;61:239–44. doi: 10.1016/S0039-9140(03)00246-7. [DOI] [PubMed] [Google Scholar]
- 12.Durmus Z, Canel E, Kiliq E. Spectrofluorimetric assay of ciprofloxacin hydrochloride in tablets. Anal Quant Cytol Histol. 2005;27:162–6. [PubMed] [Google Scholar]
- 13.Olajire AA, Bose BB. Spectrophotometric determination of some Quinolones antibiotics following oxidation with cerium sulphate. Int J Pharm Sci Rev Res. 2010;4:1–10. [Google Scholar]
- 14.Katarzyna M, Genowefa P, Stefan T. Determination of ciprofloxacin and its impurities by capillary zone electrophoresis. J Chromatogr A. 2004;1051:267–72. doi: 10.1016/j.chroma.2004.04.048. [DOI] [PubMed] [Google Scholar]
- 15.Aksoy B, Kucukguzel I, Rollas S. Development and validation of a stability-indicating HPLC method for determination of ciprofloxacin hydrochloride and its related compounds in film-coated tablets. Chromatographia. 2007;66:57–63. [Google Scholar]
- 16.Predrag S, Andreja S, Radosav P, Sinisa D, Valentina M. Ruggedness testing of an HPLC method for the determination of ciprofloxacin. J Serb Chem Soc. 2005;70:979–86. [Google Scholar]
- 17.ICH, (Q2B), Harmonized Tripartite Guideline. Validation of analytical procedures: Methodology. Geneva: Proceeding of the International conference on Harmonization. 1996.
- 18.Mocak J, Bond AM, Mitchell S, Scollary G. A statistical overview of standard (IUPAC and ACS) and new procedures for determining the limits of detection and quantification: Application to voltammetric and stripping techniques. Pure Appl Chem. 1997;69:297–328. [Google Scholar]
- 19.Singh UK, Pandey S, Pandey P, Keshri PK, Ram A. Bioanalytical sample preparation and validation. Indian Pharm. 2008;7:25–32. [Google Scholar]
- 20.Hesham S. Spectrofluorimetric, atomic absorption spectrometric and spectrophotometric determination of some fluoroquinolones. Am J Appl Sci. 2005;2:719–29. [Google Scholar]
- 21.Karunasree A, Thejomoorthy K, Jaffer M, Padmanabha RY, Ramalingam P. In vitro protein binding study of ciprofloxacin by new UV-spectrophotometric method. Int J Pharm Tech Res. 2010;2:1150–4. [Google Scholar]


