

Abstract
The in vitro autoxidation of N-hydroxyurea (HU) is catalyzed by MnIIITTEG-2-PyP5+, a synthetic water soluble Mn(III) porphyrin which is also a potent mimic of the enzyme superoxide dismutase. The detailed mechanism of the reaction is deduced from kinetic studies under basic conditions mostly based on data measured at pH = 11.7 but also including some pH-dependent observations in the pH range 9 – 13. The major intermediates were identified by UV-vis spectroscopy and electrospray ionization mass spectrometry. The reaction starts with a fast axial coordination of HU to the metal center of MnIIITTEG-2-PyP5+, which is followed by a ligand-to-metal electron transfer to get MnIITTEG-2-PyP4+ and the free radical derived from HU (HU•). Nitric oxide (NO) and nitroxyl (HNO) are minor intermediates. The major pathway for the formation of the most significant intermediate, the {MnNO} complex of MnIITTEG-2-PyP4+, is the reaction of MnIITTEG-2-PyP4+ with NO. We have confirmed that the autoxidation of the intermediates open alternative reaction channels, and the process finally yields NO2− and the initial MnIIITTEG-2-PyP5+. The photochemical release of NO from the {MnNO} intermediate was also studied. Kinetic simulations were performed to validate the deduced rate constants. The investigated reaction has medical implications: the accelerated production of NO and HNO from HU may be utilized for therapeutic purposes.
INTRODUCTION
In the past few years, numerous metalloporphyrins have been developed for therapeutic purposes including the treatment of several diseases related to oxidative stress.1 Manganese lacks Fenton chemistry-related toxicity, and the porphyrin cyclic structure provides both a high metal/ligand complex stability and rich biologically relevant redox chemistry at the metal site. Some of the most efficacious of these synthetic porphyrins are water soluble manganese(III) porphyrins. In these systems, the MnIII/MnII reduction potential is fine tuned to be in a desirable range at around +300 mV versus NHE for optimal in vivo catalytic activity. Thus, novel water soluble manganese(III) porphyrins and porphyrin derivatives have been successfully developed as superoxide dismutase (SOD) mimics.2–6 The ortho isomers of Mn(III) N-alkylpyridyl-, N-methoxyalkyl- and N-tri(ethyleneglycol)-porphyrins are the most potent in vivo antioxidants.7–10 The oxygen-derivatives, such as N-methoxyalkyl- and N-tri(ethyleneglycol)-porphyrins, possess superior properties relative to N-alkylpyridylporphyrins, most so with respect to bioavailability and toxicity. Oxygen atoms were incorporated into alkyl chains to suppress the micellar properties of longer alkyl-chain analogs. Yet, such derivatization reduced compound lipophilicity. While studying mechanistic issues, another oxygen-derivatized Mn porphyrin proved to be important. Oxygen atoms in this case are buried deeper in the molecule which assures no loss of lipophilicity when compared to the compound with equally long alkyl chains. However, the toxicity of such analogue is much lower. MnTnBuOE-2-PyP5+ is considered for clinical development. The cationic manganese(III) N-substituted porphyrins are also reactive towards other oxygen or nitrogen species, in particular towards peroxynitrite ion11–12 and nitric oxide.13–14 In addition to the capacity of neutralizing several reactive oxygen and nitrogen species, the novel manganese(III) porphyrins are highly bioavailable as their in vivo ability to reduce oxidative stress injuries are proved in several studies.15–16 The high reactivity of these Mn(III) porphyrins towards small molecules and their ability to undergo fast axial-ligand substitution17–19 during redox cycling are key aspects of their in vivo and in vitro solution-phase chemistry. Despite the biological and industrial importance of the redox reactions of Mn porphyrins only a few studies give detailed information on their mechanisms.20–22
In the present paper, we characterize the reactivity of a selected manganese(III) porphyrin complex (MnTTEG-2-PyP as seen in Scheme 1) by establishing a detailed kinetic model of its in vitro reaction with N-hydroxyurea (HU), a hydroxamic acid with a wide variety of therapeutical applications.
Scheme 1.

The structures of hydroxyurea (HU) and the studied synthetic water soluble Mn(III) porphyrin: MnTTEG-2-PyP5+ abbreviated as Mn(III)TTEG. 2 axially coordinated water molecules are indicated (independently from the structure of the Mn(III) porphyrin).
HU has been used in human medical therapy for more than 40 years because of its broad antitumor spectrum. In limited cases of cervical23 and uterine24 cancer, the therapeutic effect of HU was found to be adequate without significant impact on normal cellular mechanisms. Currently, HU has become a standard agent against chronic myelogenous leukemia, polycythemia vera, and myeloproliferative disorders.25–26 HU has recently been introduced into sickle cell anemia therapy27–29 with considerable success. A long-term study indicates that there is a 40% decrease in mortality among patients who received the HU therapy.30 The clinical efficiency of HU is assumed to be due to the in vivo formation of fetal hemoglobin.30–31 However, some patients benefit from the HU therapy before any increase in the fetal hemoglobin concentration even take place. This indicates that another mechanism of therapeutic action needs to coexist.32 Sickle cell anemia patients receiving HU have shown increases in the production of nitric oxide (NO) metabolites, which include iron-nitrosylhemoglobin (HbNO), NO2−, and NO3− ions.33–35 It has been reported that HU, similarly to many other hydroxamic acids, acts as a nitric oxide donor under oxidative conditions in vitro.36–37 Direct nitric oxide producing reactions of HU and hemoglobin, myoglobin, or hemin may contribute to the overall pathophysiological properties of this drug.38 EPR evidence showed that HU reacts with oxy-, deoxy-, and metHb to produce 2–6% of iron-nitrosylHb.39 The formation of NO3− during the reaction of N-hydroxyurea and oxyHb and the lack of any nitrous oxide production in these reactions suggests the intermediacy of nitric oxide as opposed to its reduced form, nitroxyl (HNO). However, the exact mechanism by which HbNO forms in vivo is not completely understood.40 Moreover, several articles show evidence for HNO formation from N-hydroxyurea under different oxidative conditions.41
The reason for studying the reaction of HU with Mn(III)TTEG was that some recent reports describe characteristically different reactivities of some manganese(III) porphyrins with NO and with HNO donor compounds.42 Thus, we hoped to contribute to the understanding of the mechanism of therapeutic action by establishing a detailed kinetic model for the in vitro oxidative degradation of HU by Mn(III)TTEG.
EXPERIMENTAL METHODS
Reagents and solutions
Mn(III)TTEG was synthesized by the method described previously.10 The free Mn2+ content of the Mn(III)TTEG stock solution was measured to be 1.53 (n/n)% of the Mn(III)TTEG.43 Mn(II)TTEG was prepared by reducing Mn(III)TTEG with excess ascorbic acid in solution under anaerobic conditions.44 Mn(II)TTEG–NO was prepared by adding a solution containing NO to the Mn(II)TTEG solution.44 Homemade NO gas was passed through 6 M NaOH, water, a column of solid NaOH and finally collected into Ar-purged water. All other chemicals were purchased from Sigma-Aldrich, Merck or Fluka in the highest available purity and were used without further purification. Ultrafiltered (Milli-Q, Millipore) water was used for preparing solutions. The reactant concentrations in the reaction mixtures varied from 0.1 μM to 150 μM. The pH of the reaction mixture was maintained either by NaOH (from pH = 10.3 to 12.7, no other additive neccessary) or by borate buffer (from pH = 9.1 to 10.1). The pH was measured by a Metrohm 6.0234.110 combined glass electrode attached to a Metrohm 721 NET Titrino titrating unit. The electrode was calibrated by two buffers according to the IUPAC recommendations. The ionic strength was adjusted and kept at a fixed value by the addition of NaClO4 in the entire study. The initial concentration of the dissolved O2 (c0(O2)) was controlled by bubbling O2 (99+ %) or Ar (99+ %) into previously aerated reactant solutions. When the required c0(O2) was achieved, the reactant solutions were mixed in a sealable vessel (usually a special quartz cuvette) under air tight conditions. The c0(O2) was measured by a YSI 5100 Dissolved Oxygen Meter with a YSI 5010 probe calibrated by following the recommendations of the manufacturer.
UV-vis photometric pH titration
The pKa values of Mn(III)TTEG, Mn(II)TTEG and HU were measured by UV-vis titration. The spectral change was recorded in a spectral probe with 1.0 cm optical path length, which was attached to a Varian Cary 50 scanning spectrophotometer. Anaerobic conditions were maintained by constant Ar purging. The detailed description of the method can be found elsewhere.45
17O-NMR measurements
The rate and temperature dependence of the exchange between the axially coordinated and bulk water molecules in a Mn(III)TTEG solution was studied by 17O-NMR method. Variable-temperature measurements were performed using a Bruker DRX-400 (9.4 T, 17O at 54.2 MHz) spectrometer. Homemade air-circulating and Eurotherm temperature control units were used to stabilize the temperature. The details of the measurements and data evaluation are described previously.18
Electrospray ionization mass spectrometry (ESI-MS)
ESI-MS measurements were carried out with a Bruker micrOTOFQ mass spectrometer equipped with a quadrupole and time-of-flight (Q-TOF) analyzer in positive ion mode. The sample solutions were introduced directly into the ESI source at 3.0 μL/min via a gas-tight syringe (Hamilton) and a syringe pump (Cole-Parmer Ins.). The syringe pump was synchronized with the software of the MS instrument which enabled the precise determination of the aging time of the reaction mixture at the instance of data recording. With this feature, reaction time resolved ESI-MS spectra were collected. The nebulizer pressure was set to 6 psi, N2 was used as drying gas at 4 L/min, the temperature was maintained at 160 °C, and the applied capillary voltage was −3.0 kV. The error of mass measurement was below 0.005 in the m/z range from 80 to 600. Spectra were accumulated and recorded by a digitizer at a rate of 2 GHz. Sample solutions of ionic strength less than 1 mM were introduced into the MS to avoid decrease in the signal-to-noise ratio. Basic solutions (pH ≈ 10) of the Mn porphyrins were usually studied. All the mass spectra were evaluated by the DataAnalysis 3.4 software from Bruker. Peak identification was based on accurate mass and isotopic distribution.
Ion chromatography (IC)
Ion exchange chromatography measurements were performed in a Metrohm modular-built IC instrument with a Metrosep Dual 4_25_4.6 functionalized silica anion exchange column (25 mm × 4.6 mm). The eluent was aqueous paracyanophenol solution (12 mM) buffered by the addition of KOH (pH = 7.45). The flow rate was 2.0 ml/min at a pressure of 2.7 – 2.9 MPa. A cation suppressor column was used in every measurement which was regenerated by 0.05 M sulfuric acid solution. External calibration series were made for NO2− and NO3− measurements.
Kinetic measurements
The majority of the kinetic experiments were carried out in a PerkinElmer Lambda 25 scanning UV-vis photometer. The solutions of HU and Mn(III)TTEG were loaded into a tandem-cuvette and the reaction was started with hand-mixing which usually introduced a ca. 4 s loss (< 1 %) of kinetic data. The same protocol was used for the measurements with an HP8453 photodiode-array (PDA) photometer with adjustable integration time. The first few seconds of the reaction was studied in an Applied Photophysics DX-17 MV stopped-flow instrument with either a photomultiplier tube (PMT) or a PDA installed as the detector. The temperature was maintained with Julabo F-12 water circulators.
Softwares
The raw data sets of the measurements were processed with the instrument controlling softwares. Additional transformation of the data was made using Microsoft Excel 2003. Typically, Micromath Scientist 2.046 was used for Levenberg-Marquard least-squares fitting procedures. Multiple sets of kinetic curves recorded under different initial condititions were simultaneously evaluated with the program package ZiTa47 using the GEAR algorithm.48
RESULTS AND DISCUSSION
Characterization of the reactants
The pKa values of the two axially coordinated water molecules of Mn(III)TTEG were determined by UV-vis spectrophotometric titration to be pKa1 = 10.71 ± 0.03 and pKa2 = 11.7 ± 0.1. The details of the method are given elsewhere.45 The pK values and the individual spectra of each species (Figure S1) are in agreement with literature precedents of slightly different Mn(III) porphyrins.45 In the second deprotonation step, the formation of an MnIII=O species is assumed based on an analogy with similar Mn(III) porphyrins.45 The rate and the mechanism of the exchange of the axially coordinated (MnIII–H2O) and bulk water molecules were studied at pH = 6.0 by 17O-NMR (Figure S2), as described earlier.18 The rate of exchange at 298 K was measured to be kex298 = 4.88×10⁶ s−1 and the activation parameters for the exchange reaction: ΔH‡ = 31 ± 5 kJmol−1; ΔS‡ = −13 ± 20 Jmol−1K−1. Based on the activation parameters, the mechanism of the water exchange is assumed to be dissociative interchange (Id).18–19 A UV-vis photometric titration under anaerobic conditions was carried out also with the reduced Mn(II)TTEG: pKa3 = 9.8 ± 0.1 and pKa4 = 11.7 ± 0.1. The spectra of the corresponding species were calculated (Figure S1).45 The ESI-MS spectra of both Mn(III)TTEG and Mn(II)TTEG were recorded from pH = 10.7 solutions.
The stability of the N-hydroxyurea stock solution was studied at pH = 11.7. Under anaerobic conditions, no change of the UV-vis spectrum was detected in four hours. Under aerobic conditions (c0(O2) = 2.5×10⁻⁴ M), the HU signal (c0(HU) = 50 μM) decayed in a pseudo first-order reaction characterized by kobs = (5.0±0.5)×10−4 s−1 (kobs/c0(O2) = 2 M−1s−1). This process is interpreted as direct autoxidation, but it is substantially slower than the reactions studied in the rest of this work, and its contribution to the overall catalytic process is taken into account (see details in Kinetic model section and Scheme 1). The pKa of the –OH in HU was measured to be pKa5 = 10.98±0.0649–50 and the UV-vis spectra of the protonated and the deprotonated forms were recorded (Figure S3).
Effects of pH, dissolved oxygen and light on the kinetics of the reaction
The UV-vis spectral change observed during the reaction of HU + Mn(III)TTEG at pH = 11.7 and the corresponding kinetic curve at 430 nm can be seen in Figure 1. The displayed wavelength and the indicated pH was selected based on an analysis of the spectral effects to give a maximum signal for the first, increasing part of the kinetic curve. In this region, the absorbance first rises then decreases, which is consistent with the formation of an intermediate. It should be emphasized that Figure 1 shows only a few characteristic spectra for clarity, and these may appear to show an isobestic point at around 435 nm. However, the full set of spectra did not show a consistent isobestic point and the apparent constancy of the absorbance around 435 nm was understood to be the consequence of compensation between molar absorbances and reaction stoichiometries in a multi-step process, a phenomenon known from the literature of kinetics. In any case, the multi-step nature of the studied process is clearly demonstrated by the maximum on the kinetic curves measured at 430 nm.
Figure 1.
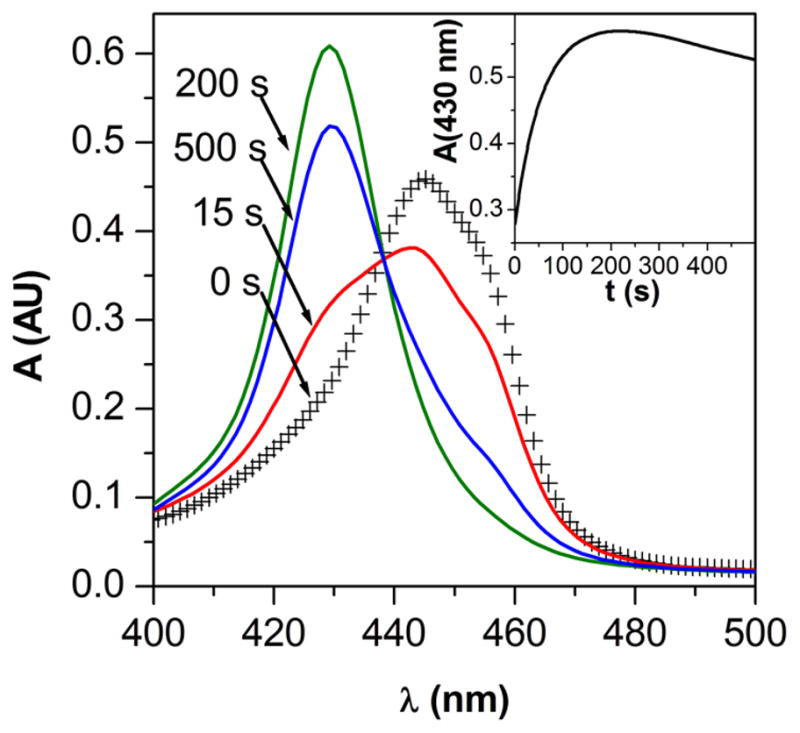
Representative spectral changes observed during the reaction of Mn(III)TTEG and HU. The spectrum at 0 s is the sum of the spectra of the reactants recorded before mixing. Inset: kinetic curve recorded at 430 nm, which is the Amax of the major intermediate. c0(Mn(III)TTEG) = 3.75 μM, c0(HU) = 15.0 μM, pH = 11.70, c0(O2) = 254 μM, I = 1.0 M, T = 25.0 °C.
The reaction was faster at higher pH and no reaction was observed within 60 min at pH = 6.0 or below. To be able to conveniently follow the reaction system, the majority of the kinetic experiments were run at pH = 11.7, where the process was complete in a few minutes. The reaction was found to be significantly faster with higher initial concentrations of dissolved O2, as detailed later. Under anaerobic conditions, no absorbance increase was observed at 430 nm at pH = 12.7 within 60 s. The majority of the kinetic measurements were carried out with solutions initially containing 2.5×10⁻⁴ M O2 (i.e., equilibrated with air at 1.0 bar and thereafter sealed from air). The addition of MnCl2 or Na2EDTA had no effect on the reaction.
The fast steps of the reaction were studied in a stopped-flow apparatus and the slower steps in scanning or diode array photometers. An unusual observation was made: the kinetic behavior of the reaction varied with the type of instrument used for data recording under otherwise identical conditions (Figure S4). Additional investigation revealed that the reaction is light-sensitive and during the photometric measurements, the instrument specific illumination of the reaction mixtures altered the kinetics. The light intensity dependence of the reaction was studied by the variation of the exit slit-width of the monochromator of the stopped-flow apparatus or the integration time of the diode-array photometer.51 In the case of the stopped-flow measurements, the increase in the spectral bandwidth with increasing slit width was taken into account. Detailed experiments proved that the initial reaction rate at 430 nm (v0430nm) slightly decreases with the intensity of illumination, and the intermediate at 430 nm decays with a rate proportional to the light intensity (Figure 2). Because of the photosensitivity of the reaction system, the majority of kinetic experiments were performed in a scanning photometer where the light intensity was set at its minimum. Only the fastest experiments (milliseconds) were followed by stopped-flow PDA. The photochemical effect was proven to be negligible over such a short timescale.
Figure 2.

The effect of the intensity of illumination on the reaction of Mn(III)TTEG and HU. The exit slit width of the monochromator in the stopped-flow instrument was varied from 0.5 mm to 2.5 mm in 0.5 mm steps. The light intensity is roughly proportional to the exit slit width. Left panel: Kinetic traces at different slit widths of the monochromator. Right panel: The initial reaction rate of the overall reaction (red triangles) and the pseudo first-order rate constant of the decay of the Mn(II)TTEG–NO (Amax = 430 nm) intermediate (blue dots) as functions of the exit slit width of the monochromator. c0(Mn(III)TTEG) = 7.02 μM, c0(HU) = 15.0 μM, pH = 11.70, c0(O2) = 254 μM, I = 1.0 M, T = 25.0 °C.
Intermediates and products
The visible part of the UV-vis spectrum of the product solution (60 min after mixing Mn(III)TTEG and HU) is identical to the spectrum of the Mn(III)TTEG reactant. Matrix rank analysis of the time resolved UV-vis spectra indicates the presence of 3 to 4 absorbing species during the course of the reaction at constant pH,52–53 thus the formation of 2 to 3 intermediates are expected. Mn(II)TTEG–NO was independently prepared in solution, and as seen in Figure S5 its UV-vis spectrum was found to be identical to that of the major intermediate of the reaction (Amax at 430 nm).
The reaction was also monitored with ESI-MS from ca. 50 s after mixing. The time resolved +ESI-MS spectra of the reaction mixture were compared to the spectra of independently prepared Mn(III)TTEG, Mn(II)TTEG and Mn(II)TTEG–NO solutions. Table 1 and Figure S6 show some identified peaks corresponding to Mn(III)TTEG, Mn(II)TTEG and Mn(II)TTEG–NO. The intensity of the ESI-MS signal of Mn(III)TTEG increased, and the intensities of the signals of Mn(II)TTEG and Mn(II)TTEG–NO decreased in the reaction mixture from 50 s to 400 s after mixing (Figure 3). The +ESI-MS spectrum of the product solution (60 min after mixing) showed the presence of only Mn(III)TTEG. The quantitative evaluation of the recorded time-traces are challenging because the relative sensitivities of the MS instrument slightly change for each species with the changing composition of the analyte solution. Because of this phenomenon, the MS method was not suitable for quantitatively monitoring the reaction, only the major trends in the changes of concentrations could be detected. It should also be noted that the MS experiments were carried out under slightly different conditions than the rest of the kinetic measurements to avoid complications from the high ionic strength.
Table 1.
The identified major +ESI-MS species corresponding to Mn(III)TTEG, Mn(II)TTEG and Mn(II)TTEG–NO. Only the most abundant isotopic peaks are shown in the table.
| Species | Formula | m/z | |
|---|---|---|---|
| Measured | Calculated | ||
| (Mn(III)TTEG) +2OH− | C68H86N8O14Mn3+ | 431.1882 | 431.1876 |
| (Mn(III)TTEG) –H+ +OH− | C68H84N8O13Mn3+ | 425.1828 | 425.1841 |
| (Mn(III)TTEG) –2H+ | C68H82N8O12Mn3+ | 419.1799 | 419.1805 |
| (Mn(II)TTEG) +OH− | C68H85N8O13Mn3+ | 425.5203 | 425.5200 |
| (Mn(II)TTEG) –H+ | C68H83N8O12Mn3+ | 419.5144 | 419.5165 |
| (Mn(II)TTEG–NO) –H+ +OH− | C68H84N9O14Mn3+ | 435.1818 | 435.1834 |
| (Mn(II)TTEG–NO)–2H+ | C68H82N9O13Mn3+ | 429.1778 | 429.1799 |
Figure 3.

The change of the +ESI-MS intensities of Mn(III)TTEG (m/z 431.1882), Mn(II)TTEG (m/z 425.5203) and Mn(II)TTEG–NO (m/z 435.1818) during the reaction of Mn(III)TTEG and HU. The intensities are given in percentage of the measured intensities in a reference solution of Mn(III)TTEG under identical conditions. c0(Mn(III)TTEG) = 10.0 μM, c0(HU) = 49.5 μM, pH = 10.70, c0(O2) = 254 μM, T = 25.0 °C.
Based on IC measurements, HU is quantitatively converted to NO2− in the reaction, and NO2− undergoes slow autoxidation (t½ ≈ 200 min) to NO3− afterwards.
Effect of the reactant concentrations
The concentration dependence of the reaction was studied by varying the concentration ratio of Mn(III)TTEG to HU from 1 : 0.2 to 1 : 30 (Figure S7). First, the experimental kinetic results were evaluated by the initial rate method. The v0430nm versus initial concentration curves saturated at high relative concentrations of either Mn(III)TTEG or HU in the wide pH range from 10.7 to 12.7 (Figure 4). If we assume the formation of a reactive adduct from the reactants (Mn(III)TTEG–HU) in a fast pre-equilibrium (the mathematical derivation used here is very similar to an earlier example54):
| (1) |
| (2) |
where k0430nm is a wavelength dependent rate constant and K0 is the equilibrium constant of the adduct formation. The protonation state of HU and Mn(III)TTEG changes in the studied range of pH, therefore, both k0430nm and K0 are pH dependent. Eqn (2) fits the v0430nm versus initial concentration curves well with k0430nm = (2.34±0.03)×103 AU s−1M−1 and K0 = (4.1±0.2)×105 M−1 at pH = 11.70. (All the parameters determined in this study are also reported in Table 2). Stopped-flow measurements with PDA detection proved that the spectrum of the reaction mixture at 100 ms after mixing differs from the sum of the spectra of the reactants, and it varies with the relative concentration of the reactants (Figure S8).
Figure 4.

Left panel: Dependence of the initial rate of reaction on the relative initial concentrations of the reactants at different pH values. Dots: measured values, lines: fitted curves on the basis of eqn 2. c0(Mn(III)TTEG) = 3.75 μM, c0(HU) = from 0.763 μM to 114 μM, c0(O2) = 254 μM, I = 1.0 M, T = 25.0 °C. Right panel: The same as left, only the initial concentration of Mn(III)TTEG was varied while that of HU was constant. Dots: measured values, lines: fitted curves. c0(Mn(III)TTEG) = from 1.25 μM to 6.25 μM, pH = 11.70, c0(O2) = 254 μM, I = 1.0 M, T = 25.0 °C.
Table 2.
Parameters determined in this study.
| Parameter | Estimated value | Definition |
|---|---|---|
| k0430nm | (2.34±0.03)×103 AU s−1M−1 | defined in eqn (1) a |
| K0 | (4.1±0.2)×105 M−1 | defined in eqn (1) a |
| k2 | (8.5±0.3)×103 s−1 | R2 in Scheme 2 a |
| k3 | (4.8±0.1)×10−2 s−1 | R3 in Scheme 2 a |
| k4 | (4.6±0.1)×101 M−1s−1 | R4 in Scheme 2 a |
| k5 | (8.8±0.3)×100 s−1 | R5 in Scheme 2 a |
| k7 | (9.0±0.1)×10−1 M−1s−1 | R7 in Scheme 2 a |
| k8 | (1.9±0.3)×101 M−1s−1 | R8 in Scheme 2 a |
| k9 | (6.2±0.3)×100 M−1s−1 | R9 in Scheme 2 a |
| k10 | (6.0±0.3)×101 M−1s−1 | R10 in Scheme 2 a |
| k16 | (2.0±0.2)×100 s−1 | R16 in Scheme 2 a |
| ΔH‡ex | 31 ± 5 kJmol−1 | water exchange, MnIIIP |
| ΔS‡ex | −13 ± 20 Jmol−1K−1 | water exchange, MnIIIP |
| pKa1 | 10.71 ± 0.03 | 1st pK, MnIIIP |
| pKa2 | 11.7 ± 0.1 | 2nd pK, MnIIIP |
| pKa3 | 9.8 ± 0.1 | 1st pK, MnIIP |
| pKa4 | 11.7 ± 0.1 | 2nd pK, MnIIP |
| pKa5 | 10.98±0.06 | pK of hydroxyurea |
| pKa7 | 11.4±0.4 | 2nd pK, MnIIP-NO, defined in eqn (5) |
| εIdeprot | 85000 ± 2000 M−1cm−1 | defined in eqn (7) |
| εIIdeprot | 221000 ± 6000 M−1cm−1 | defined in eqn (7) |
| ε3 | 80700±500 M−1cm−1 | ε for MnIIIP a |
| ε4 | 85600±500 M−1cm−1 | ε MnIIIP–HU a |
| ε5 | 75000±500 M−1cm−1 | ε for MnIIP a |
| ε6 | 219600±300 M−1cm−1 | ε for MnIIP–NO a |
at pH = 11.70
The effect of the concentration of dissolved O2 was quantified. At constant initial concentrations of Mn(III)TTEG and HU, with HU in high excess. v0430nm reached a saturation value by increasing c0(O2) (Figure S9). Extrapolation to c0(O2) = 0 indicates a non-zero reaction rate, which is related to the fact that the reaction is followed through the absorbance of manganese porphyrin complexes, whose (oxidation) states and coordination environment change even in the absence of dissolved oxygen.
Kinetic model
The kinetic model proposed for the Mn(III)TTEG catalyzed autoxidation of HU is summarized in Scheme 2. A more visualized version of the mechanism is shown in Scheme 3. This model provides coherent mechanistic interpretation of the experimental observations in this system at pH = 11.70 and, as will be shown later, can also be used with some additions in the pH range 9–13. The overall reaction is initiated by the axial coordination of HU to Mn(III)TTEG (R1, R2). The reversible formation of this adduct is consistent with the noted feature of the initial rate (v0430nm) with increasing initial concentrations of either reactants. At pH 11.70, the substitution of the axially coordinated H2O/OH− with deprotonated HU is assumed, resulting in a MnIII–N(=O)– coordination.42 The approach to equilibrium between Mn(III)TTEG and Mn(III)TTEG–HU is assumed to be fast as the initial UV-vis spectrum of the reaction mixture recorded 0.10 s after mixing is dependent on the initial reactant concentrations. The fast exchange of the axially coordinated H2O in Mn(III)TTEG with Id mechanism also suggests that the substitution of H2O or OH− by a stronger binding ligand is similarly fast under basic conditions. After an electron transfer from HU to the Mn(III) center, the Mn(III)TTEG–HU adduct may dissociate into Mn(II)TTEG and HU• radical (R3). The HU• radical can be afterwards oxidized by O2 to NO and HNO (R9 and R10).40–41,49–50 The reactions of NO and HNO with Mn(II)/Mn(III) macrocyclic sytems have been described earlier.13–14 We propose that NO and HNO will eventually give Mn(II)TTEG–NO, the former reacting with Mn(II)TTEG (R6) and the latter with Mn(III)TTEG (R11).42,44 Similar findings are reported with strongly electron-accepting Fe porphyrins.55 Mn(II)TTEG–NO can alternatively be produced in the autoxidation of Mn(III)TTEG–HU (R4). As described previously,56–57 NO and HNO will rapidly react with each other (R13, R14) or with O2 (R12, R15) to give N2O and/or NO2−. The autoxidation of Mn(II)TTEG (R8) plays an important role: R8 replenishes Mn(III)TTEG, therefore, the overall course of the reaction Mn(III)TTEG + HU is closed into a catalytic cycle in which the autoxidation of HU is catalyzed by Mn(III)TTEG. The slow uncatalyzed autoxidation of HU yielding a HU• radical (R16) is also taken into account.
Scheme 2.

Proposed kinetic model for the reaction of Mn(III)TTEG with HU at pH 11.70. Mn(III)TTEG is abbreviated MnIIIP, and the intermediates consequently. The charges and the protonation states are not indicated in the symbolism. k: rate constants. ε: molar absorbances at 430 nm. (Underlined: detailed kinetics in earlier literature.42,44,56–57 Asterix: constants fixed during the fitting procedure.)
Scheme 3.

Proposed kinetic model for the reaction of Mn(III)TTEG with HU.
A global data fit58 using the kinetic model in Scheme 2 was performed with some rate constants and molar absorbances held fix: k6, k11, k12, k13, k14, k15 (literature values);42,44,56–57 k1, k16, ε3, ε5 (determined or approximated independently). 11 kinetic curves were fitted globally in the relative initial concentration range of Mn(III)TTEG : HU from 1 : 0.2 to 1 : 30 at pH 11.70. The depletion of the dissolved O2 during the reaction was taken into account. As seen in Figure 5, the results are satisfactory; the values of the rate constants and molar absorbances are listed in both Scheme 2 and Table 2.
Figure 5.
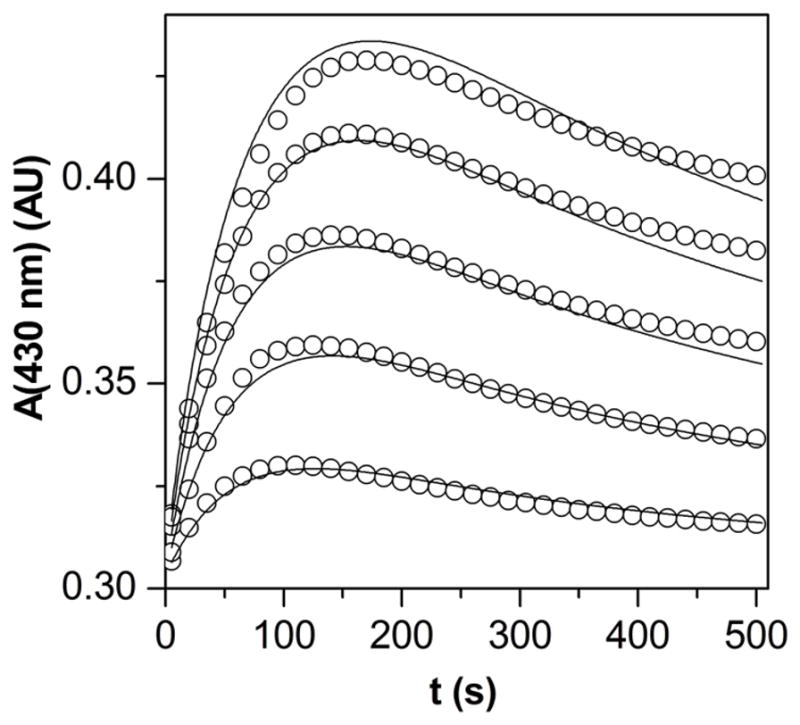
Representative experimental kinetic curves of the reaction of Mn(III)TTEG and HU (circles) and the corresponding simulation (lines) using the kinetic model from Scheme 2. (Only 10% of the experimental data points are shown.) c0(Mn(III)TTEG) = 3.75 μM, c0(HU) = from 0.76 μM to 5.71 μM, pH = 11.70, c0(O2) = 254 μM, I = 1.0 M, T = 25.0 °C.
The presence of an anaerobic mechanism for the formation of Mn(II)TTEG-NO may also be considered based on the non-zero reaction rate at c0(O2) ≈ 0. The anaerobic formation of NO and/or HNO from HU• were, however excluded from the detailed kinetic model because the corresponding reaction steps proved to be negligable during the global fitting procedure to the aerobic experiments. The significance of these pathways could be mapped by collecting concentration dependence data under anaerobic conditions by a method that is not only sensitive to the manganese porphyrin complexes.
Characteristics of the reaction system
The thermodynamic stability of the complexes Mn(III)TTEG–HU and Mn(II)TTEG–NO are high with apparent stability constants of k1/k2 = 1.2×10⁵ M−1 and k6/k5 = 1.1×10⁸ M−1, respectively. The value of the stability constant of Mn(III)TTEG–HU calculated from the results of the global fit is lower than that of determined by fitting the initial rates to eqn (2) (K0 = 4.1×10⁵ M−1). This contradiction can be resolved by considering reaction R8 which can be relevant in replenishing the concentration of Mn(III)TTEG even in the initial part of the catalytic cycle. Thus the stability constant measured by the initial rate method cannot be attributed to only one single equilibrium and the pre-equilibrium approximation overestimates the relevant equilibrium constant. Mn(III)TTEG–HU is consumed by two reactions, the electron transfer reaction R3 and the autoxidation R4. When c(O2) ≈ 2.5×10⁻⁴ M during the reaction, c(O2)×k7 ≈ 2.3×10⁻⁴ s−1 which is 2 orders of magnitude lower than k3. Because the autoxidation of the HU• radical formed in R3 is also fast, the ligand-to-metal electron transfer reaction R3 is assumed to be a major pathway for the catalytic oxidation of HU. Kinetic simulations show that the formation of HNO in the autoxidation of HU radical is faster than the formation of NO, although the accumulation of HNO cannot occur because of its fast subsequent autoxidation (R12) and dimerization (R14). Consequently, the majority of Mn(II)TTEG–NO is produced by the reaction of Mn(II)TTEG + NO (R6) and not in the reaction of Mn(III)TTEG + HNO (R11). Similar mechanistic conclusions were drawn in the study on the reactions of analogous Mn(III) porphyrins with NO- and HNO-donor reactants.42 The rate constants describing the two ways of oxidation of the HU radical with O2 (k9, k10) are determined indirectly in this study for the first time and seem to be reasonable compared to previous reports on the reactivity of HU radical.49–50,59–60
Another important feature of the reaction between Mn(III)TTEG and HU is that the concentration of the free NO remains low during the whole course of the process, because of the high thermodynamic stability of Mn(II)TTEG–NO. The photochemical release of the coordinated NO from Mn(II)–NO porphyrins analogous to Mn(II)TTEG–NO was investigated previously.61 Therefore, under intensive illumination (e.g. with the lamp of a diode-array photometer) the decreasing lifetime of the Mn(II)TTEG–NO intermediate of the reaction is not unexpected. The novelty of our measurements is that we were able to investigate the photoreaction in simple spectrophotometers using them simultaneously as photoreactors and detectors.51
pH dependence
The pH dependence of the reaction was studied in the range of pH from 9.1 to 12.7 at high excess of HU over Mn(III)TTEG (where v0430nm is independent of c0(HU)). Moving further down with the pH resulted in very small absolute change in the absorbance signals, which is extremely difficult to measure reliably. It is reasonable to assume that after the fast formation of the Mn(III)TTEG–HU adduct, only one pseudo-first order reaction takes place in the initial 10% of the overall process where the decomposition of the Mn(II)TTEG–NO intermediate is negligibly slow compared to its formation:
| (3) |
Quantitative comparison of the kinetic experiments recorded at different pH values is complicated without approximations because the absorbing reactants, and presumably the intermediates, have at least one pKa in the studied pH range. Proton exchange reactions between the corresponding acid–base pairs are presumably diffusion controlled and can be treated as fast pre-equilibria. The deprotonation of the axially coordinated water molecule of Mn(III)TTEG–HU and Mn(II)TTEG–NO can be described with the constants Ka6 and Ka7, respectively:
| (4) |
| (5) |
At a given pH, the kinetic traces were interpreted based on Rinit, considering eqn (3):
| (6) |
where εI and εII are the pH dependent molar absorbances at 430 nm of Mn(III)TTEG–HU and Mn(II)TTEG–NO, respectively, kobs is the pH dependent pseudo-first order rate constant and c0 is the initial Mn(III)TTEG concentration. Fitting the first 10% of the experimental kinetic curves to eqn (6) gives the values of εI, εII and kobs. The pH dependent values of these parameters are shown in Fig. 6. The pH dependencies of the molar absorbances, εI, εII, are given by eqn (7):
| (7) |
where εprot and εdeprot are the molar absorbances at 430 nm of the corresponding protonated and deprotonated species, respectively, and Ka is the deprotonation constant. kobs can be fitted to the following expression:
| (8) |
where k0Hobs, k1Hobs and k2Hobs are the rate constants for the 3 different possible protonation states of the initial reaction Rinit (deprotonated adduct and intermediate, protonated adduct or intermediate, protonated adduct and intermediate, respectively). As seen in Figure 6, simultaneous fitting of the 3 curves (εI, εII and kobs versus pH) to eqns (7) and (8) yields reasonably good results. The studied initial reaction is the fastest in the intermediate protonation state when only either Mn(III)TTEG–HU or Mn(II)TTEG–NO is protonated. The constants εIdeprot = 85000 ± 2000 M−1cm−1 and εIIdeprot = 221000 ± 6000 M−1cm−1 are in good agreement with ε4 and ε6, the calculated molar absorbances of Mn(III)TTEG–HU and Mn(II)TTEG–NO at pH = 11.70. Thus the global approach, utilized to deduce the detailed kinetic model at pH = 11.70, is consistent with the results of the pH dependence study. The deprotonation constant of the axially coordinated water molecules of Mn(III)TTEG–HU and Mn(II)TTEG–NO are calculated to be pKa6 < 9.0 and pKa7 = 11.4±0.4, respectively.
Figure 6.

Left panel: The pH dependence of the molar absorbances of Mn(III)TTEG–HU (triangles) and Mn(II)TTEG–NO (dots) in the initial part of the reaction of Mn(III)TTEG and HU in borate buffer and NaOH solutions. Right panel: The pH dependence of the pseudo-first order rate constant of the formation of Mn(II)TTEG–NO in the initial part of the reaction. Solid lines represent fitted results as discussed in the text. c0(Mn(III)TTEG) = 2.04 μM, c0(HU) = 15.3 μM, c(buffer) = from 0.80 mM to 7.5 mM, c0(O2) = 254 μM, I = 1.0 M T = 25.0 °C.
Therapeutical aspects
Based on the data presented here, the possibility of a synergic therapeutic effect of HU and Mn(III) porphyrins analogous to Mn(III)TTEG is not negligible because of the probable acceleration of the in vivo production62 of NO and/or HNO from HU. NO may signal tumor cells to proliferate, may promote angiogenesis, and can also reduce the activity of ribonucleotide reductase in tumor cells.63 HU is used in treating sickle cell disease, which is attributed to increased in vivo availability of NO and/or HNO.40–41 Because of the accelerated production of NO, water soluble Mn(III) porphyrins as co-drugs may enhance the effectiveness of HU against sickle cell anemia as well. During HU therapy, the increased in vivo concentrations of NO and NO2− may also increase the concentration of peroxynitrite ion (ONO2−) under the conditions of oxidative stress. Mn(III) porphyrins, as effective SOD mimics, decrease both the concentration of peroxynitrite ion and its rate of formation by depleting the superoxide ion (O2•−) concentration.
CONCLUSIONS
The detailed mechanism of the reaction between a synthetic SOD mimic Mn(III) porphyrin (MnTTEG-2-PyP5+) with N-hydroxyurea (HU) was studied in the range of pH from 9 to 12, it was shown that the catalytic autoxidation of HU to NO2− takes place during the process. Mn(III)TTEG acts as a catalyst and is intact at the end of the reaction. An adduct formation between Mn(III)TTEG and HU (Mn(III)TTEG–HU) is proposed to be the first step of the mechanism, and some of the subsequent steps include O2 as a reaction partner. The major intermediate is the nitric oxide complex {MnNO} of Mn(II)TTEG which is formed either by the direct autoxidation of Mn(III)TTEG–HU or by the reaction between Mn(II)TTEG and NO following a ligand-to-metal electron transfer in Mn(III)TTEG–HU. The thermodynamic stability of Mn(II)TTEG–NO is high, but it undergoes slow autoxidation after its formation. NO and HNO are produced as minor intermediates in the oxidation of HU. Applying the conclusions of Martí et. al.42 to the studied reaction, HU can be characterized as a NO-donor compound. The reaction of Mn(III)TTEG and HU can be regarded as a model reaction for the catalytic autoxidations of biologically active small molecular NO-donors.
Supplementary Material
Acknowledgments
The authors are grateful for Mónika Galajda for the ion chromatographic measurements. The authors thank the Croatian-Hungarian Joint Research Fund (TéT: Cro-11/2006); Hungarian Scientific Research Fund (OTKA: K68668 and T49044 (IN64289)); TAMOP 4.2.1./B-09/1/KONV-2010-007 and 4.2.2-08/12 CHEMIKUT; the Croatian Ministry of Science (MZOŠ: 006-0061247-0009) for their financial support. GVOP 1.2.3 0154/3 grant is also acknowledged for providing the IBB gradient probe head. I.B.H. is thankful to Duke University’s CTSA grant 1 UL 1 RR024128-01 from NCRR/NIH. G.L. and I.F. are grateful for the support by the Hungarian Academy of Sciences through the Research Group of Homogeneous Catalysis and Reaction Kinetics.
Footnotes
Supporting Information available. Results of UV-vis titrations, 17O-NMR and kinetic measurements. UV-vis and +ESI-MS spectral features of the reactants and intermediates. This material is free of charge via the Internet.
Abbreviations. N-hydroxyurea is denoted as HU and nitric oxide with its formula (NO). Mn(III) tetrakis(N-(1-(2-(2-(2-methoxyethoxy)ethoxy)ethyl)pyridinium-2-yl)porphyrin is commonly abbreviated as MnTTEG-2-PyP5+ (Scheme 1).10 In the text, we use Mn(III)TTEG to indicate the oxidation state of the central Mn but without indicating the charge of the complex ion. Thus Mn(II)TTEG (MnTTEG-2-PyP4+) is Mn(II) tetrakis(N-(1-(2-(2-(2-methoxyethoxy)ethoxy)ethyl)pyridinium-2-yl)porphyrin. If HU is axially coordinated to the metal center in Mn(III)TTEG, we use the symbol Mn(III)TTEG–HU. As an analogy, we use Mn(II)TTEG–NO to denote metal–NO link, i.e., the {MnNO} complex.44 The structures of the latter two porphyrin species are detailed in the Discussion
References
- 1.(a) Rajic Z, Tovmasyan A, Spasojevic I, Sheng H, Lu M, Gralla EB, Warner DS, Benov L, Batinić-Haberle I. Free Radic Biol Med. 2012 doi: 10.1016/j.freeradbiomed.2012.02.006. [DOI] [PMC free article] [PubMed] [Google Scholar]; (b) Miriyala S, Tovmasyan A, Spasojevic I, Salvemini D, Vujaskovic Z, St Clair DK, Batinić-Haberle I. Biochim Biophys Acta. 2012 doi: 10.1016/j.bbadis.2011.12.002. [DOI] [PMC free article] [PubMed] [Google Scholar]; (c) Jaramillo MC, Briehl MM, Crapo JD, Batinić-Haberle I, Tome ME. Free Radic Biol Med. 2012;52:1272–1284. doi: 10.1016/j.freeradbiomed.2012.02.001. [DOI] [PMC free article] [PubMed] [Google Scholar]; (d) Batinić-Haberle I, Rajic Z, Tovmasyan A, Reboucas JS, Ye X, Leong KW, Dewhirst MW, Vujaskovic Z, Benov L, Spasojevic I. Free Radic Biol Med. 2011;51:1035–1053. doi: 10.1016/j.freeradbiomed.2011.04.046. [DOI] [PMC free article] [PubMed] [Google Scholar]; (e) Aslan M, Ryan TM, Adler B, Townes TM, Parks DA, Thompson JA, Tousson A, Gladwin MT, Patel RP, Tarpey MM, Batinic-Haberle I, White CR, Freeman BA. Proc Nat Acad Sci USA. 2001;98:15215–15220. doi: 10.1073/pnas.221292098. [DOI] [PMC free article] [PubMed] [Google Scholar]
- 2.Spasojević I, Batinić-Haberle I. Inorg Chim Acta. 2001;317:230–242. [Google Scholar]
- 3.Batinić-Haberle I. Methods in Enz. 2002;349:223–233. doi: 10.1016/s0076-6879(02)49337-8. [DOI] [PubMed] [Google Scholar]
- 4.Batinić-Haberle I, Spasojević I, Hambright P, Fridovich I. J Chem Soc Dalton Trans. 2002;13:2689–2696. [Google Scholar]
- 5.Lahaye D, Muthukumaran K, Hung C-H, Gryko D, Rebouças JS, Spasojević I, Batinić-Haberle I, Lindsey JS. Bioorg Med Chem. 2007;15:7066–7086. doi: 10.1016/j.bmc.2007.07.015. [DOI] [PMC free article] [PubMed] [Google Scholar]
- 6.Rebouças JS, Spasojević I, Tjahjono DH, Richaud A, Méndez F, Benov L, Batinić-Haberle I. Dalton Trans. 2008;9:1233–1242. doi: 10.1039/b716517j. [DOI] [PubMed] [Google Scholar]
- 7.Batinić-Haberle I, Benov L, Spasojević I, Fridovich I. J Biol Chem. 1998;273:24521–24528. doi: 10.1074/jbc.273.38.24521. [DOI] [PubMed] [Google Scholar]
- 8.Batinić-Haberle I, Spasojević I, Hambright P, Benov L, Crumbliss AL, Fridovich I. Inorg Chem. 1999;38:4011–4022. [Google Scholar]
- 9.Batinić-Haberle I, Spasojević I, Stevens RD, Hambright P, Neta P, Okado-Matsumoto A, Fridovich I. Dalton Trans. 2004;11:1696–1702. doi: 10.1039/b400818a. [DOI] [PubMed] [Google Scholar]
- 10.Batinić-Haberle I, Spasojević I, Stevens RD, Bondurant B, Okado-Matsumoto A, Fridovich I, Vujaković Ž, Dewhirst MW. Dalton Trans. 2006;4:617–624. doi: 10.1039/b513761f. [DOI] [PubMed] [Google Scholar]
- 11.Ferrer-Sueta G, Vitturi D, Batinić-Haberle I, Fridovich I, Goldstein S, Czapski G, Radi R. J Biol Chem. 2003;278:27432–27438. doi: 10.1074/jbc.M213302200. [DOI] [PubMed] [Google Scholar]
- 12.Batinić-Haberle I, Rajić Z, Tovmasyan A, Rebouças JS, Ye X, Leong KW, Dewhirstć MW, Vujaskovi Z, Benov L, Spasojević I. Free Rad Biol Med. 2011;51:1035–1053. doi: 10.1016/j.freeradbiomed.2011.04.046. [DOI] [PMC free article] [PubMed] [Google Scholar]
- 13.Filipović MR, Duerr K, Mojović M, Simeunović V, Zimmermann R, Niketić V, Ivanović-Burmazović I. Angew Chem Int Ed. 2008;47:8735–8739. doi: 10.1002/anie.200801325. [DOI] [PubMed] [Google Scholar]
- 14.Filipović MR, Koh ACW, Arbault S, Niketić V, Debus A, Schleicher U, Bogdan C, Guille M, Lemaĭtre F, Amatore C, Ivanović-Burmazović I. Angew Chem Int Ed. 2010;49:4228–4232. doi: 10.1002/anie.200905936. [DOI] [PubMed] [Google Scholar]
- 15.Batinić-Haberle I, Rebouças JS, Spasojević I. Antioxid Redox Signal. 2010;13:877–918. doi: 10.1089/ars.2009.2876. [DOI] [PMC free article] [PubMed] [Google Scholar]
- 16.Spasojević I, Batinić-Haberle I. SOD mimics. In: Pantopoulos K, Schipper H, editors. Principles of Free Radical Biomedicine. Chapter 6 Hauppauge, N Y: Nove Science; [Google Scholar]
- 17.Ivanović-Burmazović I, Van Eldik R. Dalton Trans. 2008:5259–5275. doi: 10.1039/b805450a. [DOI] [PubMed] [Google Scholar]
- 18.Budimir A, Kalmár J, Fábián I, Lente G, Bányai I, Batinić-Haberle I, Biruš M. Dalton Trans. 2010;39:4405–4410. doi: 10.1039/b926522h. [DOI] [PubMed] [Google Scholar]
- 19.Lieb D, Zahl A, Shubina TE, Ivanović-Burmazović I. J Am Chem Soc. 2010;132:7282–7284. doi: 10.1021/ja1014585. [DOI] [PubMed] [Google Scholar]
- 20.Giovannetti R, Alibabaei L, Pucciarelli F. Inorg Chim Acta. 2010;363:1561–1567. [Google Scholar]
- 21.Abu-Omar MM. Dalton Trans. 2011;40:3435–3444. doi: 10.1039/c0dt01341b. [DOI] [PubMed] [Google Scholar]
- 22.Mahmoudi L, Mohajer D, Kissner R, Koppenol WH. Dalton Trans. 2011;40:8695–8700. doi: 10.1039/c1dt10689a. [DOI] [PubMed] [Google Scholar]
- 23.Piver MS, Barlow JJ, Vongtama V, Webster J. Am J Obstet Gynecol. 1974;120:969–972. doi: 10.1016/0002-9378(74)90347-0. [DOI] [PubMed] [Google Scholar]
- 24.Piver MS, Barlow JJ, Vongtama V, Blumenson L. Am J Obstet Gynecol. 1977;129:379–383. doi: 10.1016/0002-9378(77)90580-4. [DOI] [PubMed] [Google Scholar]
- 25.Boyd AS, Neldner KH. J Am Acad Dermatol. 1991;25:518–524. doi: 10.1016/0190-9622(91)70233-r. [DOI] [PubMed] [Google Scholar]
- 26.Burkitt MJ, Raafat A. Blood. 2006;107:2219–2222. doi: 10.1182/blood-2005-08-3429. [DOI] [PubMed] [Google Scholar]
- 27.Charache S, Terrin ML, Moore RD, Dover GJ, Barton FB, Eckert SV, McMahon RP, Bonds DR. N Engl J Med. 1995;332:1317–1322. doi: 10.1056/NEJM199505183322001. [DOI] [PubMed] [Google Scholar]
- 28.Charache S, Barton FB, Moore RD, Terrin ML, Steinberg MH, Dover GJ, Ballas SK, McMahon RP, Castro O, Orringer EP. Medicine. 1996;75:300–326. doi: 10.1097/00005792-199611000-00002. [DOI] [PubMed] [Google Scholar]
- 29.Ferguson RP, Arun A, Carter C, Walker SD, Castro O. Am J Hematol. 2002;70:326–330. doi: 10.1002/ajh.10184. [DOI] [PubMed] [Google Scholar]
- 30.Steinberg MH, Barton F, Castro O, Pegelow CH, Ballas SK, Kutlar A, Orringer E, Bellevue R, Olivieri N, Eckman J, Varma M, Ramirez G, Adler B, Smith W, Carlos T, Ataga K, DeCastro L, Bigelow C, Saunthararajah Y, Telfer M, Vichinsky E, Claster S, Shurin S, Bridges K, Waclawiw M, Bonds D, Terrin M. JAMA. 2003;289:1645–1651. doi: 10.1001/jama.289.13.1645. [DOI] [PubMed] [Google Scholar]
- 31.Bridges K, Barabino G, Brugnara C, Cho M, Christoph G, Dover G, Ewenstein B, Golan D, Guttmann C, Hofrichter J, Mulkern R, Zhang B, Eaton W. Blood. 1996;88:4701–4710. [PubMed] [Google Scholar]
- 32.Bundy R, Marczin N, Chester AH, Yacoub M. Am J Physiol Heart -Circ Physiol. 1999;277:H1799–1807. doi: 10.1152/ajpheart.1999.277.5.H1799. [DOI] [PubMed] [Google Scholar]
- 33.Glover RE, Ivy ED, Orringer EP, Maeda H, Mason RP. Mol Pharmacol. 1999;55:1006–1010. doi: 10.1124/mol.55.6.1006. [DOI] [PubMed] [Google Scholar]
- 34.Gladwin MT, Shelhamer JH, Ognibene FP, Pease-Fye ME, Nichols JS, Link B, Patel DB, Jankowski MA, Pannell LK, Schechter AN, Rodgers GP. Brit J Haematol. 2002;116:436–444. doi: 10.1046/j.1365-2141.2002.03274.x. [DOI] [PubMed] [Google Scholar]
- 35.Cokic VP, Smith RD, Beleslin-Cokic BB, Njoroge JM, Miller JL, Gladwin MT, Schechter AN. J Cliv Invest. 2003;111:231–239. doi: 10.1172/JCI16672. [DOI] [PMC free article] [PubMed] [Google Scholar]
- 36.Marmion CJ, Murphy T, Nolan T, Docherty KB., JR Chem Commun. 2000:1153–1154. [Google Scholar]
- 37.Rupon JW, Domingo SR, Smith SV, Gummadi BK, Shields H, Ballas SK, King SB, Kim-Shapiro DB. Biophys Chem. 2000;84:1–11. doi: 10.1016/s0301-4622(99)00132-5. [DOI] [PubMed] [Google Scholar]
- 38.Nahavandi M, Tavakkoli F, Millis RM, Wyche MQ, Habib MJ, Tavakoli N. Hematology. 2006;11:291–294. doi: 10.1080/10245330600921998. [DOI] [PubMed] [Google Scholar]
- 39.Huang J, Hadimani SB, Rupon JW, Ballas SK, Kim-Shapiro DB, King SB. Biochemistry. 2002;41:2466–2474. doi: 10.1021/bi011470o. [DOI] [PubMed] [Google Scholar]
- 40.King SB. Free Rad Biol Med. 2004;37:737–744. doi: 10.1016/j.freeradbiomed.2004.02.073. [DOI] [PubMed] [Google Scholar]
- 41.King SB. Curr Topics in Med Chem. 2005;5:665–673. doi: 10.2174/1568026054679362. [DOI] [PubMed] [Google Scholar]
- 42.Martí MA, Bari SE, Estrin DA, Doctorovich F. J Am Chem Soc. 2005;127:4680–4684. doi: 10.1021/ja044632n. [DOI] [PubMed] [Google Scholar]
- 43.Rebouças JS, Kos I, Vujasković Z, Batinić-Haberle I. J Pharm Biomed Anal. 2009;50:1088–1091. doi: 10.1016/j.jpba.2009.07.002. [DOI] [PMC free article] [PubMed] [Google Scholar]
- 44.Spasojević I, Batinić-Haberle I, Fridovich I. Nitric Oxide: Biol Chem. 2000;4:526–533. doi: 10.1006/niox.2000.0303. [DOI] [PubMed] [Google Scholar]
- 45.Weitner T, Budimir A, Kos I, Batinić-Haberle I, Biruš M. Dalton Trans. 2010;39:11568–11576. doi: 10.1039/c0dt00585a. [DOI] [PMC free article] [PubMed] [Google Scholar]
- 46.SCIENTIST, Version 2.0. Micromath Software; Salt Lake City, UT, USA: 1995. [Google Scholar]
- 47.Peintler G. ZITA 5.0., A comprehensiVe program package for fitting parameters of chemical reaction mechanisms, Version 3.1; Institute of Chemistry, JATE: Szeged, Hungary, 1999. The first use of this program was described: Peintler, G., Nagypal, I., Epstein, I. R. J Phys Chem. 1990;94:2954. [Google Scholar]
- 48.Hindmarsh AC. GEAR: Ordinary Differential Equation SolVer, ReV. 2. Lawrence Livermore Laboratory; 1972. [Google Scholar]
- 49.Gabričević M, Bešić E, Biruš M, Zahl A, Van Eldik R. J Inorg Biochem. 2006;100:1606–1613. doi: 10.1016/j.jinorgbio.2006.05.008. [DOI] [PubMed] [Google Scholar]
- 50.Budimir A, Bešić E, Biruš M. Croatica Chemica Acta. 2009;82:807–818. [Google Scholar]
- 51.Fábián I, Lente G. Pure Appl Chem. 2010;82:1957–1973. [Google Scholar]
- 52.Peintler G, Nagypál I, Jancsó A, Epstein IR, Kustin K. J Phys Chem A. 1997;101:8013–8020. [Google Scholar]
- 53.Peintler G, Nagypál I, Epstein IR, Kustin K. J Phys Chem A. 2002;106:3899–3904. [Google Scholar]
- 54.Bellér G, Bátki G, Lente G, Fábián I. J Coord Chem. 2010;63:2586–2597. [Google Scholar]
- 55.Pellegrino J, Hübner R, Doctorovich F, Kaim W. Chem Eur J. 2011;17:7868–7874. doi: 10.1002/chem.201003516. [DOI] [PubMed] [Google Scholar]
- 56.Miranda KM. Coord Chem Rev. 2005;249:433–455. [Google Scholar]
- 57.(a) Lewis RS, Deen WM. Chem Res Toxicol. 1994;7:568–574. doi: 10.1021/tx00040a013. [DOI] [PubMed] [Google Scholar]; (b) Galliker B, Kissner R, Nauser T, Koppenol WH. Chem Eur J. 2009;15:6161–6168. doi: 10.1002/chem.200801819. [DOI] [PubMed] [Google Scholar]
- 58.Kormányos B, Horváth AK, Peintler G, Nagypál I. J Phys Chem A. 2007;111:8104–8109. doi: 10.1021/jp072817l. [DOI] [PubMed] [Google Scholar]
- 59.Weitner T, Bešić E, Kos I, Gabričevič M, Biruš M. Tetrahedron Lett. 2007;48:9021–9024. [Google Scholar]
- 60.Gabričević M. Reac Kinet Mech Cat. 2012;105:223–232. [Google Scholar]
- 61.Zavarine IS, Kini AD, Morimoto BH, Kubiak CP. J Phys Chem B. 1998;102:7287–7292. [Google Scholar]
- 62.Horinouchi T, Nakagawa H, Suzuki T, Fukuhara K, Miyata N. Chem Eur J. 2011;17:4809–4813. doi: 10.1002/chem.201001967. [DOI] [PubMed] [Google Scholar]
- 63.Roy B, Guittet O, Beuneu C, Lemaire G, Lepoivre M. Free Rad Biol Med. 2004;36:507–516. doi: 10.1016/j.freeradbiomed.2003.11.028. [DOI] [PubMed] [Google Scholar]
Associated Data
This section collects any data citations, data availability statements, or supplementary materials included in this article.