Abstract
The need of cellular and sub-cellular spatial resolution in LDI / MALDI Imaging Mass Spectrometry (IMS) necessitates micron and sub-micron laser spot sizes at biologically relevant sensitivities, introducing significant challenges for MS technology. To this end we have developed a transmission geometry vacuum ion source that allows the laser beam to irradiate the back side of the sample. This arrangement obviates the mechanical / ion optic complications in the source by completely separating the optical lens and ion optic structures. We have experimentally demonstrated the viability of transmission geometry MALDI MS for imaging biological tissues and cells with sub-cellular spatial resolution. Furthermore, we demonstrate that in conjunction with new sample preparation protocols, the sensitivity of this instrument is sufficient to obtain molecular images at sub-micron spatial resolution.
Keywords: Imaging Mass Spectrometry, sub-cellular, sub-micron spatial resolution, transmission geometry, single cell imaging
Introduction
One of the most important aspects of any scanning imaging modality is the achievable spatial resolution. For MALDI IMS,[1] the spatial resolution employed in a given experiment is influenced by multiple factors including sample preparation, the method of matrix application, the laser beam spot size on the target, and the required sensitivity. Each of the factors should be optimized collectively in order to allow an investigator to obtain high spatial resolution images of single cells in culture and intact tissues, as well as access compositional differentiation of neighboring cells.
Some previous work has employed relatively large laser spots for imaging at the cellular level. A simple approach is a raster with overlapping laser spots, oversampling with complete sample ablation at each spot. [2–3] This enables the acquisition of data for images with a spatial resolution higher than the limitations imposed by the size of the laser beam spot. Although this approach has been successfully used by a number of laboratories, its disadvantages are that laser beam must ablate the entire spot before moving on to the next oversampling position and that the laser beam does not have sharp edges, that is, the matrix in the area around the ablation crater is altered by weak laser radiation. A second approach involves a special sample preparation procedure whereby a tissue attached to an elastic membrane is stretched over small glass beads and subsequently the isolated cells are analyzed.[4]
In the current paper, we present a new instrumental approach to achieve sub-cellular imaging by minimizing the laser spot size using a transmission laser geometry source and optimizing sample preparation protocols for matrix application. The requirement of micron and sub-micron laser spot sizes significantly impacts the size and configuration of the laser focusing optical system. In the past 20 years, significant progress has been made in laser direct write micromachining instrumentation, resulting in a new generation of UV lasers with high quality laser beams and low aberration microscope optics capable of being focused to a sub-micron diameter spot [5–6]. In the case of a high quality Gaussian laser beam focused by a diffraction-limited lens, the minimal laser spot size is mainly determined by the laser wavelength and the focusing convergence angle.[6] Practically, using commercially available optics, a 355 nm laser beam can be focused onto a target spot 0.6 μm in diameter, determined at the level of 1/e2 of the laser intensity at the center of the spot.[7] For near UV laser wavelengths (337–355 nm) routinely employed in most currently manufactured MALDI MS instruments, a focusing convergence angle of the lens of more than 60 degrees is needed to achieve less than a 1 μm diameter spot in vacuum (Figure 1A). In addition, to achieve low optical aberrations, there is a requirement to precisely manufacture and assemble the optical objective that contains multiple lenses or introduce aspherical lenses in the design, adding cost and complexity. The convergence angle of a small lens aperture restricts working distances of conventional refractive focusing optics to less than a few millimeters. Attempts at using reflective mirror focusing objectives, for example the Schwarzschild type objective, [8–10] is costly and has shown only limited applicability in industrial application for microprobe mass analyzers in 1970s–80s.[11–12]
Figure 1.
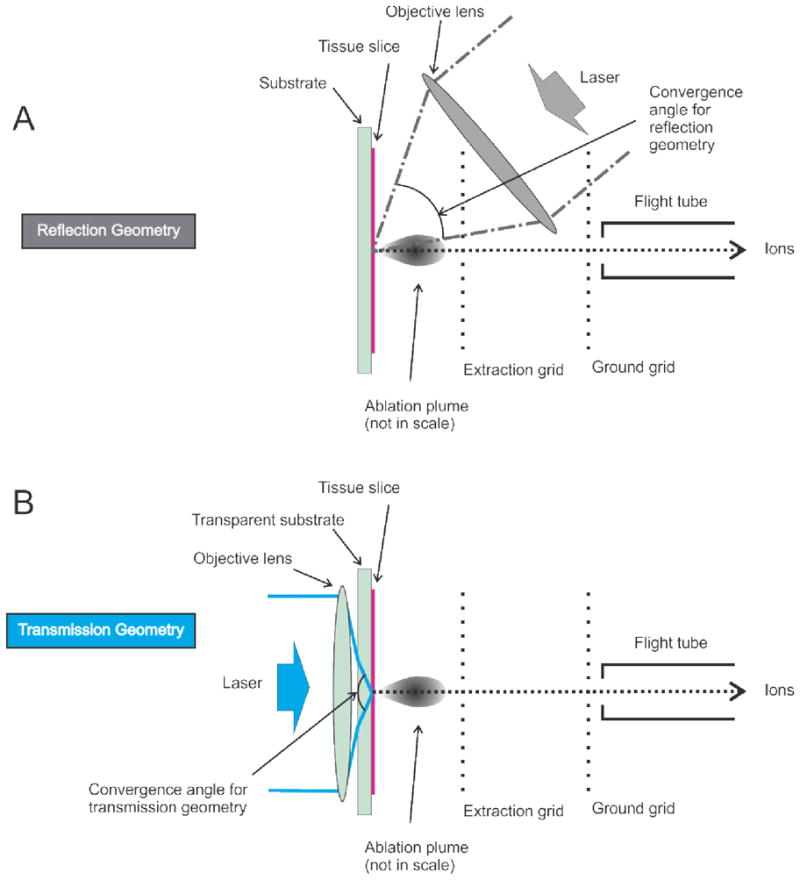
Simplified schemes for reflection (A) and transmission (B) geometry LDI and MALDI, demonstrating possibility for backside laser illumination in transmission geometry to achieve large laser focusing angle and therefore a submicron diameter laser spot for NUV laser wavelengths (B) as compared to conventional front side laser illumination in reflection geometry (A)
Currently, commercial MALDI sources focus the laser light on the front surface of the sample and the working distance of the objective determines the spacing between the sample surface and a focusing lens. This reflection geometry optics is illustrated in Figure 1A. For high power lenses, the gap, typically several millimeters, results in obstruction of the laser ablated material by the optics and interferes with the ion accelerating electric field. This significantly restricts ion collection and complicates the overall configuration of the ion source.
A transmission geometry ion source, illustrated in Figure 1B (i.e., allowing the laser beam to irradiate the backside of the sample) has been used previously in non-imaging applications.[11–13] This geometry is preferable for high spatial resolution IMS for several reasons. First, it obviates the mechanical / ion optic complications in the source by separating the optical lens from the point of ablation and the electrodes used for ion acceleration. Second, it provides an axial ablation path with respect to the MS analyzer. Third, it allows for an unobstructed front side that facilitates microscope and camera deployment. Fourth, it offers the opportunity for more effective target surface pre-coating and surface engineered structures (conductive, non-conductive, nano-patterned and near-field featured structures) for a second level chemical enhancement process for ablation and ionization.[14–16] Several recent reports have shown preliminary data for IMS in transmission geometry. [17–20]
While the ablation and ejection of materials using transmission geometry has been employed in some laser-based methods, the use of this geometry for MALDI IMS has not been effectively employed. The overall design and use of a transmission geometry source requires consideration of the laser parameters (spot size, energy/power, repetition rate) as well as the nature of the analyte/matrix layer (concentration, thickness, density, laser energy absorption, mechanical strength, and adherence to the substrate). In reflection geometry, the laser energy is absorbed by matrix placed on top of the sample, typically in high absorptive matrices that are 20–100 nm thick. For transmission geometry the laser must pass through the transparent slide (~ 1 mm) and the entire layer of sample, typically 3–5 μm. Depending on the experimental conditions used, various laser/matter interactions can occur in transmission irradiation.[21–22]
Laser ablation of absorbing films has been previously studied on transparent substrates using transmission geometry. When a highly absorbing layer, metallic silver films for example,[23] is impacted by a laser shot, the laser energy is efficiently converted into heat and shock waves. In the highly absorbing film, both ablation of the material and, spallation of larger particles can occur due to phase explosion.[24] The stress pulse created by a high energy pulsed laser (typically Nd:YAG or Nd:YLF) is usually around 3–8 ns in duration while its magnitude varies as a function of laser fluence. This general process is widely used in industry to transfer the soft material to another adjacent surface, termed Laser-Induced Forward Transfer (LIFT).[25] A similar process is used in Laser Capture Microdissection (LCM) techniques, termed laser pressure catapulting, and in some studies involving the ablation of material through deposition of energy onto surfaces with subsequent analysis by mass spectrometry. [26–27]
For application to MALDI MS where simultaneous desorption and ionization are required, laser pressure catapulting is not favored. However, under certain experimental conditions, a significant amount of the transferred/ catapulted material can be ionized, as in the case of the laser-induced acoustic desorption (LIAD) of molecules.[28–29]
When high laser energy is used, the laser ablation process leads to the release of species into the gas phase, some of which are ionic. For low irradiance values, the so-called laser desorption regime applies where the expelled species are mainly neutrals.[24] The high and low irradiance regimes could be implemented at the same laser energy, but at different laser spot sizes, an approach routinely used in laser capture micro-dissection for cutting and catapulting of material. At large spot sizes, as compared to sample thickness and rigidity, the laser energy density is low, causing a film/tissue lifting and forward transfer of predominantly neutral bulk parts of the analyte layer. At smaller laser spot sizes the laser energy density is significantly higher, causing a tissue perforation, ablation, and formation of a plume containing ionized molecules. This fact is exceptionally beneficial for high spatial resolution IMS at micron and sub-micron laser spot sizes.
To be able to perform high throughput MS imaging and to achieve higher sensitivity, we have developed a direct imaging method using MALDI MS and transmission geometry laser optics detailed in the current paper with preliminary results previously reported at scientific conferences.[17–19]
Materials and Methods
Materials
MALDI targets: 25×75×1.1 mm, Indium Tin Oxide (ITO) coated float glass slides (Delta Technologies, Loveland, CO), 1,5-Diaminonaphthalene (DAN) (Sigma-Aldrich), 2′,4′,6′-Trihydroxyacetophenone (THAP) (Sigma-Aldrich), Sinapinic acid (Sigma-Aldrich), Cresyl Violet (Sigma-Aldrich).
Single cells preparation: 10% Neutral Buffered Formalin (NBF) (Sigma-Aldrich), Ammonium Formate (Sigma-Aldrich), Chloroform, methanol (Sigma-Aldrich), Dulbecco’s Modified Eagle Medium (DMEM) (Gibco), McCoy Media (Gibco), 1x Phosphate Buffered Saline (PBS) (Gibco), Penicillin-Streptomycin (Gibco), Fetal Bovine Serum (FBS) (Atlas biologicals), Poly-l-lysine (Electron Microscopy Studies), 0.25% Tryspin-EDTA Dissociation Buffer (Gibco).
Transmission Geometry Instrument
A modified Applied Biosystems 4700 MALDI TOF/TOF instrument was used as a test bed instrument for the transmission geometry setup. This instrument was converted to a simple linear TOF with a flight tube length of 980 mm utilizing the original MCP detector. An accelerating voltage of 20 kV was used for all experiments. A calibration standard consisting of 4 components: Reserpin (m/z 609.68), Angiotensin II (m/z 1047.18), Melanocyte Stimulating Hormone (m/z 1647.85), and ACTH clip 18–39 (m/z 2466.72) was employed. A laser spot size of 1 μm on target was used for all experiments except where noted.
For the laser optics transmission geometry setup, a custom designed vacuum compatible inverted optical/laser microscope with z-axis parallel to the z-axis of a mass-spectrometer was used to focus a laser beam at the slide/tissue interface first passing through the slide, as shown in the bottom panel of Figure 1B.
To incorporate the inverted microscope, the instrument source was modified as follows (Figure 2). A 25 mm diameter viewport with a quartz window on the back wall of the sample chamber was installed and an opening was cut in the original dual-axis XY translation stage base to provide for laser beam delivery and optical inverted microscope function. The sample holder was modified with a 4-rod supported plate, made of PEEK material, to fit a holder with a microscope objective on the back of the sample holder. The objective used was a Mitutoyo ULWD 100X/0.50, having 70% transmission at 355 nm laser wavelength and potentially allowing focusing of the laser to a 1 μm diameter spot. The objective body was connected to the front sample plate with a spring wire to keep the objective at the source potential (20 kV). The objective was mounted on a PEEK arm to provide isolation from the ground potential and the arm was mounted on a translation stage to move the objective along the optical axis (z-axis) to position the objective focal plane. All residual optical elements were located outside the vacuum chamber on a vibration isolation optical table.
Figure 2.
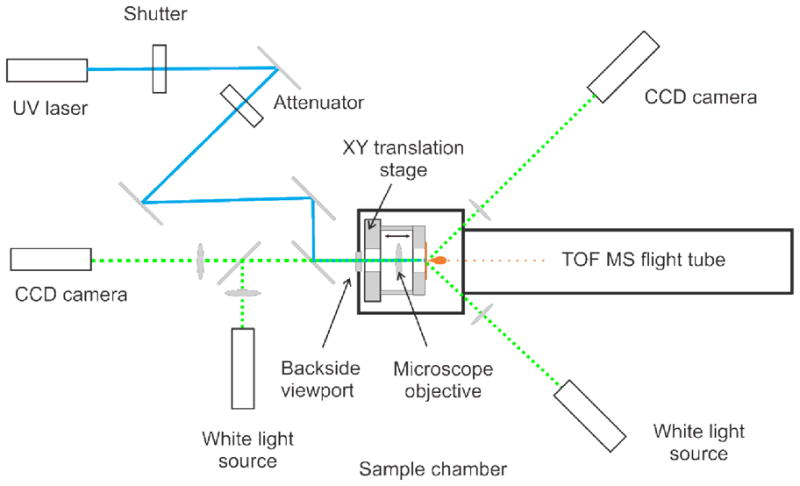
Scheme of the optical path in a modified AB 4700 MALDI TOF instrument. The laser beam propagates through the backside viewport of the sample chamber and is focused on the back side of the sample
Optical encoders inside the dual-axis XY translation stage were replaced with 0.1 μm resolution linear optical encoders (Renishaw). The limit switches of the stage and instrument control software were modified to incorporate a higher precision and the larger sample holder.
The optical path in the transition geometry scheme outside the source vacuum chamber comprised the laser beam passing to the back side of the sample chamber, guided by several mirrors, and an optical imaging path. The last mirror was a dichroic mirror, reflecting at laser wavelength (349–355nm), but allowing for observing an optical image through it. The laser beam path included also a photo shutter (Uniblitz), having sufficient speed to select a single laser shot at repetition rate 100 Hz, and variable attenuator (the original attenuator from the instrument).
Imaging Methods
Tissue MS images were acquired using image acquisition software for the 4000 Series instrumentation (M. Stoeckli, Novartis & Applied Biosystems), typically with 1–2 μm pitch raster in a typewriter scan mode and 1 μm laser spot size. For a few experiments, the pitch was reduced to 0.5 μm, as so noted in the text. Single cell MS images were acquired with a 1.5 μm raster and a 1 μm laser spot size.
The Bruker Autoflex Speed LIN (Bruker Daltonics) was used to acquire imaging data for the validation of the transmission geometry data quality. The laser spot size in the Autoflex was set to “minimum” in the flexControl software, and the minimal laser power that still produced high quality spectra was used. The image was acquired with a 5 μm raster and a 5 μm laser spot size.
Ion images were processed using BioMap (MSImaging, Novartis). Single spectra, exported from the BioMap or independently acquired, were processed using Data Explorer (Applied Biosystems) and mMass.[30]
Optical microscope images were captured both before and after the MS imaging experiment. Tissue images were taken using a Nikon Eclipse 90i microscope in Differential Interference Contrast (DIC) mode. The standard reticle images were taken by the same microscope in bright field and fluorescence modes. Cell images were taken using an Olympus BX-50 microscope in bright field mode.
Identification of compounds for single cells
For single cells, lipid identification was performed with a homogenized cell extract from 2 × 10⁷ cells collected into 1 mL of media and extraction of lipids using the Bligh Dyer method [31]. Briefly, to 1 mL of cell suspension, 3.75 mL of chloroform:methanol (1:2) was added and subsequently vortexed. After vortexing, 1.25 mL of chloroform was added and again vortexed. Finally, 1.25 mL of water was added and again vortexed before centrifugation. The lipid extract was collected into an eppendorf tube and dried via vacuum. The dried lipid extract was resuspended in 20 μL of 90% methanol for subsequent analysis. Lipid identifications were made using accurate mass measurements acquired with a 9.4 T Bruker Solarix MALDI FT-ICR MS and these values searched using LIPID MAPS.[32]
Tissue Sample Preparation
Mouse brain sections were cut at 5 μm thickness, experimentally determined previously as an optimal thickness for transmission geometry experiments. The sections were thaw mounted on untreated ITO glass slides, and left to dryness in a vacuum desiccator for 4 hours. To produce a highly uniform matrix coating, essential for achieving high spatial resolution, the mounted section was sublimated [33] with DAN matrix material [34] at 0.15–0.20mg/cm2 under 60 mTorr at 130°C for 7 min. The coated section was treated with vapor of chloroform and methanol (3:1). Briefly, the slide with DAN coated section was attached to a stainless steel plate and the plate was fixed on the top part of a petri dish (100 mm diameter × 15 mm deep, Fisher, 3160101) with a heat conductive copper tape (Electron Microscopy Sciences, 77801) and left in the 85°C oven for 2 min. Next, 30 μL of chloroform and methanol (3:1) was pipetted on a piece of filter paper located on the bottom of the petri dish. The top and bottom of the petri dish were sealed together with tape (Fisher, 35901R) and the petri dish was left at 85°C for 2 minutes. The slide then was taken out to dry and stored in vacuum desiccator to avoid oxidation.
Cell Sample Preparation
A common phenomenon in transmission laser ablation is the catapulting effect, whereby cells are ejected from the target through the transfer of energy from the laser ablation process. To eliminate this we improved adherence of the cells to the substrate using poly-l-lysine modified ITO slides and formalin to affix the cells to the slide. ITO slides were first modified with poly-l-lysine [35] using the method provided by Electron Microscopy Studies.[36] Briefly, slides were cleaned by sonication in ethanol for 10 minutes, followed by acetone for 10 minutes, and ethanol again for 10 minutes. Slides were subsequently placed in a Coplin jar containing a 1:10 dilution of poly-l-lysine for 5 minutes. Slides were removed from the poly-l-lysine and placed into a slide box where they dried overnight, and then were used during the next day.
For single cell studies, RKO and Human Embryonic Kidney 293 (HEK-293) cells were used. RKO cells were grown in McCoy’s media and HEK-293 grown in DMEM. All media was supplemented with 10% FBS and 1% penicillin streptomycin. Cells were pulled from cryopreservation and placed in their respective media for 24 hours after which the media was removed and changed to fresh media. The cells were allowed to grow to confluence before they were split 1:10 for RKO and 1:3 for HEK-293. After two passages, the cells were ready for study.
One flask of each cell type was drained of media followed by the addition of 3 mL of dissociation reagent. For RKO cells, the dissociation reagent was removed after 15–30 seconds and media was washed over the cells for collection. For HEK-293 cells, media was added to the dissociation reagent in order to collect the cells. Cells were counted using a BioRad TC-10 automatic cell counter, and approximately 106 cells were placed into a petri dish with a poly-l-lysine modified slide. Slides were placed into a cell incubator overnight at 37°C with 5% CO2. Media was removed via suction and the cells were washed twice with 1x PBS. Immediately following the wash, 10% NBF was placed over the surface of the slides for 10 minutes. The slides were then removed and washed twice with 50 mM ammonium formate and twice with Millipore water. The slides were placed in new petri dishes and were moved to a dark area to dry.
The slides were stained using 0.5% cresyl violet for 30 seconds and washed with Millipore water. THAP matrix in 90% methanol 0.3%TFA was applied to the slides using a TM-Sprayer (HTX Technologies, Inc).
Results and Discussions
Spatial Resolution Validation
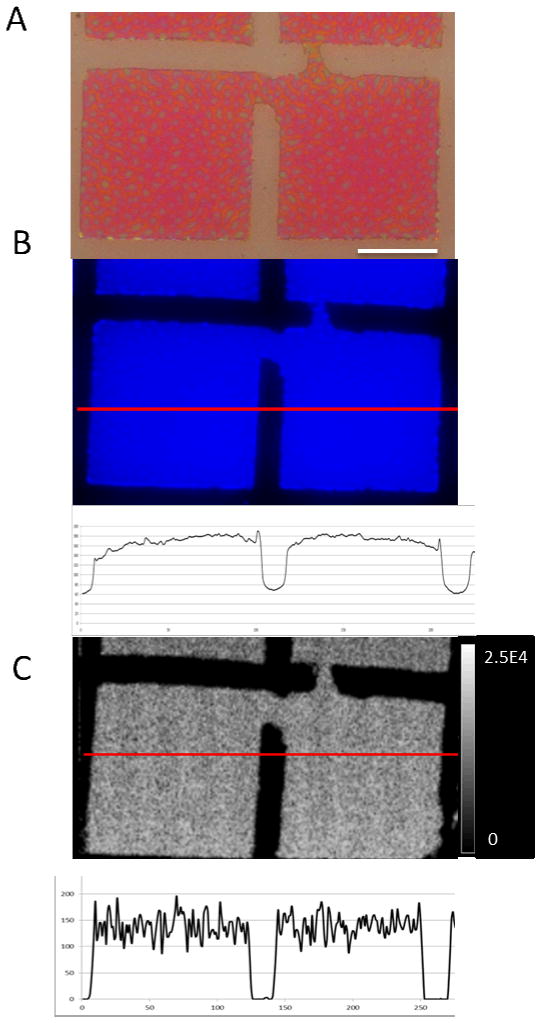
A thin film reticle containing a film of the dye rubrene was used to validate the spatial resolution.[37–38] The m/z 532 signal for rubrene in positive mode was used to generate ion images that were acquired at 1 μm raster pitch and compared with optical and DAPI microscope images (Figure 3). The comparison shows surface features (including minor surface imperfections) and edge profiles of the reticle squares reproduced correctly at 1 μm step size spatial resolution.
Figure 3.
Validation by imaging a patterned film reticle. A – optical bright field image (the scale bar seen is 50 μm), B – fluorescence image (with image intensity profile below the image), C -ion image from the AB4700 of m/z 532 ion of rubrene (with image intensity below the image). Arrows show direction and location of the profiles. Note: the defect seen in the images was used as a point of reference when dealing with both images and corresponding profiles
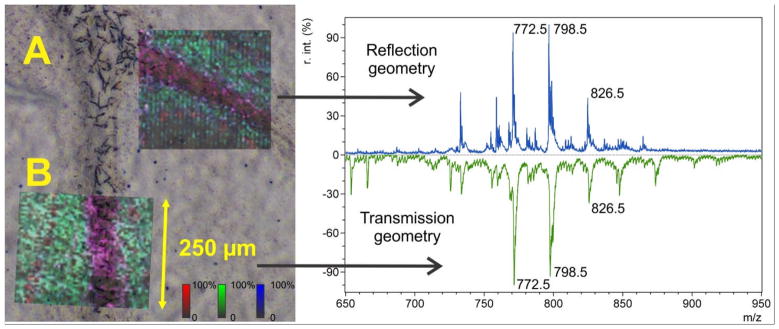
The transmission geometry MALDI technology was compared with a commercial linear MALDI TOF instrument (Bruker Daltonics Autoflex Speed LIN) working in reflection geometry. The laser raster was conducted at 5 μm pitch, the minimal pitch obtainable for this instrument. The laser spot size for the transmission geometry instrument was increased from 1 μm up to 5 μm by defocusing the laser beam with an additional lens, inserted before the dichroic mirror. Figure 4 shows a comparison of spectra from the m/z range for lipids from adjacent areas of the same section of mouse cerebellum. The MS images (Figure 4, A and B) are an RGB color mix of 3 MS images: m/z 772.5 – green, m/z 798.5 – blue, and m/z 826.5 – red. The MS images are overlaid with an optical microscope DIC image to show the correlation of the MS image features with tissue anatomical features. The overall comparison of the mass spectra and MS images demonstrates that the transmission geometry MALDI mass spectrometer has comparable sensitivity as commercial MALDI imaging mass spectrometers.
Figure 4. Validation of transmission geometry method by comparison with standard instrument.
MALDI TOF MS lipid images of a mouse cerebellum area. Each MS image is an RGB color mix of 3 MS images (m/z 772.5 – green, m/z 798.5 – blue, and m/z 826.5 – red), overlaid with optical microscope DIC image.
A – MS image acquired in reflection geometry using Bruker AutoFlex Speed LIN linear instrument at 5 μm raster pitch, B – MS image acquired in transmission geometry using modified AB 4700 linear instrument at the same (5 μm) raster pitch. Corresponding spectra are shown in the right panel.
As in the LIFT or LCM experiments, in transmission geometry a profile of absorbed laser energy across the analyte-matrix layer cross-section plays substantial role. For the successful application of transmission geometry to IMS, several aspects of this profile have to be considered. First, it is possible that when laser radiation hits an interface layer where the tissue is attached to the transparent substrate, material detachment and subsequent loss due to laser heating and catapulting can occur. Our preliminary experiments show that although this is a problem for films having loose structure and low adherence to the substrate (e.g. drop cast films on hydrophobic surfaces), we found that with tissue samples this effect was not observed. Second, in highly absorptive analyte films, the plume produced by the laser ablation occurs within confined boundary conditions inside the analyte film and the confined plume conditions can significantly reduce the molecular mean free path inside the plume, decreasing the probability of generating primary ionized molecules following ablation.[24, 39–40] On the other hand, the denser plume produced in transmission geometry may induce laser stimulated desolvation or chemistry in the plume, leading to enhanced secondary ionization.[40] Neutralization of the primary ions can be minimized by using sufficiently high laser intensity such that the analyte film is perforated by the first laser shot. When the amount of material permits, several laser shots can be implemented at the same spot to improve signal-to-noise.
Tissue lipid imaging
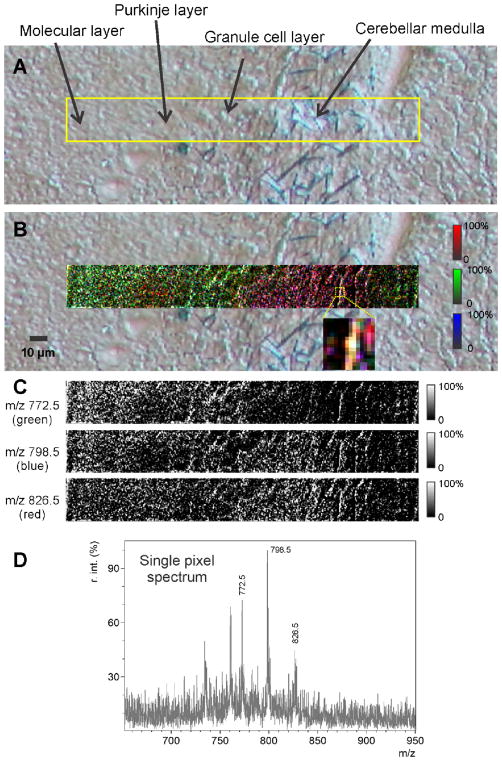
For MALDI MS studies of molecules below 1000 Da such as lipids, sub-cellular capabilities of the transmission geometry MS were evaluated by tissue imaging with sub-micron spatial resolution. Figure 5 shows an MS image of a section of mouse brain cerebellum taken with 0.5 μm raster pitch and overlaid on an optical microscope DIC image for reference. The MS image shows subcellular features of several areas in the cerebellar structure (listed from left to the right), the molecular layer (a region relatively free of neuronal somata), the Purkinje cell layer, a granule cell layer (somata of the cells whose axons form the bulk of the molecular layer), and the cerebellar medulla (axonal processes of the Purkinje cells pass through the granule cell layer and become bundled together into fiber tracts; broken fibers are seen in the optical images). The MS image shows that m/z 772.5 is most abundant in the granule cell layer (shown in green in Figure 5). Through ultra-high resolution measurements this ion was identified as the K+ adduct of PC 32:0 (Table 1 in Supplemental materials). This is in agreement with other IMS studies of mouse brain at lower spatial resolution,[41] where this ion was identified as the K+ adduct of phosphatidylcholine lipids PC (16:0a/16:0). The axonal bundle has a relatively large amount of m/z 798.5 (shown in blue), likely as a part of a myelination of the fibers. This ion is highly abundant in mouse brain analyzed by positive mode MALDI [41–42] and has been identified as the K+ adduct of PC (16:0/18:1). The Purkinje cells show m/z 826.5 to be abundant in their somata and axons (shown in red). The m/z 826.5 ions in mouse cerebellum has been previously identified as PC 36:1 (K+).[42]
Figure 5.
A – Optical microscope DIC image of a mouse cerebellum original tissue. Yellow rectangle – area of the MS image. B - MALDI TOF MS lipid image at 500 nm raster by 1 μm laser beam. Image is overlaid with optical microscope DIC image. MS image is an RGB mix of 3 MS images: m/z 772.5 – green, m/z 798.5 – blue, and m/z 826.5 – red, shown separately in panel C. D - mass spectrum, acquired from a single pixel, where all 3 imaged ions are present
Tissue protein profiling
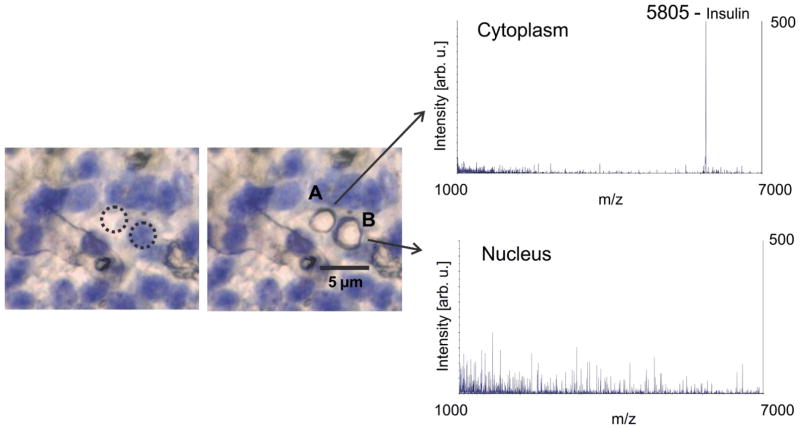
The sub-cellular imaging capabilities of the transmission geometry MALDI MS for small proteins were demonstrated for tissue profiling in a “point-and-shoot” mode of operation. Figure 6 shows human pancreas islet cells, having an average diameter of 10 μm,[43] stained with Cresyl Violet [44] and spotted with 0.1 μL of sinapinic acid solution on top of the tissue. Bright field photomicrographs showed the cytoplasm as light areas and stained nuclei dark blue/violet areas. Both these areas were independently ablated with the focused laser beam in a point-and-shoot mode and mass spectra were accumulated from 30 laser shots at each spot. As expected, the protein insulin (m/z 5805) was observed in the cytoplasm but not in the nucleus. This demonstrates that the transmission geometry optics can direct the laser to hit a pre-determined spot on a cell to within ± 2 μm, and coherent protein MS signal can be obtained from sub-cellular locations by transmission geometry.
Figure 6.
IMS profiling of proteins with sub-cellular resolution of human pancreas islet cells. Left – pancreatic tissue islet cells with nuclear stain. Right – stained image of the same tissue area following laser ablation with the mass spectrum shown for each spot. The spectrum from the cytoplasm shows signal for insulin, as expected
Single cell lipids imaging
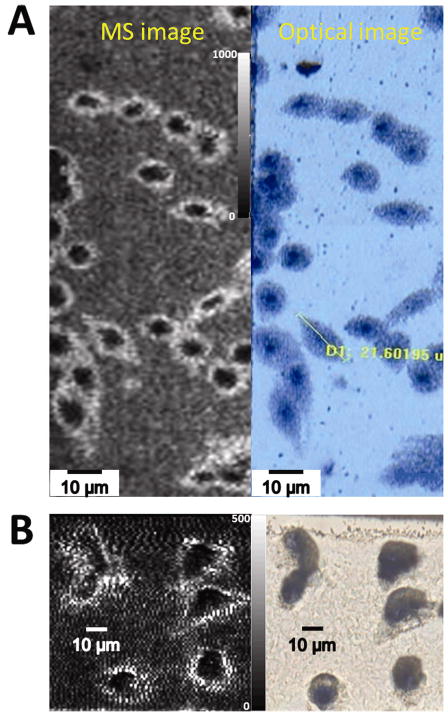
Figure 7A shows an ion image of the signal at m/z 782 (left) and an optical image (right) of the same area after imaging for HEK-293 cells. The cells can be clearly seen in the images both before and after IMS analysis. Figure 7B shows an image of the signal at m/z 782 (left) in RKO cells with its corresponding optical image (right).
Figure 7.
A - MS image of m/z 782 from HEK-293 cells (left) and bright field optical image (right) of the ablated area after MS imaging. Note that cells are retained on the target after imaging. The intensity scale is from 0 to 1000 counts. B - MS image of m/z 782 from RKO cells (left) and bright field optical image (right). The intensity scale is from 0 to 500 counts
In order to validate spectra attained from images of single cells, cell extracts were analyzed in the same way and spectra compared to those from single cells. For these experiments, 25 laser shots were fired at one location and the spectra averaged. Based on the number of cells which were homogenized and the droplet area and volume, it was calculated that there are approximately 1.25 cells in one ablation area for the extract. The Supplemental information section shows mass spectra of the cell extract and single cells for HEK-293 (Figure 1S) and RKO cells (Figure 2S). The same cell extracts were used to generate accurate mass identifications using the MALDI FT-ICR MS and LIPID MAPS. These identifications are listed in Supplemental Table 1S.
Conclusions
Using a transmission geometry configuration, the laser beam in the ion source of a MALDI mass spectrometer can be focused to dimensions less than 1 μm, making possible the direct imaging of heterogeneous tissue sections and single cells with subcellular resolution. Sub-cellular MS images were validated by co-registration of images obtained by microscopic methods, e.g. optical phase contrast, DIC, and bright field. Mass spectra acquired in transmission geometry compared well with mass spectra acquired in reflection geometry by standard commercial instruments.
Acknowledgments
The authors would like to thank Marvin L. Vestal and Kevin Hayden (SimulTOF Systems, former Virgin Instruments) for the help with AB 4700 instrument functionality, Markus Stoeckli (Novartis) for extensive help with imaging software tool for the AB 4700 instrument, Jeff Spraggins for help with accurate MALDI FT-ICR MS measurements.
Simona Codreanu, Sheryl Handley, and Daniel Liebler are thanked for their assistance and resources in cell growth.
This project was supported by grants from the National Institute of General Medical Sciences (8 P41 GM103391-02 (formerly NCRR 5P41RR031461-02) and 5R01 GM058008-13) from the National Institutes of Health and the Department of Defense W81XWH-05-1-0179. A fellowship from Aegis Sciences Corporation also supported this work.
References
- 1.Caprioli RM, Farmer TB, Gile J. Molecular imaging of biological samples: localization of peptides and proteins using MALDI-TOF MS. Anal Chem. 1997;69:4751–4760. doi: 10.1021/ac970888i. [DOI] [PubMed] [Google Scholar]
- 2.Jurchen JC, Rubakhin SS, Sweedler JV. MALDI-MS Imaging of Features Smaller than the Size of the Laser Beam. Journal of the American Society for Mass Spectrometry. 2005;16:1654–1659. doi: 10.1016/j.jasms.2005.06.006. [DOI] [PubMed] [Google Scholar]
- 3.Bouschen W, Spengler B. Artifacts of MALDI sample preparation investigated by high-resolution scanning microprobe matrix-assisted laser desorption/ionization (SMALDI) imaging mass spectrometry. International Journal of Mass Spectrometry. 2007;266:129–137. [Google Scholar]
- 4.Tucker KR, Lanni EJ, Serebryannyy LA, Rubakhin SS, Sweedler JV. Stretched Tissue Mounting for MALDI Mass Spectrometry Imaging. Analytical Chemistry. 2011;83:9181–9185. doi: 10.1021/ac201857k. [DOI] [PMC free article] [PubMed] [Google Scholar]
- 5.Perriere J. Recent Advances In Laser Processing of Materials. Elsevier; 2006. p. 472. [Google Scholar]
- 6.So PTC. Handbook of biomedical nonlinear optical microscopy. Oxford University Press; Toronto: 2008. p. 860. [Google Scholar]
- 7.Siegman AE. Lasers. University Science Books; Mill Valley, Calif: 1986. p. 1283. [Google Scholar]
- 8.Vaeck LV, Struyf H, Roy WV, Adams F. Organic and inorganic analysis with laser microprobe mass spectrometry. Part I: Instrumentation and methodology. Mass Spectrometry Reviews. 1994;13:189–208. [Google Scholar]
- 9.Behm JM, Hemminger JC, Lykke KR. Microscopic Laser Desorption/Postionization Fourier Transform Mass Spectrometry. Analytical Chemistry. 1996;68:713–719. doi: 10.1021/ac9510999. [DOI] [PubMed] [Google Scholar]
- 10.Vaeck LV, Struyf H, Roy WV, Adams F. Organic and inorganic analysis with laser microprobe mass spectrometry. Part II: Applications. Mass Spectrometry Reviews. 1994;13:209–232. [Google Scholar]
- 11.Dingle T, Griffiths BW, Ruckman JC. LIMA-a laser induced ion mass analyser. Vacuum. 1981;31:571–577. [Google Scholar]
- 12.Vogt H, Heinen HJ, Meier S, Wechsung R. LAMMA 500 principle and technical description of the instrument. Fresenius’ Journal of Analytical Chemistry. 1981;308:195–200. [Google Scholar]
- 13.Vertes A, Balazs L, Gijbels R. Matrix-assisted Laser Desorption of Peptides in Transmission Geometry. Rapid Communications in Masss Spectrometry. 1990;4:263–266. [Google Scholar]
- 14.Manier M, Reyzer M, Goh A, Dartois V, Via L, Barry C, Caprioli R. Reagent Precoated Targets for Rapid In-Tissue Derivatization of the Anti-Tuberculosis Drug Isoniazid Followed by MALDI Imaging Mass Spectrometry. Journal of the American Society for Mass Spectrometry. 2011;22:1409–1419. doi: 10.1007/s13361-011-0150-8. [DOI] [PMC free article] [PubMed] [Google Scholar]
- 15.Chen Y, Vertes A. Adjustable Fragmentation in Laser Desorption/Ionization from Laser-Induced Silicon Microcolumn Arrays. Analytical Chemistry. 2006;78:5835–5844. doi: 10.1021/ac060405n. [DOI] [PubMed] [Google Scholar]
- 16.Stolee JA, Walker BN, Zorba V, Russo RE, Vertes A. Laser-nanostructure interactions for ion production. Physical Chemistry Chemical Physics. 2012;14:8453–8471. doi: 10.1039/c2cp00038e. [DOI] [PubMed] [Google Scholar]
- 17.Zavalin AI, Caprioli RM. Transmission Geometry Profiling / Imaging Mass Spectrometry with Sub-Cellular Resolution. 58th ASMS Conference on Mass Spectrometry and Allied Topics; Salt Lake City, UT. 2010. [Google Scholar]
- 18.Zavalin AI, Caprioli RM. Transmission Geometry “Point-and-shoot” Profiling and Automatic Sub-Cellular Imaging Mass Spectrometry with 1 μm Spatial Resolution. 59th ASMS Conference on Mass Spectrometry and Allied Topics; Denver, CO. 2011. [Google Scholar]
- 19.Zavalin A, Yang J, Caprioli RM. Tissue Imaging at Submicron Spatial Resolution Using Direct Transmission Geometry MALDI MS. 60th ASMS Conference on Mass Spectrometry and Allied Topics; Vancouver, BC, Canada. 2012. [Google Scholar]
- 20.Richards AL, Lietz CB, Wager-Miller JB, Mackie K, Trimpin S. Imaging mass spectrometry in transmission geometry. Rapid Communications in Mass Spectrometry. 2011;25:815–820. doi: 10.1002/rcm.4927. [DOI] [PMC free article] [PubMed] [Google Scholar]
- 21.Ehring H, Costa C, Demirev PA, Sundqvist BUR. Photochemical Versus Thermal Mechanisms in Matrix-assisted Laser Desorption/Ionization Probed by Back Side Desorption. Rapid Communications in Mass Spectrometry. 1996;10:821–824. [Google Scholar]
- 22.Schurenberg M, Schulz T, Dreisewerd K, Hillenkamp F. Matrix-assisted Laser Desorption/Ionization in Transmission Geometry: Instrumental Implementation and Mechanistic Implications. Rapid Communications in Mass Spectrometry. 1996;10:1873–1880. [Google Scholar]
- 23.Lai EPC, Owega S, Kulczycki R. Time-of-flight mass spectrometry of bioorganic molecules by laser ablation of silver thin film substrates and particles. Journal of Mass Spectrometry. 1998;33:554–564. [Google Scholar]
- 24.Knochenmuss R. Ion formation mechanisms in UV-MALDI. The Analyst. 2006;131:966–986. doi: 10.1039/b605646f. [DOI] [PubMed] [Google Scholar]
- 25.Georgiou S, Koubenakis A. Laser-Induced Material Ejection from Model Molecular Solids and Liquids: Mechanisms, Implications, and Applications. Chemical Reviews. 2003;103:349–394. doi: 10.1021/cr010429o. [DOI] [PubMed] [Google Scholar]
- 26.Xu BJ, Caprioli RM, Sanders ME, Jensen RA. Direct analysis of laser capture microdissected cells by MALDI mass spectrometry. Journal of the American Society for Mass Spectrometry. 2002;13:1292–1297. doi: 10.1016/S1044-0305(02)00644-X. [DOI] [PubMed] [Google Scholar]
- 27.McEwen CN, Pagnotti VS, Inutan ED, Trimpin S. New Paradigm in Ionization: Multiply Charged Ion Formation from a Solid Matrix without a Laser or Voltage. Analytical Chemistry. 2010;82:9164–9168. doi: 10.1021/ac102339y. [DOI] [PubMed] [Google Scholar]
- 28.Aubriet F. Laser-induced Fourier transform ion cyclotron resonance mass spectrometry of organic and inorganic compounds: methodologies and applications. Analytical and Bioanalytical Chemistry. 2007;389:1381–1396. doi: 10.1007/s00216-007-1491-9. [DOI] [PubMed] [Google Scholar]
- 29.Zinovev AV, Veryovkin IV, Moore JF, Pellin MJ. Laser-Driven Acoustic Desorption of Organic Molecules from Back-Irradiated Solid Foils. Analytical Chemistry. 2007;79:8232–8241. doi: 10.1021/ac070584o. [DOI] [PubMed] [Google Scholar]
- 30.Strohalm M, Hassman M, Košata B, Kodíček M. mMass data miner: an open source alternative for mass spectrometric data analysis. Rapid Communications in Mass Spectrometry. 2008;22:905–908. doi: 10.1002/rcm.3444. [DOI] [PubMed] [Google Scholar]
- 31.Bligh EG, Dyer WJ. A Rapid Method of Total Lipid Extraction and Purification. Canadian Journal of Biochemistry and Physiology. 1959;37:911–917. doi: 10.1139/o59-099. [DOI] [PubMed] [Google Scholar]
- 32.Fahy E, Sud M, Cotter D, Subramaniam S. LIPID MAPS online tools for lipid research. Nucleic Acids Research. 2007;35:W606–W612. doi: 10.1093/nar/gkm324. [DOI] [PMC free article] [PubMed] [Google Scholar]
- 33.Hankin JA, Barkley RM, Murphy RC. Sublimation as a Method of Matrix Application for Mass Spectrometric Imaging. Journal of the American Society for Mass Spectrometry. 2007;18:1646–1652. doi: 10.1016/j.jasms.2007.06.010. [DOI] [PMC free article] [PubMed] [Google Scholar]
- 34.Thomas A, Charbonneau JL, Fournaise E, Chaurand P. Sublimation of New Matrix Candidates for High Spatial Resolution Imaging Mass Spectrometry of Lipids: Enhanced Information in Both Positive and Negative Polarities after 1,5-Diaminonapthalene Deposition. Analytical Chemistry. 2012;84:2048–2054. doi: 10.1021/ac2033547. [DOI] [PubMed] [Google Scholar]
- 35.Culling CFA, Allison RT, Bair WT. Cellular Pathology Technique. Butterworth & Co., Ltd; Boston: 1985. p. 98. [Google Scholar]
- 36.http://www.emsdiasum.com/microscopy/technical/datasheet/19320.aspx
- 37.Choi J, Kim D, Yoo PJ, Lee HH. Simple Detachment Patterning of Organic Layers and Its Application to Organic Light-Emitting Diodes. Advanced Materials. 2005;17:166–171. [Google Scholar]
- 38.Rawhouser PD, Laibinis PE, Zubair F, Caprioli RM. A Novel ‘Reticle’ Target for Calibration for MALDI Imaging Mass Spectrometry. 60th ASMS Conference on Mass Spectrometry and Allied Topics; Vancouver, BC, Canada. 2012. [Google Scholar]
- 39.Karas M, Gluckmann M, Schafer J. Ionization in matrix-assisted laser desorption/ionization: singly charged molecular ions are the lucky survivors. Journal of Mass Spectrometry. 2000;35:1–12. doi: 10.1002/(SICI)1096-9888(200001)35:1<1::AID-JMS904>3.0.CO;2-0. [DOI] [PubMed] [Google Scholar]
- 40.Karas M, Kruger R. Ion Formation in MALDI: The Cluster Ionization Mechanism. Chemical Reviews. 2003;103:427–440. doi: 10.1021/cr010376a. [DOI] [PubMed] [Google Scholar]
- 41.Murphy RC, Hankin JA, Barkley RM. Imaging of lipid species by MALDI mass spectrometry. Journal of lipid research. 2009;50(Suppl):S317–322. doi: 10.1194/jlr.R800051-JLR200. [DOI] [PMC free article] [PubMed] [Google Scholar]
- 42.Dreisewerd K, Lemaire R, Pohlentz G, Salzet M, Wisztorski M, Berkenkamp S, Fournier I. Molecular Profiling of Native and Matrix-Coated Tissue Slices from Rat Brain by Infrared and Ultraviolet Laser Desorption/Ionization Orthogonal Time-of-Flight Mass Spectrometry. Analytical Chemistry. 2007;79:2463–2471. doi: 10.1021/ac061768q. [DOI] [PubMed] [Google Scholar]
- 43.Zimny ML, Blackard WG. The Surface structure of isolated pancreatic islet cells. Cell and Tissue Research. 1975;164:467–471. doi: 10.1007/BF00219938. [DOI] [PubMed] [Google Scholar]
- 44.Chaurand P, Schwartz SA, Billheimer D, Xu BJ, Crecelius A, Caprioli RM. Integrating Histology and Imaging Mass Spectrometry. Analytical Chemistry. 2004;76:1145–1155. doi: 10.1021/ac0351264. [DOI] [PubMed] [Google Scholar]


