Abstract
Nuclear Resonance Vibrational Spectroscopy (NRVS) is a sensitive vibrational probe for biologically important heme complexes. The exquisite sensitivity of the NRVS data to the electronic structure provides detailed insights into the nature of these interesting compounds, but requires highly accurate computational methods for the mode assignments. To determine the best combinations of density functionals and basis sets, a series of benchmark DFT calculations on the previously characterized complex [Fe(OEP)NO] (OEP2−=octaethylporphyrinatio dianion) were performed. A test set of 21 methodology combinations including 8 functionals (BP86, mPWPW91, B3LYP, PBE1PBE, M062X, M06L, LC-BP86 and ωB97X-D) and 5 basis set (VTZ, TZVP, Lanl2DZ for iron and 6-31G*, 6-31+G* for other atoms) was carried out to calculate electronic structures and vibrational frequencies. We also implemented the conversion of frequency calculations into orientation-selective mode composition factors (e2), which can used to simulate the Vibrational Density Of States (VDOS) using Gaussian normal distribution functions. These use a series of user-friendly scripts for their application to NRVS. The structures as well as the isotropic and anisotropic NRVS of [Fe(OEP)NO] obtained with the M06L functional with a variety of basis sets are found to best reproduce the available experimental data, followed by B3LYP/LanL2DZ calculations. Other density functionals and basis sets do not produce the same level of accuracy. The noticeably worse agreement between theory and experiment for the out-plane NRVS compared with the excellent performance of the M06L functional for the in-plane prediction is attributed to deficiencies of the physical model rather than the computational methodology.
Introduction
Iron porphyrinates1 are among the most important biological prosthetic groups and occur in many proteins and enzymes. A pivotal property of iron porphyrinates is the strong attraction of central iron to axial ligands including histidine and diatomics like O2 in hemoglobin (Hb) and myoglobin (Mb). The binding and dissociation reactions of small ligands like O2 and NO in heme proteins are important biological processes2. In nature, NO is discriminated from O2 quite efficiently, presumably due to conformational changes in the protein imparted upon ligand binding3. Infrared and resonance Raman spectroscopy have provided insights into the interplay of structure and function of heme active sites4. However, these techniques have some inherent limitations, especially in the low frequency regime where mode assignment is hampered by weak signals, spectral congestion and low sensitivity to isotopic substitution5. Nuclear resonance vibrational spectroscopy 6 (NRVS)provides much higher selectivity because only the vibrational modes of the probe nucleus (57Fe in the case of iron porphyrinates ) contribute to the observed signal. Moreover, the NRVS intensity is directly related to the magnitude and direction of the motion; hence the method has a unique quantitative component in the measured vibrational spectrum. This method has been applied to heme enzymes, nitrogenase, and model complexes7. However, the spectral crowding in the NRVS response region makes the spectra hard to identify the several vibrational modes even for some very significant modes. In these cases, the computational prediction of NRVS spectra and comparison with experiment is an invaluable and indispensable tool in the assignment of the observed modes. In turn, good agreement between experimental and computed NRVS spectra validates the computed results and increases the confidence in an analysis of the geometric and electronic structure of the entire molecule.
Density functional theory (DFT) methods now predict electronic structures and properties for molecules of increasing sizes, including detailed descriptions of their vibrational dynamics8. Very recently, Noodleman and coworkers use a series of well-established density functionals to accurately calibrate 57Fe Mössbauer isomer shift and quadrupole splitting parameters8d. Despite the complex electronic structure of heme complexes, DFT calculations are becoming increasingly accurate in the prediction of vibrational frequencies and are a very useful tool in mode assignments. The new generation of recently developed density functionals (such as the M0X series that address some of the shortcomings of previous DFT methods) hold significant promise for clarifying the character of a vibronic mode. The rich data set of vibrational frequencies, amplitudes, and directions available from NRVS can also provides a particularly rigorous test of the ability of DFT calculations to predict the vibrational dynamics of transition metal complexes9.
Lehnert and coworkers developed a useful method called “quantum chemistry centered normal coordinate analysis” (QCC-NCA)10 to fit some of the important NRVS peaks (bending and stretch modes ) based on initial normal frequency calculations from Gaussian software. Clearly, a more rigorous and direct use of the normal modes would be preferable over such fitting procedures. In addition, the DFT methods applied to the prediction of NRVS have so far been limited to BP86 and B3LYP functionals, which do not describe dispersive interactions and suffer for incorrect descriptions of the self-interaction, especially in open shell systems11. As a result, they do not always have good agreement with experimental observations5,12. To the best of our knowledge, there have been no systematic studies of more modern functionals that provide a much more balanced description of the electronic structure.
In this paper, we report a series of computational studies at different levels of theory, including the modern functionals that have not previously been tested for this purpose, with the goal of establishing best practices for the prediction and interpretation of NRVS data. Specifically, we compare the performance of different computational methods for: (1) structure predictions, (2) the Fe-NO stretch and Fe-N-O bending vibrational modes, (3) prediction of NRVS and (4) directional NRVS (in-plane and out-plane). Finally, we discuss the effects of model issues. We also describe a set of user-friendly scripts that allow the direct conversion of frequency calculations into orientation-selective NRVS plots that can directly be compared to experimental data.
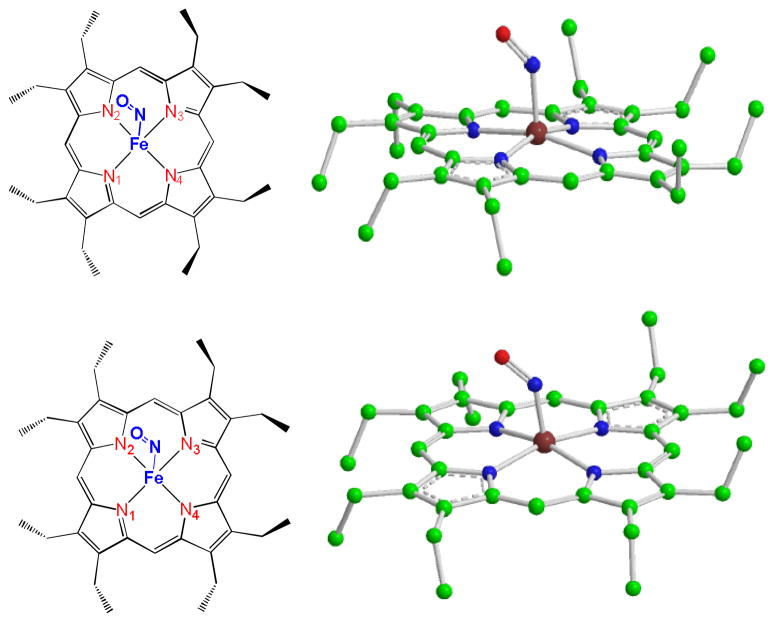
These calculations were benchmarked for [Fe(OEP)(NO)], a model complex for biologically relevant interactions of nitric oxide and heme iron for which there are high-resolution structures and NRVS data available. The rich data set of vibrational frequencies and directions available from NRVS for [Fe(OEP)(NO)] can provide a highly reliable test for our evaluation of DFT functionals and basis sets. At the same time, [Fe(OEP)(NO)] is a challenging molecule for DFT calculations because of the well-known difficulty in treating unpaired S=1/2 spin systems13. [Fe(OEP)NO] can adopt two conformations with different ethyl orientations in the solid state14. One conformation is from a triclinic crystal that has four neighboring ethyl groups of OEP pointing to one face of the porphyrin, whereas the remaining four ethyl groups are in the opposite direction (Scheme 1 top). The other conformation is from a monoclinic crystal with five and three ethyl groups of OEP pointing to each face of the porphyrin plane (Scheme 1 bottom).
Scheme 1.
Conformations of [Fe(OEP)(NO)]
Ferrous heme-nitrosyls have low energy barriers for rotations of the NO ligand around the Fe-NO bond15, which causes disorder in the NO orientation16. The recent work by Lehnert and coworkers has used B3LYP/LanL2DZ and BP86/LanL2DZ* calculations to test the twelve possible conformations for the disordered NO and rotated ethyl substituents of [Fe(OEP)(NO)]10d. Their prediction of NRVS spectra followed by QCC-NCA fitting has shown fair agreement with their powder measurements. However, comparisons of DFT predictions to powder measurements are lacking in the directional character of modes. We previously completed single-crystal measurements on [Fe(OEP)(NO)], taken at three orthogonal crystallographic directions, which shows significant directional anisotropy12b. In contrast to typical nitrosyl iron porphyrins, [Fe(OEP)(NO)] exhibits a completely ordered NO group and is ideal for the oriented single-crystal NRVS experiment and for DFT calculations .
Methods
Electronic Structure Calculations
The G09 program package17 was used to optimize the structures and for frequency analysis in our study. The model complex [Fe(OEP)(NO)] (S=1/2) was fully optimized without any constraints using the spin unrestricted DFT method. The starting structure was obtained from the crystal structure of triclinic [Fe(OEP)(NO)]14. Frequency calculations were performed on the fully optimized structures at the same basis level to obtain the vibrational frequencies with 57Fe isotope set which can yield inelastic scattering at the 14.4125keV nuclear resonance line in the NRVS experiment18. It is well known that that the frequencies obtained from harmonic frequency analyses are larger than the experimentally observed values due to the neglect of anharmonicity19. This is typically addressed using scaling factors. However, the precise values are not only method and basis set dependent, but are also different for different frequency regimes and have been validated mostly for pure organic molecules rather than the metal complexes discussed here. Therefore, the choice of the precise value would be ambiguous and the frequencies reported here were not scaled. The frequency output data have been created using the high precision format vibrational frequency eigenvectors in order to calculate Mode Composition Factors (e2) and Vibrational Density of States (VDOS) as described below.
We studied five classes of functionals: (1) Generalized Gradient Approximation (GGA) functionals (BP8620, mPWPW9121) which contain the exchange and GGA correlation functionals.; (2)Hybrid-GGA functionals (B3LYP22, PBE1PBE23), which contain a mixture of Hartree-Fock exchange with DFT exchange-correlation; (3)Hybrid meta-GGA functionals (M062X24) (4) meta-GGA functionals (M06L25) , M06L is a local meta-GGA functional; (5) long range GGA functionals (LC-BP8620,26, ωB97X-D27) which contain long range corrections. These were combined with different basis sets28 as specified in the results section. In general, we used triple- valence basis sets with (TZVP) or without (VTZ) polarization functions or a double effective core potential (LanL2DZ) on iron and 6-31G* or 6-31+G* basis sets for all other atoms. In order to allow comparison to Lehnert’s results10d, the LanL2DZ basis set was also tested for all atoms..
Calculation of the NRVS data
The first step in the calculation of the NRVS data is the calculation of the predicted mode composition factors, which are based on the atomic displacements of each atom (ri) from the analytical frequency analysis using DFT. The mode composition factors , which represent the fraction of the kinetic energy in frequency mode α due to the motion of atom j (j = 57Fe for NRVS), and provide a convenient quantitative comparison between measurements and calculations29. Mode composition factors are defined in Eq. 1:
| (1) |
where mi is the atomic mass of atom i and ri is the absolute length of the Cartesian displacement vector for atom i in Angstroms. The Mode Composition Factors for different directions are defined in terms of an averaged porphyrin plane as in-plane, which can be calculated from a projection of the atomic displacement vector x and y (Eq.2). The out-of-plane atomic displacement perpendicular to the resulting porphyrin plane for a normal mode is obtained from a projection of the atomic displacement vector z (Eq.3).
| (2) |
| (3) |
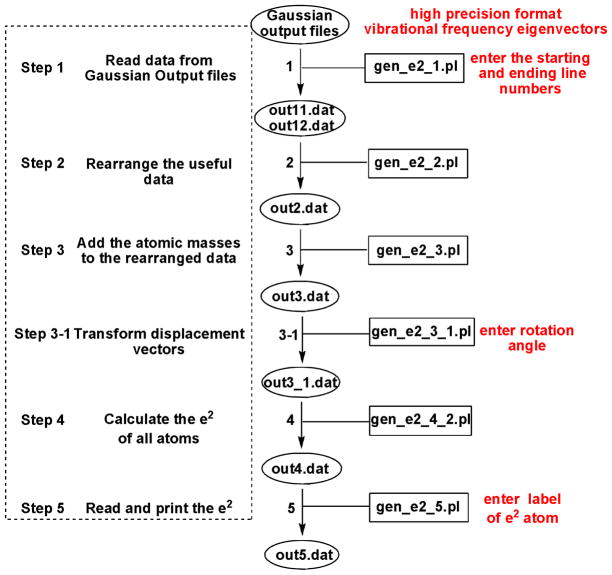
The Perl scripts to calculate the mode composition factors are provided in the Supporting Information and directly read from a G09 frequency output file using a high precision format for the vibrational frequency eigenvectors. Figure 1 showed the flow scheme for the scripts calculating . The total procedures include six simple scripts, three of which (shown in red in Figure 1) need user input based on the specific molecule to be studied. In step 1, the starting and ending line numbers are needed for the frequency range of interest. In our case, a frequency range 0-800 cm−1 is defined to follow the range of NRVS in the experimental observations. In step 3-1, the orientation of interest is set as shown in Figure 2. For porphyrins, the standard orientation used in G09 aligns the x and y coordinate along the iron-meso carbon axes, but the stretch vibration along the iron-nitrogen bond is needed. Thus, the calculation of requires in some cases a rotation of the coordinates by 45°. In the final step, the desired e2 data (in our case for 57Fe, but available for any set of atoms already) is read out.
Figure 1.
Flowchart of the scripts that generate e2 in different orientations. The rectangles and ovals represent the script files and output files in every step, respectively.
Figure 2.
Fe-N-O bending (left) and Fe-NO stretch (right) vibrational modes. Hydrogen atoms and Fe-N bonds have been omitted for clarity. The vector is shown 100(mj/mFe)1/2 times longer than the zero-point vibrational amplitude of atom j.
The predicted mode composition factors can also be compared to the integrated spectral areas obtained from NRVS5. Therefore Vibrational Density of States (VDOS) intensities can be simulated from the Mode Composition Factors using the Gaussian normal distributions function, where the full width at half height (FWHH) is defined appropriately by considering the spectral resolution in the experiment. In this study, the MATLAB R2010a software was used to generate the predicted NRVS curves.
Results and Discussion
Effects of DFT method and basis set on the calculated geometry of [Fe(OEP)(NO)]
To investigate the effects of DFT method and basis sets, we have performed DFT calculations on [Fe(OEP)(NO)] applying the functionals and basis sets discussed above. Tables 1 and 2 show the selected geometric and vibrational properties of [Fe(OEP)(NO)] with the different basis sets in each density functional. In general, the basis set used is 6-31G* for H, C, N and O; VTZ, TZVP or Lanl2DZ for Fe, respectively. For selected functionals, a diffuse function 6-31+G* was added to N and O to better allow for molecular polarity and possible partial change on the donor atoms. For the combination of the VTZ and TZVP basis sets on iron with the B3LYP and M062X functionals, strong spin contamination (0.87 for B3LYP and 0.95 for M062X) prevented in some cases the calculation of stable electronic structures.
Table 1.
Observed and calculated geometric parameters of [Fe(OEP)(NO)].a
| [Fe(OEP)(NO)] | Geometric parameters (pm or degree)
|
||||||||||
|---|---|---|---|---|---|---|---|---|---|---|---|
| Functional | Basis set | Fe-NO | ΔFe-NO | N-O | ΔN-O | □Fe-N-O | Δ□Fe-N-O | Fe-Nshorte | Fe-Nlonge | Δlong-short | Ref. |
| Triclinic crystal (experimental) | 173.1 | 116.8 | 142.7 | 199.9 | 202.0 | 2.1 | 12b | ||||
|
| |||||||||||
| BP86 | 6-31G*/VTZ | 169.7 | −3.4 | 119.2 | 2.4 | 143.2 | 0.5 | 200.3 | 203.1 | 2.8 | 12b |
| 6-31+G*(N,O)b/VTZ | 169.6 | −3.5 | 119.5 | 2.7 | 143.6 | 0.9 | 200.3 | 203.3 | 3.0 | f | |
| 6-31G*/TZVP | 169.6 | −3.5 | 119.1 | 2.3 | 144.9 | 2.2 | 200.9 | 203.9 | 3.0 | f | |
|
| |||||||||||
| MPWPW91 | 6-31G*/VTZ | 169.8 | −3.3 | 119.0 | 2.2 | 142.8 | 0.1 | 200.1 | 202.9 | 2.8 | f |
| 6-31+G*(N,O)b/VTZ | 169.6 | −3.5 | 119.3 | 2.5 | 143.7 | 1.0 | 200.3 | 203.3 | 3.0 | f | |
| 6-31G*/TZVP | 169.6 | −3.5 | 118.9 | 2.1 | 144.7 | 2.0 | 200.8 | 203.8 | 3.0 | f | |
|
| |||||||||||
| B3LYPd | 6-31G*/Lanl2DZ | 172.8 | −0.3 | 117.0 | 0.2 | 139.8 | −2.9 | 200.7 | 203.1 | 2.4 | f |
| Lanl2DZc | 174.2 | 1.1 | 121.5 | 4.7 | 142.9 | 0.2 | 201.3 | 202.7 | 1.4 | 10d g | |
|
| |||||||||||
| PBE1PBE | 6-31G*/VTZ | 170.7 | −2.4 | 116.5 | −0.3 | 140.2 | −2.5 | 199.2 | 201.3 | 2.1 | f |
|
| |||||||||||
| M062Xd | Lanl2DZ | 231.1 | 58 | 118.2 | 1.4 | 125.8 | −16.9 | 203.0 | 202.0 | −1.0 | f |
|
| |||||||||||
| M06L | 6-31G*/VTZ | 172.2 | −0.9 | 118.0 | 1.2 | 140.2 | −2.5 | 200.6 | 202.6 | 2.0 | f |
| 6-31+G*(N,O)b/VTZ | 172.4 | −0.7 | 118.1 | 1.3 | 140.7 | −2.0 | 200.8 | 203.1 | 2.3 | f | |
| 6-31G*/TZVP | 172.0 | −1.1 | 117.9 | 1.1 | 141.5 | −1.2 | 201.1 | 203.2 | 2.1 | f | |
| 6-31+G*(N,O)b/TZVP | 172.4 | −0.7 | 118.1 | 1.3 | 140.9 | −1.8 | 201.1 | 203.3 | 2.2 | f | |
| 6-31G*/Lanl2DZ | 172.2 | −0.9 | 117.8 | 1.0 | 140.2 | −2.5 | 200.2 | 202.7 | 2.5 | f | |
| Lanl2DZc | 173.5 | 0.4 | 121.9 | 5.1 | 141.9 | −0.8 | 200.6 | 202.5 | 1.9 | f | |
|
| |||||||||||
| LC-BP86 | 6-31G*/VTZ | 170.9 | −2.2 | 115.2 | −1.6 | 139.1 | −3.6 | 196.1 | 197.5 | 1.4 | f |
|
| |||||||||||
| ωB97X-D | 6-31G*/VTZ | 172.6 | −0.5 | 116.5 | −0.3 | 139.3 | −3.4 | 199.8 | 201.2 | 1.4 | f |
| 6-31+G*(N,O)b/VTZ | 172.3 | −0.8 | 116.6 | −0.2 | 139.7 | −3.0 | 199.9 | 201.5 | 1.6 | f | |
basis sets: 6-31G* for H, C, N and O; VTZ, TZVP or Lanl2DZ for Fe;
basis set: 6-31G* for H and C, 6-31+G* for N and O.
basis set Lanl2DZ for all the atoms.
basis set VTZ, TZVP for Fe is also applied, but failed to obtain the converged wave functions.
values for Fe-Nshort and Fe-Nlong (Nshort= the average of two short Fe and porphyrin N-atom, Nlong= the average of two long Fe and porphyrin N-atom; Δlong-short is the difference between the experimental data and calculation with corresponding bond lengths and angle.
this work.
only isotropic terms, for anisotropic terms, see this work
Table 2.
Observed and calculated vibrations of [Fe(OEP)(NO)].a
| [Fe(OEP)(NO)] | Vibrational frequencies (cm−1)
|
||||
|---|---|---|---|---|---|
| functional | Basis set | ν(Fe-NO) | δ(Fe-N-O) | ν(N-O) | Ref. |
| Triclinic crystal (experimental) | 517 | 393 | 1673 | 12b | |
|
| |||||
| BP86 | 6-31G*/VTZ | 623 | 417 | 1719 | 12b |
| 6-31+G*(N,O)b/VTZ | 617 | 415 | 1689 | e | |
| 6-31G*/TZVP | 618 | 410 | 1730 | e | |
|
| |||||
| MPWPW91 | 6-31G*/VTZ | 621 | 419 | 1727 | e |
| 6-31+G*(N,O)b/VTZ | 615 | 415 | 1698 | e | |
| 6-31G*/TZVP | 616 | 410 | 1739 | e | |
|
| |||||
| B3LYPd | 6-31G*/Lanl2DZ | 517/521f | 417 | 1828 | e |
| Lanl2DZc | 498/504f | 407 | 1616 | 10dh | |
|
| |||||
| PBE1PBE | 6-31G*/VTZ | 547 | 433 | 1885 | e |
|
| |||||
| M062Xd | Lanl2DZ | e | |||
|
| |||||
| M06L | 6-31G*/VTZ | 494/499f | 396 | 1798 | e |
| 6-31+G*(N,O)b/VTZ | 477/485f | 391 | 1779 | e | |
| 6-31G*/TZVP | 495/500f | 388 | 1807 | e | |
| 6-31+G*(N,O)b/TZVP | 477/485f | 386 | 1782 | d | |
| 6-31G*/Lanl2DZ | 517 | 405 | 1804 | e | |
| Lanl2DZc | 448 | 401 | 1624 | e | |
|
| |||||
| LC-BP86 | 6-31G*/VTZ | 551 | 443 | 2001 | e |
|
| |||||
| ωB97X-D | 6-31G*/VTZ | 532 | 425 | 1891 | e |
| 6-31+G*(N,O)b/VTZ | 522 | 422 | 1865 | ef | |
basis sets: 6-31G* for H, C, N and O; VTZ, TZVP or Lanl2DZ for Fe.
basis set: 6-31G* for H and C, 6-31+G* for N and O.
basis set Lanl2DZ for all the atoms.
basis set VTZ, TZVP for Fe is also applied, but failed to obtain the converged wave functions.
this work.
only isotropic terms, for anisotropic terms, see this work
As shown in Table 1, the BP86, mPWPW91 and PBE1PBE functionals regardless of basis set underestimate the Fe-NO bond length by up to 3.5 pm. The B3LYP, M06L and ωB97X-D functionals reproduce the experimentally observed values quite accurately, while the M062X grossly overestimates the Fe-NO bond length. The basis set effect on this parameter is negligible. For the N-O bond length, the majority of the calculations with a variety of basis set overestimate this parameter, but the accuracy is better than for the Fe-NO bond length. Interestingly, the basis set effect here is much higher, with the Lanl2DZ basis set on all atoms performing poorly compared to other methods. This can be rationalized by the iron back-donation to the N-O p* orbital because this would make the Fe-NO bond short and elongate the N-O bond.
All functional/basis set combinations predict the Fe-N-O angle within 4° except for M062X which gives a value 17° degrees higher than the experimental value of 142.7°. The better of the predictions seem to occur in basis sets with simplified electronic systems such as the VTZ basis with no polarization function and Lanl2DZ with core effective potentials shown in Table 2 (BP86/VTZ, B3LYP/Lanl2dz, M06L/Lanl2dz).
An important feature of [Fe(OEP)(NO)] that has been observed by the Scheidt group14b are the different bond lengths of the four equatorial Fe-N bonds. Two short Fe-Np distances are in the direction of the tilted NO ligand, while two long Fe-Np distances are opposite the off-axis NO tilt. This anisotropic effect can be simplified to the different bond lengths of two short patterns and two long patterns as shown in Table 1. All functional/basis set combinations except M062X method predict this feature well. The observed difference of Np-long - Np-short was 2.1 pm in crystal structure and ranged from 1.0–3.0 pm in calculations.
In summary, the M062X functional provides poor results for several of the geometric parameters, namely the Fe-NO distance and the Fe-N-O angle, and can therefore not be recommended for the systems under study here. Both of the GGA functionals, BP86 and mPWPW91, perform better but still underestimate the Fe-NO bond by about 3.5 pm and overestimate the N-O bond by about 2.5. Better predictions were obtained from the B3LYP, M06L, ωB97X-D functionals with a suitable basis set, all having agreement with experimental data within 1.0 pm for both bonds. M06L clearly stands out as providing the best agreement with experiment.
Fe-NO stretch and Fe-N-O bending vibrational modes
The Fe-NO stretch and Fe-N-O bending modes are two major vibrations in [Fe(OEP)(NO)] that have high frequencies and strong intensities. In the Fe-N-O bending mode, the motions of Fe and O are in the same direction and opposite to the nitrosyl nitrogen, while the Fe-NO stretch mode was predicted to have the opposite direction motion between the Fe and NO group (Figure 2). Both the Fe-NO stretching and Fe-N-O bending frequencies are listed in Table 2 with functional method and basis set designated.
As shown in Table 2, the GGA functionals, BP86 and mPWPW91, severely overestimate the Fe-NO stretching frequency( >615 cm−1 predicted vs. 517 cm−1observed). This difference is too large to be explained with anharmonicity and is likely because the Fe-NO bond lengths are underestimated. The other methods, including the Hybrid-GGA, meta-GGA and long range GGA provide better prediction for the stretch mode ranging from 448 cm−1 to 551 cm−1. The exact frequency of 517 cm−1 was predicted by the B3LYP and M06L method with 6-31G*/lanl2dz basis set. The PBE1PBE, LC-BP86 and ωB97X-D were significantly less accurate than B3LYP and M06L. All of the Fe-N-O bending mode predictions are within 50 cm−1 of the experiment observation. The M06L method predicts it accurately to within 2-3 cm−1 when the VTZ basis set for Fe was used. Although the BP86 and mPWPW91 provides the Fe-N-O angle closer to the experimental value, it does not give a better bending frequency prediction. It is clear that the harmonic approximation common to all calculations leads to deviations from the experimentally observed values, but that the computed values still allow a clear assignment of the normal modes.
Prediction of powder NRVS of [Fe(OEP)(NO)]
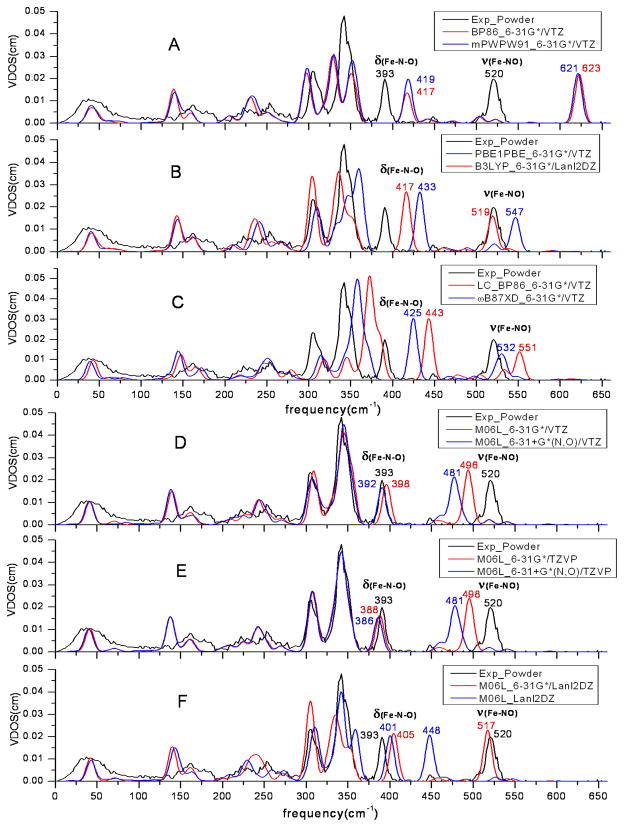
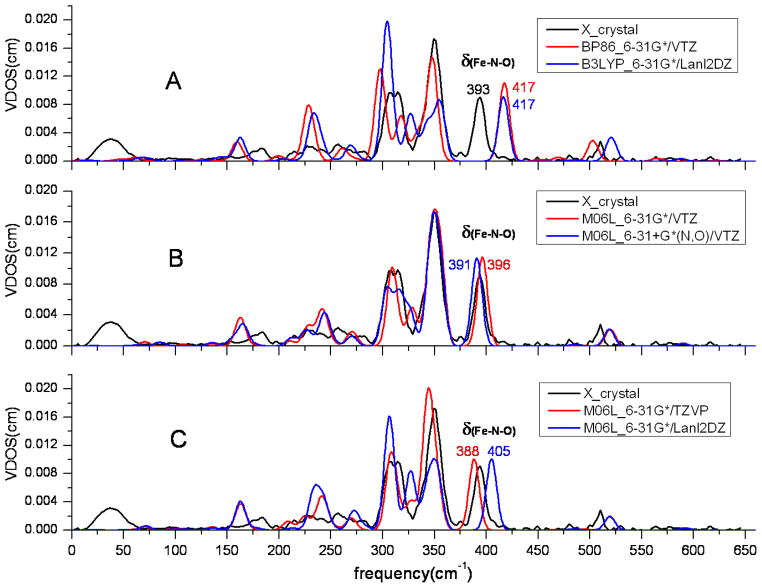
The main goal of this work was to determine the best practices for the prediction of NRVS. To investigate the effects of DFT methods and basis sets, we calculated the NRVS powder spectrum of [Fe(OEP)(NO)]. This spectrum has all the vibrational modes of iron including the Fe-NO stretch mode and Fe-N-O bending modes discussed earlier. Selected NRVS predicted spectra are shown in Figure 3, and predicted spectra using other functionals can be found in the Supporting Information. As can be seen in Figure 3, the NRVS can conveniently be divided into three frequency domains for which the mode assignment has been discussed in detail previously12b,30. Here we will discuss the performance of the different methods in terms of the different frequency domains.
Figure 3.
NRVS spectra of [Fe(OEP)(NO)] with a variety of methods and basis sets with 12 cm−1 FWHH. The experimental observation of [Fe(OEP)(NO)] powder is colored black and the prediction data is colored red or blue (the same color strategy and FWHH in Figures 4–6).
In the region > 360 cm−1, there are two important modes (Fe-NO stretch and Fe-N-O bend) in the observed NRVS spectrum and in each predicted spectra (Figure 3, A-F). There is an additional or partial peak in > 360 cm−1 region when the long range LC-BP86 method was used (Figure 3C). It could be an overestimated mode from the 220-360 cm−1 region. However, M06L was the best of the methods and was chosen to investigate the effects of the basis sets in the NRVS level. (Figure 3, D-F). As seen in Figures 3D and 3E, increasing the basis function from 6-31G* to 6-31+G* can move the Fe-NO stretch and it is somewhat underestimated. In Figure 3D, the bending mode and stretch mode had shifted from 398 and 496 to 392 and 481, respectively. Similar trends can be seen in Figure 3E. The VTZ and TZVP basis sets show little difference. However, the Lanl2DZ basis set gives inconsistent frequency predictions (Figure 3F). In the region 220–360 cm−1, the two high-intensity peaks are observed in the region with considerable spectral crowding. Most mode frequencies are poorly predicted by all functionals except M06L. The worst predictions are obtained by using GGA functionals with three apparently independent peaks (Figure 3A). The largely overestimated spectra are predicted with the Long range GGA functionals. As shown in Figure 3C, the major peaks move to the high-frequency region and are far away from the experimental observation designated by the black line. The better spectra are generated by M06L functional with suitable basis set combinations. The spectra are almost coincident with the experiment spectra when VTZ or TZVP basis set for Fe are used in the calculation (Figures 3D and 3E). However, the M06L functional is not quite as good when Lanl2DZ basis set is used (Figure 3F).
All of the calculations obtained similar spectral predictions in the < 220 cm−1 region where the important doming mode occurs. However, all DFT methods used here underestimate the doming mode frequency and overestimate its intensity. The results of the calculations should therefore be interpreted with caution.
The In-Plane and Out-Plane NRVS of single-crystal [Fe(OEP)(NO)]
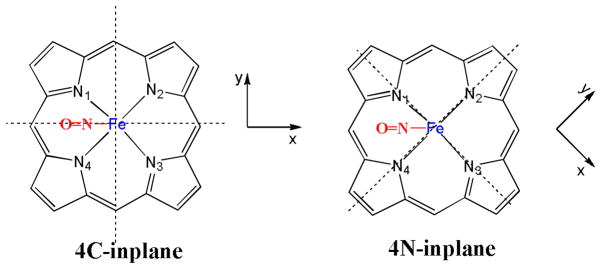
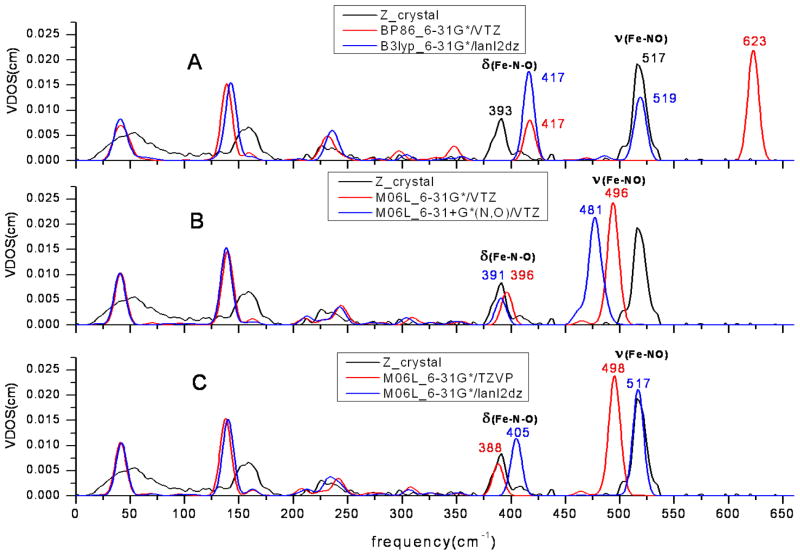
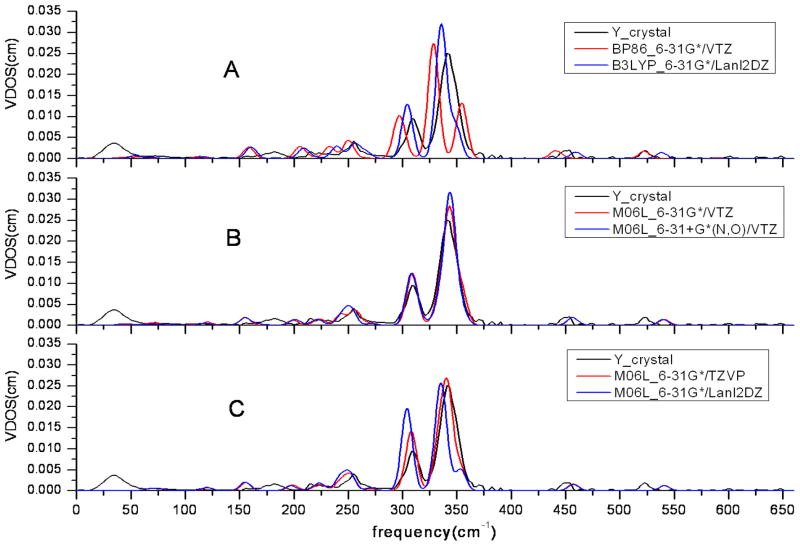
Comparisons of DFT predictions to powder measurements do not account for the directional character of modes - that is substantial. A more detailed comparison needs to be done to capture the directional anisotropy. In porphyrin chemistry analysis confined to the averaged porphyrin plane is usually defined as in plane, and two directions are defined (in-plane-x and in-plane-y) The third direction is perpendicular to the porphyrin plane and defined as out-of plane or the z direction. In this paper, in-plane x is parallel to the Fe-NO plane and y is perpendicular to the Fe-NO plane as shown in Scheme 2. This axis selection is called 4C-inplane. Only functionals that predicted the powder spectrum well are used in the comparisons of x-y-z-directional spectra (Figure 4–6). The published data with the BP86 method was chosen to highlight the superiority of M06L functional. The orientation-selective spectra using other functionals can also be found in the Supporting Information.
Scheme 2.
Figure 4.
NRVS spectra of [Fe(OEP)(NO)] with selected methods and basis sets in the x direction, which is parallel to the intersection of porphyrin and Fe-N-O plane.
Figure 6.
NRVS spectra of [Fe(OEP)(NO)] with selected methods and basis sets in the z direction, which is perpendicular to the average porphyrin plane.
– The possible anisotropy in the in-plane NRVS spectrum can be shown by a measurement in two orthogonal in-plane directions. Conveniently, we chose for measurements and predictions, x to be along the projection of the FeNO plane and y to be orthogonal. These are shown in Figures 4 and 5, respectively. As shown in Figure 4, there are three observed peaks in the >300 cm−1 region including one doublet peak at 300-325 cm−1. The observed doublet peak is only accurately predicted with the diffused function 6-31+G* for N and O (Figure 4B). The Lanl2DZ basis set is unfavorable in the prediction of NRVS spectrum, because more peaks are predicted from 300 cm−1 to 360 cm−1 than observed and the bending mode around 390 cm−1 in the x-direction is overestimated in both cases (Figure 4A/blue line and 4C/blue line). In sharp contrast, all the major peaks in the NRVS along y direction are underestimated when Lanl2DZ was used (Figure 5A/blue line and 5C/blue line). The BP86 functional is ruled out because 3 peaks are predicted and only two are observed (Figure 5A). M06L with VTZ or TZVP basis set shows better prediction than all others not only along the x direction but also along the y direction of NRVS.
Figure 5.
NRVS spectra of [Fe(OEP)(NO)] with selected methods and basis sets in the y direction, which is perpendicular to the Fe-N-O plane.
The predictions of the out-of-plane NRVS spectra, shown in Figure 6, do not agree as well with experimental data as the in-plane spectra. The predicted doming modes are around 140 cm−1 regardless of the functional and basis set used, while the experimental observation is a broad peak at 160 cm−1. The bending mode in z-direction component is better predicted only when M06L and VTZ basis set were used as shown in Figure 6B. It is surprising that the stretch mode was perfectly predicted by the DFT calculation with Lanl2DZ basis set which in general gave poor predictions as discussed above (Figures 6A and 6C). This presents a dilemma when using the Lanl2DZ basis set, because it predicts the stretch mode perfectly but fails on others modes. The diffuse function is not suitable for the prediction of the stretch mode and it underestimates the experimental observations (Figure 6B). It is also inconsistent with the basis set strategy for in-plane NRVS.
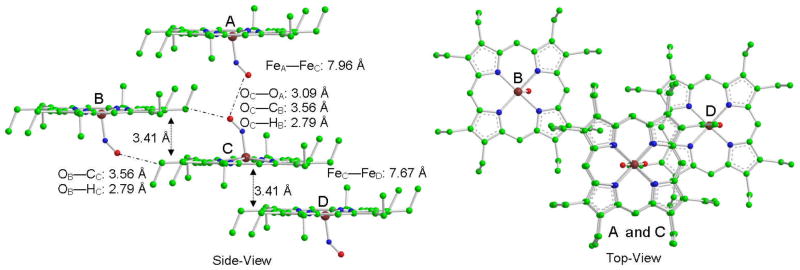
A probable explanation is the difference between the gas phase calculation and solid-state experiment. The predicted model is a single molecule without any intermolecular interactions, while both the experimental powder and crystal are in a crystal lattice and have intermolecular interactions or cooperativity. Figure 7 presents some likely intermolecular interactions. The distance between crystal layers is 3.41 Å and the closest distance between two irons is 7.67 Å. This suggest that an intrinsic interaction between different crystal layers could affect the out-plane modes more than in-plane ones. For the in-plane modes, the intermolecular close contacts cannot easily influence the iron center due to long distances. Therefore, the in-plane NRVS spectra may be more easily modeled. These unaccounted forces can also explain why the out-plane spectra are always more difficult to predict accurately. The perfectly predicted stretching frequency by Lanl2DZ is probably the result of chance rather than ideal modeling and basis set because it fails to predict other modes.
Figure 7.
Crystal structures of triclinic [Fe(OEP)(NO)]. Hydrogen atoms have been omitted for clarity. Atom color: Fe (dark red), N(blue), O(red), C(green)
Conclusions
It is important to validate density functional methods in order to accurately predict directional anisotropy, a new feature in Nuclear Resonance Vibrational Spectroscopy (NRVS),12b and to reliably assign the vibrational modes. The scripts discussed here and made available in the Supporting Information allows the facile calculation of orientation-selective mode composition factors (e2), Vibrational Density Of States (VDOS), and NRVS data from standard Gaussian outputs. The extensive benchmarking of 21 different electronic structure methods for the representative case of the [Fe(OEP)NO] complex indicates that the M06L functional with suitable basis sets such as VTZ/6-31+G* or TZVP/6-31+G* provides the best agreement between calculated and experimental structures and NRVS data, followed by the B3LYP/6-31G*/LanL2DZ method. This is presumably due to the accurate description of the open-shell system and accurate excitation energies31, which are likely to be important due to the low lying excited states in heme complexes, by the M06L functional.
A comparison of computational NRVS predictions and experimental data reveals that the M06L functional shows excellent agreement in the frequency domains of > 360 cm−1 and 200–360 cm−1. However, the frequencies of the modes in the region below 200 cm−1 are underestimated by all methods, including the M06L functional. A more detailed analysis of the anisotropic NRVS data shows that the M06L functional gives very good results for in-plane (x and y), but less so for out-of-plane (z) NRVS. The prediction of the in-plane NRVS using the M06L functional still exhibits the higher performance while the out-of-plane vibrations are less well predicted. This is most likely due to limitations of the model, which does not consider the crystal packing contacts that more influence the out-of-plane, but not the in-plane vibrations.
In summary, the protocol presented here allows the facile and accurate prediction of NRVS data for the purpose of made assignment and to understand the detailed geometric and electronic structure of heme complexes.
Supplementary Material
Acknowledgments
We gratefully acknowledge support of this research by the National Institutes of Health (Grant GM-38401 to W.R.S). Generous allocation of computing resources by the Center for Research Computing at the University of Notre Dame and by the National Science Foundation through TeraGrid resources under grant number TG-CHE090124 are also acknowledged.
Footnotes
Supporting Information Available
Perl scripts, procedure for using the scripts, e2 values and computed NRVS spectra with three orthogonal directions as well as Cartesian coordinates and total energies of all structures discussed. This material is available free of charge via the internet at http://pubs.acs.org
References
- 1.(a) Berezin BD. Coordination Compounds of Porphyrins and Phthalocyanines. John Wiley & Sons Ltd; New York: 1981. [Google Scholar]; (b) Lever ABP, Gray HB, editors. Iron Porphyrins. Addison-Wesley Publishing Company Inc; Reading, MA: 1983. [Google Scholar]
- 2.Richter-Addo GB, Legzdins P, Burstyn J. Chem Rev. 2002;102:857. doi: 10.1021/cr010188k. [DOI] [PubMed] [Google Scholar]
- 3.(a) Yu AE, Hu S, Spiro TG, Burstyn JN. J Am Chem Soc. 1994;116:4117. [Google Scholar]; (b) Negrerie M, Kruglik SG, Lambry J, Vos MH, Martin J, Franzen S. J Biol Chem. 2006;281:10389. doi: 10.1074/jbc.M513375200. [DOI] [PubMed] [Google Scholar]
- 4.Vogel KM, Kozlowski PM, Zgierski MZ, Spiro TG. Inorg Chim Acta. 2000;297:11. [Google Scholar]
- 5.Leu BM, Zgierski MZ, Wyllie GRA, Scheidt WR, Sturhahn W, Alp EE, Durbin SM, Sage JT. J Am Chem Soc. 2004;126:4211. doi: 10.1021/ja038526h. [DOI] [PMC free article] [PubMed] [Google Scholar]
- 6.Scheidt WR, Dubin SM, Sage JT. J Inorg Biochem. 2005;99:60. doi: 10.1016/j.jinorgbio.2004.11.004. [DOI] [PubMed] [Google Scholar]
- 7.(a) Xiao Y, Wang H, George SJ, Smith MC, Adams MW, Jenney FE, Sturhahn W, Jr, Alp EE, Zhao J, Yoda Y, Dey A, Solomon EI, Cramer SP. J Am Chem Soc. 2005;127:14596. doi: 10.1021/ja042960h. [DOI] [PubMed] [Google Scholar]; (b) Leu BM, Zgierski MZ, Wyllie GR, Scheidt WR, Sturhahn W, Alp EE, Durbin SM, Sage JT. J Am Chem Soc. 2004;126:4211. doi: 10.1021/ja038526h. [DOI] [PMC free article] [PubMed] [Google Scholar]; (c) Achterhold K, Sturhahn W, Alp EE, Parak FG. Hyperfine Interact. 2002;3:141–142. [Google Scholar]; (d) Xiao Y, Tan ML, Ichiye T, Wang H, Guo Y, Smith MC, Meyer J, Sturhahn W, Alp EE, Zhao J, Yoda Y, Cramer SP. Biochemistry. 2008;47:6612. doi: 10.1021/bi701433m. [DOI] [PubMed] [Google Scholar]; (e) Xiao Y, Fisher K, Smith MC, Newton WE, Case DA, George SJ, Wang H, Sturhahn W, Alp EE, Zhao J, Yoda Y, Cramer SP. J Am Chem Soc. 2006;128:7608. doi: 10.1021/ja0603655. [DOI] [PMC free article] [PubMed] [Google Scholar]; (f) Rai BK, Durbin SM, Prohofsky EW, Sage JT, Wyllie GR, Scheidt WR, Sturhahn W, Alp EE. Biophys J. 2002;82:2951. doi: 10.1016/S0006-3495(02)75636-1. [DOI] [PMC free article] [PubMed] [Google Scholar]; (g) Rai BK, Durbin SM, Prohofsky EW, Sage JT, Ellison MK, Roth A, Scheidt WR, Sturhahn W, Alp EE. J Am Chem Soc. 2003;125:6927. doi: 10.1021/ja028219w. [DOI] [PubMed] [Google Scholar]; (h) Rai BK, Prohofsky EW, Durbin SM. J Phys Chem B. 2005;109:18983. doi: 10.1021/jp052950i. [DOI] [PubMed] [Google Scholar]; (h) Cramer S, Xiao Y, Wang H, Guo Y, Smith M. Hyperfine Interact. 2007;170:47. [Google Scholar]; (i) Petrenko T, DeBeer S, Aliaga-Alcalde George N, Bill E, Mienert B, Xiao Y, Guo Y, Sturhahn W, Cramer SP, Wieghardt K, Neese F. J Am Chem Soc. 2007;129:11053. doi: 10.1021/ja070792y. [DOI] [PubMed] [Google Scholar]
- 8.(a) Paulsen H, Winkler H, Trautwein AX, Grünsteudel H, Rusanov V, Toftlund H. Phys Rev B. 1999;59:975. [Google Scholar]; (b) Paulsen H, Benda R, Herta C, Schünemann V, Chumakov AI, Duelund L, Winkler H, Toftlund H, Trautwein AX. Phys Rev Lett. 2001;86:1351. doi: 10.1103/PhysRevLett.86.1351. [DOI] [PubMed] [Google Scholar]; (c) Paulsen H, Rusanov V, Benda R, Herta C, Schünemann V, Janiak C, Dorn T, Chumakov AI, Winkler H, Trautwein AX. J Am Chem Soc. 2002;124:3007. doi: 10.1021/ja016239c. [DOI] [PubMed] [Google Scholar]; (d) Sandala GM, Hopmann KH, Ghosh A, Noodleman L. J Chem Theory Comput. 2011;7:3232. doi: 10.1021/ct200187d. [DOI] [PMC free article] [PubMed] [Google Scholar]
- 9.(a) Zhou M, Andrews L, Bauschlicher CW., Jr Chem Rev. 2001;101:1931. doi: 10.1021/cr990102b. [DOI] [PubMed] [Google Scholar]; (b) Ghosh A, Bocian DF. J Phys Chem. 1996;100:6363. doi: 10.1021/jp953544+. [DOI] [PubMed] [Google Scholar]; (c) Kozlowski PM, Jarzecki AA, Pulay P, Li XY, Zgierski MZ. JPhys Chem. 1996;100:13985. [Google Scholar]; (d) Kozlowski PM, Spiro TG, Bérces A, Zgierski MZ. J Phys Chem B. 1998;102:2603. [Google Scholar]; (e) Ghosh A, Skancke A. J Phys Chem B. 1998;102:10087. [Google Scholar]; (f) Kozlowski PM, Spiro TG, Zgierski MZ. J Phys Chem B. 2000;104:10659. [Google Scholar]; (g) Cao Z, Hall MB. J Am Chem Soc. 2001;123:3734. doi: 10.1021/ja000116v. [DOI] [PubMed] [Google Scholar]; (h) Franzen S. J Am Chem Soc. 2001;123:12578. doi: 10.1021/ja0108988. [DOI] [PubMed] [Google Scholar]; (i) Steene E, Wondimagegn T, Ghosh A. J Inorg Biochem. 2002;88:113. doi: 10.1016/s0162-0134(01)00396-8. [DOI] [PubMed] [Google Scholar]; (j) Ohta T, Matsuura K, Yoshizawa K, Morishima I. J Inorg Biochem. 2000;82:141. doi: 10.1016/s0162-0134(00)00162-8. [DOI] [PubMed] [Google Scholar]; (k) Maréchal JD, Maseras F, Lledós A, Mouawad L, Perahia D. Chem Phys Lett. 2002;353:379. [Google Scholar]; (l) Liao MS, Scheiner S. J Chem Phys. 2002;116:3635. [Google Scholar]
- 10.For selected papers: (Praneeth VKK, Neather C, Peters G, Lehnert N. Inorg Chem. 2006;45:2795. doi: 10.1021/ic050865j.Paulat F, Berto TC, DeBeer George S, Goodrich L, Praneeth VKK, Sulok CD, Lehnert N. Inorg Chem. 2008;47:11449. doi: 10.1021/ic801626w.Berto TC, Praneeth VKK, Goodrich L, Lehnert N. J Am Chem Soc. 2009;131:17116. doi: 10.1021/ja904368n.Lehnert N, Galinato MG, Paulat F, Richter-Addo GB, Sturhahn W, Xu N, Zhao J. Inorg Chem. 2010;49:4133. doi: 10.1021/ic902181e.
- 11.Oxgaard J, Wiest O. J Phys Chem A. 2001;105:8236. [Google Scholar]
- 12.(a) Scheidt WR, Barabanschikov A, Pavlik JW, Silvernail NJ, Sage JT. Inorg Chem. 2010;49:6240. doi: 10.1021/ic100261b. [DOI] [PMC free article] [PubMed] [Google Scholar]; (b) Pavlik JW, Barabanschikov A, Oliver AG, Alp EE, Sturhahn W, Zhao J, Sage JT, Scheidt WR. Angew Chem Int Ed. 2010;49:4400. doi: 10.1002/anie.201000928. [DOI] [PMC free article] [PubMed] [Google Scholar]
- 13.Ghosh A. J Biol Inorg Chem. 2006;11:712. doi: 10.1007/s00775-006-0135-4. [DOI] [PubMed] [Google Scholar]
- 14.(a) Ellison MK, Scheidt WR. J Am Chem Soc. 1997;119:7404. [Google Scholar]; (b) Scheidt WR, Duval HF, Neal TJ, Ellison MK. J Am Chem Soc. 2000;122:4651. [Google Scholar]
- 15.(a) Patchkovskii S, Ziegler T. Inorg Chem. 2000;39:5354. doi: 10.1021/ic0005691. [DOI] [PubMed] [Google Scholar]; (b) Silvernail NJ, Barabanschikov A, Sage JT, Noll BC, Scheidt WR. J Am Chem Soc. 2009;131:2131. doi: 10.1021/ja8055613. [DOI] [PMC free article] [PubMed] [Google Scholar]
- 16.(a) Silvernail NJ, Pavlik JW, Noll BC, Schulz CE, Scheidt WR. Inorg Chem. 2008;47:912. doi: 10.1021/ic701700p. [DOI] [PMC free article] [PubMed] [Google Scholar]; (b) Silvernail NJ, Olmstead MM, Noll BC, Scheidt WR. Inorg Chem. 2009;48:971. doi: 10.1021/ic801617q. [DOI] [PMC free article] [PubMed] [Google Scholar]
- 17.Frisch MJ, Trucks GW, Schlegel HB, Scuseria GE, Robb MA, Cheeseman JR, Scalmani G, Barone V, Mennucci B, Petersson GA, Nakatsuji H, Caricato M, Li X, Hratchian HP, Izmaylov AF, Bloino J, Zheng G, Sonnenberg JL, Hada M, Ehara M, Toyota K, Fukuda R, Hasegawa J, Ishida M, Nakajima T, Honda Y, Kitao O, Nakai H, Vreven T, Montgomery JA, Jr, Peralta JE, Ogliaro F, Bearpark M, Heyd JJ, Brothers E, Kudin KN, Staroverov VN, Kobayashi R, Normand J, Raghavachari K, Rendell A, Burant JC, Iyengar SS, Tomasi J, Cossi M, Rega N, Millam JM, Klene M, Knox JE, Cross JB, Bakken V, Adamo C, Jaramillo J, Gomperts R, Stratmann RE, Yazyev O, Austin AJ, Cammi R, Pomelli C, Ochterski JW, Martin RL, Morokuma K, Zakrzewski VG, Voth GA, Salvador P, Dannenberg JJ, Dapprich S, Daniels AD, Farkas O, Foresman JB, Ortiz JV, Cioslowski J, Fox DJ. Gaussian 09 , Revision A.02. Gaussian, Inc; Wallingford CT: 2009. [Google Scholar]
- 18.Achterhold K, Keppler C, Ostermann A, Burck U, Sturhahn W, Alp EE, Parak FG. Phys Rev. 2002;E65:051916. doi: 10.1103/PhysRevE.65.051916. [DOI] [PubMed] [Google Scholar]
- 19.Merrick JP, Moran D, Radom L. J Phys Chem A. 2007;111:11683. doi: 10.1021/jp073974n. [DOI] [PubMed] [Google Scholar]
- 20.(a) Becke AD. Phys Rev. 1988;A38:3098. doi: 10.1103/physreva.38.3098. [DOI] [PubMed] [Google Scholar]; (b) Perdew JP. Phys Rev B. 1986;33:8822. doi: 10.1103/physrevb.33.8822. [DOI] [PubMed] [Google Scholar]
- 21.(a) Adamo C, Barone V. J Chem Phys. 1998;108:664. [Google Scholar]; (b) Perdew JP, Chevary JA, Vosko SH, Jackson KA, Pederson MR, Singh DJ, Fiolhais C. Phys Rev B. 1992;46:6671. doi: 10.1103/physrevb.46.6671. [DOI] [PubMed] [Google Scholar]
- 22.(a) Becke AD. Phys Rev. 1988;A38:3098. doi: 10.1103/physreva.38.3098. [DOI] [PubMed] [Google Scholar]; (b) Becke AD. J Chem Phys. 1993;98:1372. [Google Scholar]; (c) Becke AD. J Chem Phys. 1993;98:5648. [Google Scholar]; (d) Lee C, Yang W, Parr RG. Phys Rev. 1988;B37:785. doi: 10.1103/physrevb.37.785. [DOI] [PubMed] [Google Scholar]
- 23.(a) Perdew JP, Burke K, Ernzerhof M. Phys Rev Lett. 1996;77:3865. doi: 10.1103/PhysRevLett.77.3865. [DOI] [PubMed] [Google Scholar]; (b) Perdew JP, Burke K, Ernzerhof M. Phys Rev Lett. 1997;78:1396. doi: 10.1103/PhysRevLett.77.3865. [DOI] [PubMed] [Google Scholar]
- 24.Zhao Y, Truhlar DG. Theor Chem Acc. 2008;120:215. [Google Scholar]
- 25.Zhao Y, Truhlar DG. J Chem Phys. 2006;125:194101, 1. doi: 10.1063/1.2370993. [DOI] [PubMed] [Google Scholar]
- 26.Iikura H, Tsuneda T, Yanai T, Hirao K. J Chem Phys. 2001;115:3540. [Google Scholar]
- 27.Chai J-D, Head-Gordon M. Phys Chem Chem Phys. 2008;10:6615. doi: 10.1039/b810189b. [DOI] [PubMed] [Google Scholar]
- 28.The basis sets can be found in the following references: (Hay PJ, Wadt WR. J Chem Phys. 1985;82:270–283. Ibid, 82, 299.Wadt WR, Hay PJ. J Chem Phys. 1985;82:284.Schafer A, Horn H, Ahlrichs RJ. J Phys Chem. 1992;97:2571.Schafer A, Huber C, Ahlrichs R. J Chem Phys. 1994;100:5829.
- 29.Sage JT, Paxson C, Wyllie GRA, Sturhahn W, Durbin SM, Champion PM, Alp EE, Scheidt WR. J Phys Condens Matter. 2001;13:7707. [Google Scholar]
- 30.Li JF, Peng Q, Barabanschikov A, Pavlik JW, Alp EE, Sturhahn W, Zhao J, Schulz CE, Sage JT, Scheidt WR. Chem Eur J. 2011;17:11178. doi: 10.1002/chem.201101352. [DOI] [PMC free article] [PubMed] [Google Scholar]
- 31.Jacquemin D, Prepete EA, Ciofini I, Adamo C, Valero R, Zhao Y, Truhlar DG. J Chem Theory Comput. 2010;6:2071. doi: 10.1021/ct100119e. [DOI] [PubMed] [Google Scholar]
Associated Data
This section collects any data citations, data availability statements, or supplementary materials included in this article.


