

Abstract
Obese and underweight women who develop breast cancer may have poorer survival compared to normal-weight women. However, the optimal weight for best prognosis is still under study. We conducted a prospective investigation of pre-diagnosis body mass index (BMI) and mortality among 14,948 breast cancer patients in the After Breast Cancer Pooling Project. Breast cancer patients diagnosed from 1990-2006 with AJCC Stage I-III breast tumors were drawn from four prospective cohorts. Hazard ratios (HR) and 95% confidence intervals (CI) representing the associations of BMI categories (World Health Organization international classifications) with recurrence and mortality were estimated using delayed entry Cox proportional hazards models. Obese (30-<35 kg/m2), severely obese (35-<40 kg/m2), and morbidly obese (≥40 kg/m2) were examined. After a mean follow-up of 7.8 years, 2,140 deaths and 2,065 recurrences were documented. Both underweight (HR=1.59; 95% CI: 1.18, 2.13) and morbidly obese women (HR=1.81; 95% CI: 1.42, 2.32) had the greatest risk of overall mortality compared to normal-weight (18.5-24.9 kg/m2) women. Severe obesity (HR=1.09; 95% CI: 0.88, 1.36) and obesity (HR=1.11; 95% CI: 0.97, 1.27) were related to small, non-significant increased risks. Overweight (25.0-29.9 kg/m2) was not associated with any excess risk compared to normal weight. Similar associations were found for breast cancer death and non-breast cancer death but not recurrence. Women who were underweight and morbidly obese before breast cancer diagnosis were at the greatest risk of all-cause mortality. Morbidly obese women were also at increased risk of death from breast cancer. These results suggest that degree of obesity confers differential risk on survival.
Keywords: body mass index, weight, obesity, breast cancer, survival, prognosis, mortality
Introduction
Substantial evidence suggests that obese women have poorer survival after a breast cancer diagnosis compared to normal-weight women [1-8]. However, the degree of obesity associated with reduced survival and the relationship of obesity with breast cancer recurrence remains unclear [4, 6, 9, 10]. Furthermore, reports suggest that the association of body mass index (BMI) with breast cancer outcomes may be U- or J-shaped [11-13], thus emphasizing the need to examine associations for underweight and severely obese women separately.
We conducted a pooled investigation of pre-diagnosis BMI and breast cancer recurrence and death, non-breast cancer death, and overall death using data from 14,948 breast cancer survivors in the After Breast Cancer Pooling Project (ABCPP). We also examined potential effect modification by a priori selected factors including menopausal status, hormone receptor status, chemotherapy, comorbidity, and smoking.
Patients and Methods
The After Breast Cancer Pooling Project
The ABCPP is an international collaboration pooling data from four prospective studies of breast cancer survivors established to examine the roles of physical activity, adiposity, dietary factors, supplement use, and quality of life in breast cancer prognosis. Details regarding cohort creation and characteristics have been previously published [14]. Briefly, the ABCPP includes data on 18,333 breast cancer survivors diagnosed with stage I-IV invasive breast cancer from four population-based prospective cohort studies recruited from multiple US sites and Shanghai, China. Three of the cohorts specifically recruited breast cancer patients: the Shanghai Breast Cancer Survival Study (SBCSS) [15], the Life after Cancer Epidemiology (LACE) Study [16], and the Women's Healthy Eating and Living (WHEL) Study [17]. The fourth cohort included breast cancer patients diagnosed in the Nurses' Health Study (NHS), a prospective study of female nurses [18]. Each cohort collected data on clinical factors, reproductive factors, family history of breast cancer, quality of life, medical history, anthropometry, smoking history, alcohol intake, supplement use, physical activity, and diet. In the ABCPP, these data have been harmonized into a common dataset. Individual cohort investigators received Institutional Review Board (IRB) approval from their respective institution(s) to participate in this collaboration.
Data Collection of Body Mass Index and Covariates
Body mass index
Pre-diagnosis weight between one to two years before breast cancer diagnosis and height were self-reported by participants at baseline (entry into cohort for SBCSS, LACE, and WHEL) or regular follow-up prior to diagnosis (NHS). In the SBCSS, height was measured by an interviewer at baseline.
Sociodemographic and lifestyle factors
Data included race/ethnicity (Non-Hispanic White, Non-Hispanic Black, Asian, Hispanic, Other), education (< high school, high school, some college, college graduate), smoking history at diagnosis (never, past, current), and weight at age 18 or 20. Menopausal status at diagnosis (premenopausal, postmenopausal, unknown) was available for LACE, WHEL, and NHS; SBCSS assessed menopausal status approximately six months after diagnosis. Post-diagnosis recreational physical activity in metabolic equivalents (MET-hours/week) was determined from semi-quantitative questionnaires.
Clinical characteristics
Data included age at diagnosis (years), AJCC stage (I, II, III, IV), estrogen receptor (ER)/progesterone receptor (PR) status (ER+/PR+, ER+/PR-, ER-/PR+, ER-/PR-), surgery (none, lumpectomy, mastectomy, unknown), chemotherapy (no, yes), radiation therapy (no, yes), hormonal therapy (no, yes), and any comorbidity (diabetes, hypertension, myocardial infarction [MI ], stroke). However, WHEL did not collect information on MI and stroke.
Ascertainment of Outcomes
All studies ascertained outcome events by self-report and regular linkage to electronic medical records and vital statistics registries. Reported events were verified by medical record review except for self-report of recurrences in the NHS. Cause of death was determined from death certificates and supplemented with medical records if necessary. Details regarding outcome ascertainment have been published [14].
Analytic outcomes were a new breast cancer event (hereafter referred to as recurrence), death due to breast cancer, death due to non-breast cancer causes, and all-cause mortality. Recurrence was defined as recurrence/metastasis or new primary breast cancer. New primary breast cancers were longitudinally recorded in all cohorts except for the NHS, which did not assess breast cancer recurrences among breast cancer patients until 2000. For NHS participants who did not report a recurrence but died from breast cancer (7.2%), the date of recurrence was set at two years prior to the date of death [19].
Final Analytic Sample Size
Women were excluded from the analysis if they were diagnosed before 1990 to ensure comparable diagnosis dates and treatment information across the cohorts (n=2,965 NHS cases), had stage IV breast cancer (n=154), or had no pre-diagnosis BMI data or follow-up time (n=266). A total of 14,948 breast cancer survivors comprised the final analytic sample size.
Statistical Analysis
Pre-diagnosis BMI was calculated as weight in kilograms (kg) divided by height in meters squared (m2) and categorized into a four-level and six-level BMI variable using the World Health Organization international classifications [20, 21]. The four-level variable was underweight (<18.5 kg/m2), normal weight (18.5-24.9 kg/m2), overweight (25.0-29.9 kg/m2), and obese (≥30.0 kg/m2). The six-level variable further subdivided women with BMI ≥30.0 kg/m2 into: obese (30.0-34.9 kg/m2), severely obese (35.0-39.9 kg/m2), and morbidly obese (≥40 kg/m2). Normal-weight women comprised the reference group.
Sociodemographic, lifestyle, and clinical characteristics of the overall pooled cohort and by pre-diagnosis BMI category were summarized by frequency distributions for categorical variables and means with standard deviations (SD) for continuous variables.
The multivariable analysis involved three steps. First, delayed entry Cox proportional hazards regression models with time since diagnosis as the time scale were used to estimate study-specific adjusted hazard ratios (HRs) and 95% confidence intervals (CIs). The entry date was the date of the first survey after breast cancer diagnosis. For models with breast cancer recurrence as the outcome, the exit date was date of recurrence or date of death, or date of last contact for women without an event. For models with mortality as the outcome, the exit date was the date of death or date of last contact (i.e., date of last follow-up survey or date of last registry linkage, whichever was most recent). Second, a meta-analysis was conducted with study-specific HRs using inverse-variance weights in random-effects models [22]. The Q test statistic was used to test for heterogeneity in risk estimates across studies [23]. Evidence for heterogeneity by study was not observed (P>0.05); hence, pooled analyses were conducted and presented herein for the BMI-outcome associations of interest using delayed entry Cox proportional hazards regression models stratified by study.
Age at diagnosis, AJCC stage, race/ethnicity, education, menopausal status around diagnosis, hormone receptor status, surgery, treatment, smoking, physical activity, and comorbidity were retained in the final models. Covariates for the final model were chosen based on a priori determination from literature review or if a covariate produced a 10% change in the main effect estimate when the covariate was added individually to the Cox model [24]. Possible effect modification was evaluated in the associations between BMI and breast cancer outcomes by menopausal status (premenopausal vs. postmenopausal), hormone receptor status (ER+ and/or PR+ vs. ER- and PR-), chemotherapy (yes vs. no), comorbidity (yes vs. no), and smoking (ever vs. never). Statistical significance of multiplicative interaction terms was estimated with the Wald test by including a cross-product term of the exposure and the potential effect modifier in the Cox models.
Non-linear trends of BMI associated with each outcome were evaluated non-parametrically with restricted cubic splines and tested using the likelihood ratio test comparing the model with the linear and cubic spline terms to the model with only the linear term [25].
Results
Over a mean follow-up of 7.8 years, a total of 2,065 recurrences and 2,140 deaths were confirmed (1,423 deaths due to breast cancer, 717 deaths due to other causes). Mean time (range) from index diagnosis to recurrence and death were 4.7 (3.2-15.7) years and 6.0 (0.3, 17.2) years, respectively.
Table 1 gives characteristics of the pooled cohort by pre-diagnosis BMI. The mean age of breast cancer diagnosis was 57.3 years, and 65.1% were postmenopausal around diagnosis. Almost 87% of women were diagnosed with stage I or stage II tumors, and nearly 80% of the tumors were ER+ and/or PR+. The mean pre-diagnosis BMI was 25.7 kg/m2; 30.1% were overweight, 11.0% obese, 3.5% severely obese, and 1.8% morbidly obese. The distribution of clinical characteristics varied significantly across BMI categories, except for tumor stage (p=0.42). Compared to normal-weight women, obese women were more likely to be non-Hispanic white, college-educated, postmenopausal, less physically active, older at diagnosis, and a past or current smoker. They were more likely to have had radiation therapy and hormonal therapy, less likely to have had chemotherapy, and more likely to have a history of diabetes, hypertension, and/or CVD. In contrast, underweight women were more likely to be Asian, less educated, premenopausal, younger at diagnosis, and a non-smoker compared to normal-weight women. They were also less likely to have had radiation therapy and hormonal therapy, and to have a comorbid condition.
Table 1. Characteristics of the After Breast Cancer Pooling Project (ABCPP) cohort by pre-diagnosis BMI (4-level).
| Overall Cohort n=14,948 | WHO BMI Categories (4-level)a | |||||||||
|---|---|---|---|---|---|---|---|---|---|---|
|
| ||||||||||
| Underweight (<18.5 kg/m2) | Normal (18.5-24.9 kg/m2) | Overweight(25.0-29.9 kg/m2) | Obese (≥30.0 kg/m2) | |||||||
| (n=288) | (n=7,716) | (n=4,504) | (n=2,440) | |||||||
|
| ||||||||||
| Characteristicsb | n | (%) | n | (%) | n | (%) | n | (%) | n | (%) |
| Age at Diagnosis, mean (SD) | 57.3 (10.8) | 53.0 (13.1) | 55.2 (10.8) | 59.5 (10.2) | 60.3 (9.6) | |||||
| Race/Ethnicity | ||||||||||
| Non-Hispanic White | 8,915 | (59.7) | 108 | (37.5) | 4,106 | (53.2) | 2,791 | (62.0) | 1,910 | (78.3) |
| Non-Hispanic Black | 295 | (2.0) | 2 | (0.7) | 76 | (1.0) | 101 | (2.2) | 116 | (4.8) |
| Asian | 5,099 | (34.1) | 175 | (60.8) | 3,272 | (42.4) | 1,383 | (30.7) | 269 | (11.0) |
| Hispanic | 352 | (2.4) | 1 | (0.3) | 138 | (1.8) | 121 | (2.7) | 92 | (3.8) |
| Other | 284 | (1.9) | 2 | (0.7) | 122 | (1.6) | 107 | (2.4) | 53 | (2.2) |
| Education | ||||||||||
| Less than high school | 2,391 | (16.0) | 47 | (16.3) | 1,377 | (17.9) | 755 | (16.8) | 212 | (8.7) |
| High school | 2,747 | (18.4) | 97 | (33.7) | 1,626 | (21.1) | 706 | (15.7) | 318 | (13.0) |
| Some college | 2,195 | (14.7) | 32 | (11.1) | 1,069 | (13.9) | 652 | (14.5) | 442 | (18.1) |
| College grad or higher | 7,609 | (50.9) | 112 | (38.9) | 3,641 | (47.2) | 2,388 | (53.1) | 1,468 | (60.2) |
| Menopausal Status at Diagnosis | ||||||||||
| Premenopausal | 4,687 | (31.4) | 144 | (50.0) | 3,059 | (39.6) | 1,051 | (23.3) | 433 | (17.7) |
| Postmenopausal | 9,725 | (65.1) | 140 | (48.6) | 4,400 | (57.0) | 3,308 | (73.4) | 1,877 | (76.9) |
| Unknown | 536 | (3.6) | 4 | (1.4) | 257 | (3.3) | 145 | (3.2) | 130 | (5.3) |
| AJCC Stage | ||||||||||
| I | 6,738 | (46.4) | 133 | (48.0) | 3,462 | (46.3) | 2,061 | (47.2) | 1,082 | (45.3) |
| II | 5,865 | (40.4) | 107 | (38.6) | 3,063 | (41.0) | 1,718 | (39.3) | 977 | (40.9) |
| III | 1,903 | (13.1) | 37 | (13.4) | 947 | (12.7) | 592 | (13.5) | 327 | (13.7) |
| Hormone Receptor Status | ||||||||||
| ER+, PR+ | 8,605 | (60.4) | 149 | (53.8) | 4,349 | (58.8) | 2,600 | (60.8) | 1,507 | (65.7) |
| ER-, PR+ | 654 | (4.6) | 15 | (5.4) | 376 | (5.1) | 193 | (4.5) | 70 | (3.1) |
| ER+, PR- | 2,024 | (14.2) | 38 | (13.7) | 1,089 | (14.7) | 627 | (14.7) | 270 | (11.8) |
| ER-, PR- | 2,959 | (20.8) | 75 | (27.1) | 1,580 | (21.4) | 856 | (20.0) | 448 | (19.5) |
| Chemotherapy | ||||||||||
| No | 5,077 | (34.7) | 72 | (25.6) | 2,286 | (30.1) | 1,659 | (37.8) | 1,060 | (44.7) |
| Yes | 9,563 | (65.3) | 209 | (74.4) | 5,314 | (69.9) | 2,730 | (62.2) | 1,310 | (55.3) |
| Radiation Therapy | ||||||||||
| No | 7,082 | (48.2) | 164 | (57.7) | 3,854 | (50.6) | 2,071 | (46.9) | 993 | (41.7) |
| Yes | 7,621 | (51.8) | 120 | (42.3) | 3,767 | (49.4) | 2,346 | (53.1) | 1,388 | (58.3) |
| Hormonal Therapy | ||||||||||
| No | 4,861 | (33.2) | 126 | (44.5) | 2,629 | (34.6) | 1,435 | (32.7) | 671 | (28.3) |
| Yes | 9,788 | (66.8) | 157 | (55.5) | 4,968 | (65.4) | 2,960 | (67.3) | 1,703 | (71.7) |
| Surgery | ||||||||||
| None | 33 | (0.2) | 1 | (0.4) | 16 | (0.2) | 9 | (0.2) | 7 | (0.3) |
| Lumpectomy | 5,045 | (34.3) | 44 | (15.5) | 2,253 | (29.5) | 1,627 | (36.8) | 1,121 | (47.0) |
| Mastectomy | 9,389 | (63.8) | 219 | (77.1) | 5,188 | (68.0) | 2,731 | (61.8) | 1,251 | (52.4) |
| Other | 248 | (1.7) | 20 | (7.0) | 168 | (2.2) | 53 | (1.2) | 7 | (0.3) |
| Smoking History | ||||||||||
| Never | 9,554 | (64.2) | 218 | (76.2) | 5,211 | (67.8) | 2,784 | (62.0) | 1,341 | (55.2) |
| Past | 4,573 | (30.7) | 45 | (15.7) | 2,068 | (26.9) | 1,489 | (33.2) | 971 | (40.0) |
| Current | 761 | (5.1) | 23 | (8.0) | 403 | (5.2) | 218 | (4.9) | 117 | (4.8) |
| Any Comorbidity | ||||||||||
| No | 9,098 | (63.8) | 228 | (81.7) | 5,515 | (74.8) | 2,421 | (56.3) | 934 | (40.4) |
| Yes | 5,170 | (36.2) | 51 | (18.3) | 1,859 | (25.2) | 1,883 | (43.8) | 1,377 | (59.6) |
| Post-diagnosis Physical Activity (≥10 MET-hours/week) | ||||||||||
| No | 5,914 | (49.2) | 129 | (54.9) | 2,825 | (44.3) | 1,826 | (50.6) | 1,134 | (62.6) |
| Yes | 6,110 | (50.8) | 106 | (45.1) | 3,546 | (55.7) | 1,780 | (49.4) | 678 | (37.4) |
| Pre-diagnosis BMI (6-level) | ||||||||||
| Underweight(<18.5 kg/m2) | 288 | (1.9) | 288 | (100.0) | 0 | (0.0) | 0 | (0.0) | 0 | (0.0) |
| Normal(18.5-24.9 kg/m2) | 7,716 | (51.6) | 0 | (0.0) | 7,716 | (100.0) | 0 | (0.0) | 0 | (0.0) |
| Overweight(25.0-29.9 kg/m2) | 4,504 | (30.1) | 0 | (0.0) | 0 | (0.0) | 4,504 | (100.0) | 0 | (0.0) |
| Obese(30.0-34.9 kg/m2) | 1,642 | (11.0) | 0 | (0.0) | 0 | (0.0) | 0 | (0.0) | 1,642 | (67.3) |
| Severely obese(35.0-39.9 kg/m2) | 530 | (3.5) | 0 | (0.0) | 0 | (0.0) | 0 | (0.0) | 530 | (21.7) |
| Morbidly obese(≥40 kg/m2) | 268 | (1.8) | 0 | (0.0) | 0 | (0.0) | 0 | (0.0) | 268 | (11.0) |
| Pre-diagnosis BMI, mean (SD) | 25.6 (5.1) | 17.6 (0.8) | 22.3 (1.7) | 27.1 (1.4) | 34.5 (4.5) | |||||
BMI was calculated from self-reported pre-diagnosis weight within one year before breast cancer diagnosis and height at time of the baseline/first post-diagnosis survey, and categorized using the World Health Organization (WHO) international classifications.20,21
The distribution of all characteristics were statistically significantly different across pre-diagnosis BMI categories (P<0.05), except for AJCC Stage (P=0.43).
Table 2 gives the associations between the four-level pre-diagnosis BMI and breast cancer outcomes in the overall pooled analysis. Both underweight and obese women had a statistically significant increased risk of overall death compared to normal-weight women (underweight HR=1.59; 95% CI: 1.18, 2.13; obese HR=1.17; 95% CI: 1.04, 1.32). Similar elevated risks for underweight and obese were found for non-breast cancer death, yet no associations were observed for breast cancer death and recurrence. Compared to normal weight, overweight was not associated with increased risk of any outcome.
Table 2. Association of pre-diagnosis BMI (4-level) and breast cancer outcomes in the ABCPP.
| n | events | HRa | 95% CIa | |
|---|---|---|---|---|
| Recurrence | ||||
| Underweight (<18.5 kg/m2) | 287 | 40 | 1.02 | (0.72, 1.45) |
| Normal (18.5-24.9 kg/m2) | 7,688 | 1,148 | Ref | --- |
| Overweight (25.0-29.9 kg/m2) | 4,475 | 732 | 1.06 | (0.95, 1.17) |
| Obese (≥30.0 kg/m2) | 2,428 | 434 | 1.06 | (0.94, 1.21) |
| Breast Cancer Mortality | ||||
| Underweight (<18.5 kg/m2) | 288 | 30 | 1.33 | (0.92, 1.92) |
| Normal (18.5-24.9 kg/m2) | 7,716 | 696 | Ref | --- |
| Overweight (25.0-29.9 kg/m2) | 4,504 | 436 | 1.04 | (0.92, 1.18) |
| Obese (≥30.0 kg/m2) | 2,440 | 276 | 1.10 | (0.95, 1.28) |
| Non-Breast Cancer Mortality | ||||
| Underweight (<18.5 kg/m2) | 288 | 17 | 2.12 | (1.29, 3.47) |
| Normal (18.5-24.9 kg/m2) | 7,716 | 288 | Ref | --- |
| Overweight (25.0-29.9 kg/m2) | 4,504 | 224 | 0.99 | (0.83, 1.18) |
| Obese (≥30.0 kg/m2) | 2,440 | 199 | 1.33 | (1.10, 1.62) |
| Total Mortality | ||||
| Underweight (<18.5 kg/m2) | 288 | 47 | 1.59 | (1.18, 2.13) |
| Normal (18.5-24.9 kg/m2) | 7,716 | 984 | Ref | --- |
| Overweight (25.0-29.9 kg/m2) | 4,504 | 660 | 1.01 | (0.91, 1.12) |
| Obese (≥30.0 kg/m2) | 2,440 | 475 | 1.17 | (1.04, 1.32) |
Adjusted for age at diagnosis, AJCC stage, race/ethnicity, education, menopausal status, hormone receptor status, surgery, chemotherapy, radiation therapy, hormonal therapy, smoking, comorbidity, and physical activity
When examining the finer obesity categories of obese, severely obese, and morbidly obese in a six-level BMI variable (Table 3), morbidly obese women had the greatest risk of all death outcomes (overall death HR=1.81; 95% CI: 1.42, 2.32; non- breast cancer death HR=3.01; 95% CI: 2.09, 4.33; breast cancer death HR=1.40; 95% CI: 1.00, 1.96) compared to normal-weight women. Severe obesity was also associated with increased risk of non- breast cancer death (HR=1.40; 95% CI: 1.02, 1.92) but not overall death (HR=1.09; 95% CI: 0.88, 1.36) compared to normal weight. Non-linear associations were observed for BMI and total death (P for non-linear relation=0.025) and non-breast cancer death (P for non-linear relation=0.0005) but not for BMI and breast cancer death (P for non-linear relation=0.97) (Figure 1).
Table 3. Association of pre-diagnosis BMI with additional obesity categories and breast cancer outcomes in the ABCPP.
| n | Events | HRa | 95% CIa | |
|---|---|---|---|---|
| Recurrence | ||||
| Underweight (<18.5 kg/m2) | 287 | 40 | 1.02 | (0.72, 1.45) |
| Normal (18.5-24.9 kg/m2) | 7,688 | 1,148 | Ref | --- |
| Overweight (25.0-29.9 kg/m2) | 4,475 | 732 | 1.06 | (0.95, 1.17) |
| Obese (30.0-34.9 kg/m2) | 1,631 | 297 | 1.09 | (0.94, 1.26) |
| Severely obese(35.0-39.9 kg/m2) | 529 | 81 | 0.92 | (0.72, 1.17) |
| Morbidly obese(≥40 kg/m2) | 268 | 56 | 1.21 | (0.91, 1.62) |
| Breast Cancer Mortality | ||||
| Underweight (<18.5 kg/m2) | 288 | 30 | 1.33 | (0.92, 1.92) |
| Normal (18.5-24.9 kg/m2) | 7,716 | 696 | Ref | --- |
| Overweight (25.0-29.9 kg/m2) | 4,504 | 436 | 1.04 | (0.92, 1.18) |
| Obese (30.0-34.9 kg/m2) | 1,642 | 188 | 1.12 | (0.94, 1.32) |
| Severely obese(35.0-39.9 kg/m2) | 530 | 50 | 0.92 | (0.68, 1.24) |
| Morbidly obese(≥40 kg/m2) | 268 | 38 | 1.40 | (1.00, 1.96) |
| Non-Breast Cancer Mortality | ||||
| Underweight (<18.5 kg/m2) | 288 | 17 | 2.10 | (1.28, 3.44) |
| Normal (18.5-24.9 kg/m2) | 7,716 | 288 | Ref | --- |
| Overweight (25.0-29.9 kg/m2) | 4,504 | 224 | 0.99 | (0.83, 1.18) |
| Obese (30.0-34.9 kg/m2) | 1,642 | 114 | 1.13 | (0.90, 1.42) |
| Severely obese(35.0-39.9 kg/m2) | 530 | 49 | 1.40 | (1.02, 1.92) |
| Morbidly obese(≥40 kg/m2) | 268 | 36 | 3.01 | (2.09, 4.33) |
| Total Mortality | ||||
| Underweight (<18.5 kg/m2) | 288 | 47 | 1.58 | (1.18, 2.13) |
| Normal (18.5-24.9 kg/m2) | 7,716 | 984 | Ref | --- |
| Overweight (25.0-29.9 kg/m2) | 4,504 | 660 | 1.01 | (0.91, 1.12) |
| Obese (30.0-34.9 kg/m2) | 1,642 | 302 | 1.11 | (0.97, 1.27) |
| Severely obese(35.0-39.9 kg/m2) | 530 | 99 | 1.09 | (0.88, 1.36) |
| Morbidly obese(≥40 kg/m2) | 268 | 74 | 1.81 | (1.42, 2.32) |
Adjusted for age at diagnosis, AJCC stage, race/ethnicity, education, menopausal status, hormone receptor status, surgery, chemotherapy, radiation therapy, hormonal therapy, smoking, comorbidity, and physical activity
Figure 1.
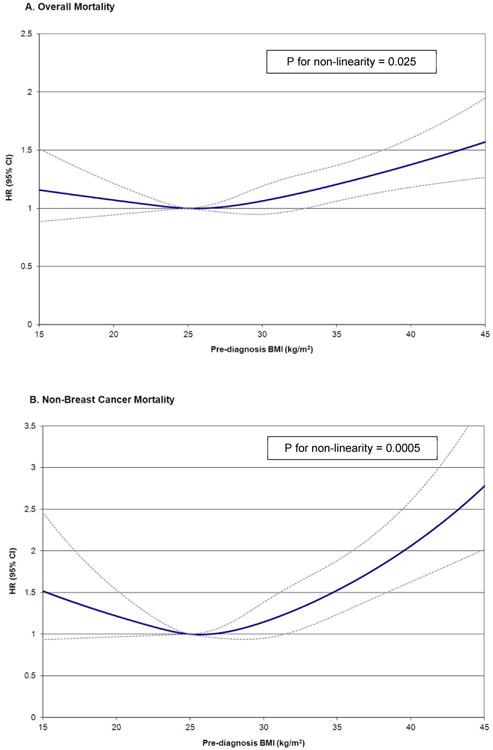
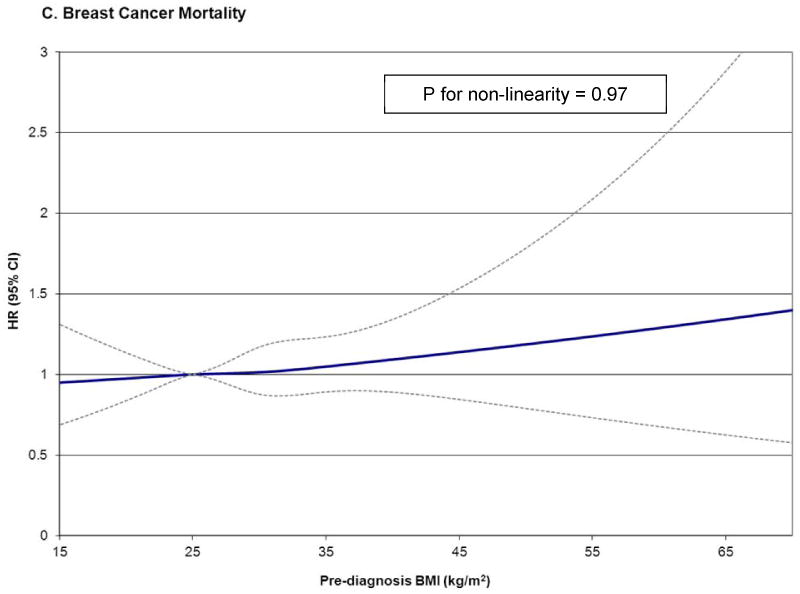
HR and 95% CI for prediagnosis BMI and overall mortality (a), non-breast cancer mortality (b), and breast cancer mortality (c) using restricted cubic splines with knots at 22.5, 25.0, 30.0, 35.0 kg/m2, and 25.0 kg/m2 as the reference level in the ABCPP. Models adjusted for age at diagnosis, AJCC stage, race/ethnicity, education, menopausal status, hormone receptor status, surgery, chemotherapy, radiation therapy, hormonal therapy, smoking, comorbidity, and physical activity.
Analyses of pre-diagnosis BMI and overall mortality stratified by menopausal status, hormone receptor status, comorbidity history, and smoking history are provided in Table 4. In all analyses, no significant effect modification was observed (all P>0.05). Similar elevated risks for underweight and obese women were found for overall death in both premenopausal and postmenopausal groups, as well as the hormone receptor positive (ER+ and/or PR+) and negative (ER- and PR-) groups. In women with a history of comorbidity, being either underweight or obese was associated with increased risk of overall death (underweight HR=1.58; 95% CI: 0.88, 2.84; obese HR=1.19; 95% CI: 1.00, 1.41). However, in women without any comorbidity, the risk appeared to be confined to only the underweight women (HR=1.50; 95% CI: 1.05, 2.13) and not the obese women (HR=1.09; 95% CI: 0.91, 1.32). Similarly, among women who ever smoked, being either underweight or obese was associated with elevated risk of overall death (underweight HR=1.81; 95% CI: 1.12, 2.92; obese HR=1.26; 95% CI: 1.97, 1.48). However, among women who never smoked, the risk remained for underweight women (HR=1.50; 95% CI: 1.02, 2.19) but was attenuated for obese women (HR=1.10; 95% CI: 0.93, 1.30). Being overweight was not associated with mortality in any stratum-specific analysis. Associations were also similar stratified by receipt of chemotherapy (not shown).
Table 4. Association of pre-diagnosis BMI(4-level) and total mortality, stratified by key covariates, in the ABCPP.
| n | Events | HRa | 95% CIa | Events | HRa | 95% CIa | |||||
|---|---|---|---|---|---|---|---|---|---|---|---|
| Premenopausal | Postmenopausal | ||||||||||
|
|
|||||||||||
| Underweight | 288 | 17 | 1.32 | (0.79, 2.19) | 28 | 1.48 | (1.01, 2.17) | ||||
| Normal | 7,716 | 298 | Ref | --- | 648 | Ref | --- | ||||
| Overweight | 4,504 | 121 | 1.07 | (0.86, 1.33) | 523 | 1.01 | (0.90, 1.14) | ||||
| Obese | 2,440 | 73 | 1.29 | (0.98, 1.69) | 375 | 1.16 | (1.01, 1.33) | ||||
| P for interaction | 0.99 | ||||||||||
| ER+ and/or PR+ | ER- and PR- | ||||||||||
|
|
|||||||||||
| Underweight | 288 | 32 | 1.72 | (1.20, 2.46) | 11 | 1.29 | (0.70, 2.38) | ||||
| Normal | 7,716 | 689 | Ref | --- | 230 | Ref | --- | ||||
| Overweight | 4,504 | 462 | 0.99 | (0.88, 1.12) | 148 | 1.03 | (0.83, 1.28) | ||||
| Obese | 2,440 | 334 | 1.14 | (0.99, 1.31) | 97 | 1.22 | (0.94, 1.60) | ||||
| P for interaction | 0.88 | ||||||||||
| Yes Comorbidity | No Comorbidity | ||||||||||
|
|
|||||||||||
| Underweight | 288 | 12 | 1.58 | (0.88, 2.84) | 33 | 1.50 | (1.05, 2.13) | ||||
| Normal | 7,716 | 298 | Ref | --- | 634 | Ref | --- | ||||
| Overweight | 4,504 | 321 | 1.05 | (0.90, 1.24) | 305 | 0.98 | (0.85, 1.12) | ||||
| Obese | 2,440 | 292 | 1.19 | (1.00, 1.41) | 149 | 1.09 | (0.91, 1.32) | ||||
| P for interaction | 0.61 | ||||||||||
| EverSmoked | NeverSmoked | ||||||||||
|
|
|||||||||||
| Underweight | 288 | 18 | 1.81 | (1.12, 2.92) | 28 | 1.50 | (1.02, 2.19) | ||||
| Normal | 7,716 | 415 | Ref | --- | 553 | Ref | --- | ||||
| Overweight | 4,504 | 316 | 1.07 | (0.92, 1.24) | 339 | 0.96 | (0.84, 1.11) | ||||
| Obese | 2,440 | 238 | 1.26 | (1.07, 1.48) | 230 | 1.10 | (0.93, 1.30) | ||||
| P for interaction | 0.70 | ||||||||||
Adjusted for age at diagnosis, AJCC stage, race/ethnicity, education, menopausal status, hormone receptor status,surgery, chemotherapy, radiation therapy, hormonal therapy, smoking, comorbidity, and physical activity. Each stratified analysis did not adjust for stratification variable.
BMI 4-level: normal, 18.5-24.9 kg/m2; underweight, <18.5 kg/m2; overweight, 25.0-29.9 kg/m2; obese, ≥30.0 kg/m2.
As a sensitivity analysis, all models were run excluding the 34 women who died within the first year of diagnosis to rule out effects of any underlying disease, and results were unchanged. Additionally, to address any residual confounding resulting from over half (59.4%) of the underweight women in the pooled analysis originating from the SBCSS, all models were run excluding the SBCSS cohort, and results were also unchanged.
Discussion
In this large pooling analysis of 14,948 breast cancer survivors, the association between pre-diagnosis BMI and breast cancer outcomes, specifically overall death and non-breast cancer death, was U-shaped with both underweight and morbidly obese women being at higher risk. Compared to normal-weight women, morbidly obese women were on average at two-fold greater risk of all mortality outcomes. In general, the estimates did not differ by menopausal status, hormone receptor status, comorbidity history, smoking history, and receipt of chemotherapy. Across all analyses, overweight women (25.0-29.9 kg/m2) had similar risk of outcomes compared to normal-weight women. No significant associations were found for risk of recurrence. These results suggest that the association of obesity with poorer outcomes after breast cancer observed in previous studies may be driven predominantly by the relationship between morbid obesity (≥40 kg/m2) and mortality.
It has been previously suggested that the association of body size with breast cancer outcomes may be U- or J-shaped [11], particularly in ethnically diverse study populations [3, 6]. In two recent studies, being underweight/low-normal weight (<18.5 kg/m2 or <22.5 kg/m2) and obese (≥30 kg/m2) were both associated with increased risks of breast cancer recurrence and mortality compared to normal-weight ranges (18.5-24.9 kg/m2 and 22.5-24.9 kg/m2) while no elevated risk was observed in the overweight range (25.0-29.9 kg/m2). Similarly, in two large studies of 1.1 million Asians and nearly 900,000 Whites, U shaped associations of BMI with decreased all-cause mortality were observed in the ranges of 22.6-27.5 kg/m2 and 22.5-25.0 kg/m2, respectively [26, 27]. These BMI ranges lend support to our observation that normal or high-normal BMI before diagnosis might represent an ideal weight for healthy outcomes.
Several plausible biological mechanisms have been proposed to support the prognostic effects of obesity in breast cancer patients, yet they are primarily relevant to breast cancer-related outcomes. Studies have found that obese (compared to non-obese) postmenopausal women have higher circulating bioavailable estrogen that could fuel tumor regrowth and progression [28-30]. Obesity might also increase insulin and insulin–like growth factors (IGF-I, IGF-II), which are involved in the regulation of normal and malignant growth of epithelial breast cells [31, 32] and have been associated with greater distant recurrence and death in women with early stage breast cancer [12, 33]. Moreover, adipose tissue serves as an important endocrine organ by secreting obesity-related regulatory proteins (adipokines such as leptin and adiponectin) [34-36] and triggering obesity-related inflammatory cytokines (interleukins, C-reactive protein, and serum amyloid A) [37-39] that play a key role in proliferation, apoptosis, and/or migration of breast tumor cells. Both adipokines [40-42] and inflammatory cytokines [43-46] have been associated with breast cancer prognosis.
It is unclear why we observed a possible risk threshold by level of obesity, especially since level of obesity was not associated with tumor stage or hormone receptor status. However, we hypothesize that larger amounts of adipose tissue in the morbidly obese compared to the moderately obese might place a woman at even greater risk of poor outcomes via a constant imbalance in obesity-related regulatory proteins and inflammatory cytokines.
From the treatment perspective, obese women may be underdosed for chemotherapy due to toxicity-related concerns, resulting in reduced therapeutic response and worse outcomes [47-49]. However, when we stratified the obese women in our cohort by receipt of chemotherapy, no prognostic risk differences were observed by chemotherapy status. There is also emerging evidence that obesity can negatively impact the standard dose effectiveness of aromatase inhibitors (AIs), leading to poorer prognosis and survival [50, 51]. Nevertheless, we were unable to explore this potential pharmacotherapy issue among obese women due to only 8% of women being treated with AIs (8%).
The biological plausibility for underweight and prognosis has been less explored compared to the effects of obesity. Underweight could be an indicator of pre-existing comorbid conditions that have already placed these women at greater risk of poor outcomes. However, all our analyses were adjusted for comorbidity status, and when we stratified the cohort by presence and absence of comorbid conditions, risk estimates among underweight women did not differ by subgroup. Residual confounding by other unmeasured comorbidity is also possible since we only had pooled data on four common conditions (diabetes, hypertension, MI, and stroke). Smoking could also be an indicator of comorbidity as the NHS previously reported that underweight, middle-aged women without breast cancer who never smoked had no elevated risk of mortality [52]. However, when we stratified by smoking status in our analyses, the increased risk remained among the underweight non-smokers. A possible reason as to why no differential risk by smoking history was observed is that in our pooled cohort, three-quarters (76.2%) of the underweight women had never smoked and were from the SBCSS. Finally, underweight could be a marker for poor health and undernutrition. It has been suggested that inhibition or promotion of tumor progression may be controlled by immune cells [53, 54]. In patients with chronic undernutrition and micronutrient deficiency, cytokine reactions and the subsequent activation of the immune system are compromised, which may influence tumor development [55, 56].
Strengths of this pooled study include being the largest to date of prospective breast cancer survivors, thus enabling our ability to explore finer BMI categories, particularly in the higher obesity range. To our knowledge, the role of extreme obesity (≥35 kg/m2) on outcomes after breast cancer has not been explored. We were able to adjust for most potentially important prognostic and treatment-related factors, including smoking, hormone receptor status, comorbidity, treatment, and menopausal status. Finally, pooling provided improved power to conduct stratified analyses by these key characteristics and to address reverse causality among the underweight women.
Limitations should also be considered. Pre-diagnosis weight was self-reported in all studies, yet measured weight is preferable to minimize recall bias and exposure misclassification. However, substantial agreement between self-reported weight and measured weight has been shown with the caveat that underreporting may be more common in well-educated white populations compared with minority populations [57]. Furthermore, self-reported weight was found to produce accurate disease risk estimates if adjusted for key sociodemographics [58]. Also, waist-hip-ratio, another measure of obesity, before diagnosis/at diagnosis was not uniformly available from all studies. Finally, we could not examine nutritional status (diet and supplements) at diagnosis since not all cohorts collected this information.
In conclusion, BMI prior to breast cancer diagnosis was associated with reduced survival among both underweight and morbidly obese women in this study of nearly 15,000 breast cancer survivors. Compared to women of normal-weight, overweight and moderately obese women had no increased mortality risk. These results underscore the strong prognostic influence of pre-diagnosis BMI on breast cancer outcomes and suggest that degree of obesity confers differential risk on survival.
Acknowledgments
Funding Source: ABCPP: 3R01CA118229-03S1, SBCSS: DAMD 17-02-1-0607, R01 CA118229 WHEL: KG100988 LACE: R01 CA129059 NHS: P01 CA87969
This work was supported by the National Cancer Institute (3R01CA118229-03S1). Funding for each individual cohort participating in the After Breast Cancer Pooling Project is as follows: The SBCSS was supported by the Department of Defense (DAMD 17-02-1-0607); and the National Cancer Institute (R01 CA118229). The WHEL Study was supported by the Susan G. Komen Foundation (#KG100988). The LACE Study was supported by the National Cancer Institute (R01 CA129059). The NHS was supported by the National Cancer Institute (P01 CA87969). We thank Dr. Shannon M. Conroy at the University of Hawaii Cancer Center for her expertise on creating the cubic spline curves.
Abbreviations
- ABCPP
After Breast Cancer Pooling Project
- SBCSS
Shanghai Breast Cancer Survival Study
- LACP
Life After Cancer Epidemiology
- WHEL
Women's Healthy Eating and Living
- NHS
Nurses' Health Study
- KPNC
Kaiser Permanente Northern California
- IRB
Institutional Review Board
- BMI
body mass index
- MET
metabolic equivalents
- MI
myocardial infarction
- ER
estrogen receptor
- PR
progesterone receptor
- HR
hazard ratio
- CI
confidence interval
References
- 1.Goodwin PJ, Boyd NF. Body size and breast cancer prognosis: a critical review of the evidence. Breast Cancer Res Treat. 1990;16(3):205–14. doi: 10.1007/BF01806329. [DOI] [PubMed] [Google Scholar]
- 2.Ryu SY, Kim CB, Nam CM, Park JK, Kim KS, Park J, Yoo SY, Cho KS. Is body mass index the prognostic factor in breast cancer?: a meta-analysis. J Korean Med Sci. 2001;16(5):610–4. doi: 10.3346/jkms.2001.16.5.610. [DOI] [PMC free article] [PubMed] [Google Scholar]
- 3.Conroy SM, Maskarinec G, Wilkens LR, White KK, Henderson BE, Kolonel LN. Obesity and breast cancer survival in ethnically diverse postmenopausal women: the Multiethnic Cohort Study. Breast Cancer Res Treat. 2011 doi: 10.1007/s10549-011-1468-4. [DOI] [PMC free article] [PubMed] [Google Scholar]
- 4.Ewertz M, Jensen MB, Gunnarsdottir KA, Hojris I, Jakobsen EH, Nielsen D, Stenbygaard LE, Tange UB, Cold S. Effect of obesity on prognosis after early-stage breast cancer. J Clin Oncol. 2011;29(1):25–31. doi: 10.1200/JCO.2010.29.7614. [DOI] [PubMed] [Google Scholar]
- 5.Protani M, Coory M, Martin JH. Effect of obesity on survival of women with breast cancer: systematic review and meta-analysis. Breast Cancer Res Treat. 2010;123(3):627–35. doi: 10.1007/s10549-010-0990-0. [DOI] [PubMed] [Google Scholar]
- 6.Chen X, Lu W, Zheng W, Gu K, Chen Z, Zheng Y, Shu XO. Obesity and weight change in relation to breast cancer survival. Breast Cancer Res Treat. 2010;122(3):823–33. doi: 10.1007/s10549-009-0708-3. [DOI] [PMC free article] [PubMed] [Google Scholar]
- 7.Patterson RE, Cadmus LA, Emond JA, Pierce JP. Physical activity, diet, adiposity and female breast cancer prognosis: a review of the epidemiologic literature. Maturitas. 2010;66(1):5–15. doi: 10.1016/j.maturitas.2010.01.004. [DOI] [PubMed] [Google Scholar]
- 8.Connolly BS, Barnett C, Vogt KN, Li T, Stone J, Boyd NF. A meta-analysis of published literature on waist-to-hip ratio and risk of breast cancer. Nutr Cancer. 2002;44(2):127–38. doi: 10.1207/S15327914NC4402_02. [DOI] [PubMed] [Google Scholar]
- 9.Ademuyiwa FO, Groman A, O'Connor T, Ambrosone C, Watroba N, Edge SB. Impact of body mass index on clinical outcomes in triple-negative breast cancer. Cancer. 2011 doi: 10.1002/cncr.26019. [DOI] [PubMed] [Google Scholar]
- 10.Goodwin PJ. Commentary on: “Effect of obesity on survival in women with breast cancer: systematic review and meta-analysis ” (Melinda Protani, Michael Coory, Jennifer H. Martin) Breast Cancer Res Treat. 2010;123(3):637–40. doi: 10.1007/s10549-010-1101-y. [DOI] [PubMed] [Google Scholar]
- 11.Suissa S, Pollak M, Spitzer WO, Margolese R. Body size and breast cancer prognosis: a statistical explanation of the discrepancies. Cancer Res. 1989;49(11):3113–6. [PubMed] [Google Scholar]
- 12.Goodwin PJ, Ennis M, Pritchard KI, Trudeau ME, Koo J, Madarnas Y, Hartwick W, Hoffman B, Hood N. Fasting insulin and outcome in early-stage breast cancer: results of a prospective cohort study. J Clin Oncol. 2002;20(1):42–51. doi: 10.1200/JCO.2002.20.1.42. [DOI] [PubMed] [Google Scholar]
- 13.Calle EE, Thun MJ, Petrelli JM, Rodriguez C, Heath CW., Jr Body-mass index and mortality in a prospective cohort of U.S. adults. N Engl J Med. 1999;341(15):1097–105. doi: 10.1056/NEJM199910073411501. [DOI] [PubMed] [Google Scholar]
- 14.Nechuta SJ, Caan BJ, Chen WY, Flatt SW, Lu W, Patterson RE, Poole EM, Kwan ML, Chen Z, Weltzien E, Pierce JP, Shu XO. The After Breast Cancer Pooling Project: rationale, methodology, and breast cancer survivor characteristics. Cancer Causes Control. 2011 doi: 10.1007/s10552-011-9805-9. [DOI] [PMC free article] [PubMed] [Google Scholar]
- 15.Shu XO, Zheng Y, Cai H, Gu K, Chen Z, Zheng W, Lu W. Soy food intake and breast cancer survival. Jama. 2009;302(22):2437–43. doi: 10.1001/jama.2009.1783. [DOI] [PMC free article] [PubMed] [Google Scholar]
- 16.Caan B, Sternfeld B, Gunderson E, Coates A, Quesenberry C, Slattery ML. Life After Cancer Epidemiology (LACE) Study: a cohort of early stage breast cancer survivors (United States) Cancer Causes Control. 2005;16(5):545–56. doi: 10.1007/s10552-004-8340-3. [DOI] [PubMed] [Google Scholar]
- 17.Pierce JP, Faerber S, Wright FA, Rock CL, Newman V, Flatt SW, Kealey S, Jones VE, Caan BJ, Gold EB, Haan M, Hollenbach KA, Jones L, Marshall JR, Ritenbaugh C, Stefanick ML, Thomson C, Wasserman L, Natarajan L, Thomas RG, Gilpin EA. A randomized trial of the effect of a plant-based dietary pattern on additional breast cancer events and survival: the Women's Healthy Eating and Living (WHEL) Study. Control Clin Trials. 2002;23(6):728–56. doi: 10.1016/s0197-2456(02)00241-6. [DOI] [PubMed] [Google Scholar]
- 18.Colditz GA, Hankinson SE. The Nurses' Health Study: lifestyle and health among women. Nat Rev Cancer. 2005;5(5):388–96. doi: 10.1038/nrc1608. [DOI] [PubMed] [Google Scholar]
- 19.Ernst MF, van de Poll-Franse LV, Roukema JA, Coebergh JW, van Gestel CM, Vreugdenhil G, Louwman MJ, Voogd AC. Trends in the prognosis of patients with primary metastatic breast cancer diagnosed between 1975 and 2002. Breast. 2007;16(4):344–51. doi: 10.1016/j.breast.2007.01.001. [DOI] [PubMed] [Google Scholar]
- 20.Appropriate body-mass index for Asian populations and its implications for policy and intervention strategies. Lancet. 2004;363(9403):157–63. doi: 10.1016/S0140-6736(03)15268-3. [DOI] [PubMed] [Google Scholar]
- 21.WHO BMI Classification http://apps.who.int/bmi/index.jsp?introPage=intro_3.html.
- 22.Smith-Warner SA, Spiegelman D, Ritz J, Albanes D, Beeson WL, Bernstein L, Berrino F, van den Brandt PA, Buring JE, Cho E, Colditz GA, Folsom AR, Freudenheim JL, Giovannucci E, Goldbohm RA, Graham S, Harnack L, Horn-Ross PL, Krogh V, Leitzmann MF, McCullough ML, Miller AB, Rodriguez C, Rohan TE, Schatzkin A, Shore R, Virtanen M, Willett WC, Wolk A, Zeleniuch-Jacquotte A, Zhang SM, Hunter DJ. Methods for pooling results of epidemiologic studies: the Pooling Project of Prospective Studies of Diet and Cancer. Am J Epidemiol. 2006;163(11):1053–64. doi: 10.1093/aje/kwj127. [DOI] [PubMed] [Google Scholar]
- 23.DerSimonian R, Laird N. Meta-analysis in clinical trials. Control Clin Trials. 1986;7(3):177–88. doi: 10.1016/0197-2456(86)90046-2. [DOI] [PubMed] [Google Scholar]
- 24.Mickey RM, Greenland S. The impact of confounder selection criteria on effect estimation. Am J Epidemiol. 1989;129(11):125–37. doi: 10.1093/oxfordjournals.aje.a115101. [DOI] [PubMed] [Google Scholar]
- 25.Durrleman S, Simon R. Flexible regression models with cubic splines. Stat Med. 1989;8(5):551–61. doi: 10.1002/sim.4780080504. [DOI] [PubMed] [Google Scholar]
- 26.Whitlock G, Lewington S, Sherliker P, Clarke R, Emberson J, Halsey J, Qizilbash N, Collins R, Peto R. Body-mass index and cause-specific mortality in 900 000 adults: collaborative analyses of 57 prospective studies. Lancet. 2009;373(9669):1083–96. doi: 10.1016/S0140-6736(09)60318-4. [DOI] [PMC free article] [PubMed] [Google Scholar]
- 27.Zheng W, McLerran DF, Rolland B, Zhang X, Inoue M, Matsuo K, He J, Gupta PC, Ramadas K, Tsugane S, Irie F, Tamakoshi A, Gao YT, Wang R, Shu XO, Tsuji I, Kuriyama S, Tanaka H, Satoh H, Chen CJ, Yuan JM, Yoo KY, Ahsan H, Pan WH, Gu D, Pednekar MS, Sauvaget C, Sasazuki S, Sairenchi T, Yang G, Xiang YB, Nagai M, Suzuki T, Nishino Y, You SL, Koh WP, Park SK, Chen Y, Shen CY, Thornquist M, Feng Z, Kang D, Boffetta P, Potter JD. Association between body-mass index and risk of death in more than 1 million Asians. N Engl J Med. 2011;364(8):719–29. doi: 10.1056/NEJMoa1010679. [DOI] [PMC free article] [PubMed] [Google Scholar]
- 28.McTiernan A, Rajan KB, Tworoger SS, Irwin M, Bernstein L, Baumgartner R, Gilliland F, Stanczyk FZ, Yasui Y, Ballard-Barbash R. Adiposity and sex hormones in postmenopausal breast cancer survivors. J Clin Oncol. 2003;21(10):1961–6. doi: 10.1200/JCO.2003.07.057. [DOI] [PMC free article] [PubMed] [Google Scholar]
- 29.Cleary MP, Grossmann ME. Minireview: Obesity and breast cancer: the estrogen connection. Endocrinology. 2009;150(6):2537–42. doi: 10.1210/en.2009-0070. [DOI] [PMC free article] [PubMed] [Google Scholar]
- 30.Cauley JA, Gutai JP, Kuller LH, LeDonne D, Powell JG. The epidemiology of serum sex hormones in postmenopausal women. Am J Epidemiol. 1989;129(6):1120–31. doi: 10.1093/oxfordjournals.aje.a115234. [DOI] [PubMed] [Google Scholar]
- 31.Belfiore A, Frittitta L, Costantino A, Frasca F, Pandini G, Sciacca L, Goldfine ID, Vigneri R. Insulin receptors in breast cancer. Ann N Y Acad Sci. 1996;784:173–88. doi: 10.1111/j.1749-6632.1996.tb16235.x. [DOI] [PubMed] [Google Scholar]
- 32.Papa V, Belfiore A. Insulin receptors in breast cancer: biological and clinical role. J Endocrinol Invest. 1996;19(5):324–33. doi: 10.1007/BF03347871. [DOI] [PubMed] [Google Scholar]
- 33.Goodwin PJ, Ennis M, Bahl M, Fantus IG, Pritchard KI, Trudeau ME, Koo J, Hood N. High insulin levels in newly diagnosed breast cancer patients reflect underlying insulin resistance and are associated with components of the insulin resistance syndrome. Breast Cancer Res Treat. 2009;114(3):517–25. doi: 10.1007/s10549-008-0019-0. [DOI] [PubMed] [Google Scholar]
- 34.Schaffler A, Scholmerich J, Buechler C. Mechanisms of disease: adipokines and breast cancer - endocrine and paracrine mechanisms that connect adiposity and breast cancer. Nat Clin Pract Endocrinol Metab. 2007;3(4):345–54. doi: 10.1038/ncpendmet0456. [DOI] [PubMed] [Google Scholar]
- 35.Vona-Davis L, Rose DP. Adipokines as endocrine, paracrine, and autocrine factors in breast cancer risk and progression. Endocr Relat Cancer. 2007;14(2):189–206. doi: 10.1677/ERC-06-0068. [DOI] [PubMed] [Google Scholar]
- 36.Rose DP, Gilhooly EM, Nixon DW. Adverse effects of obesity on breast cancer prognosis, and the biological actions of leptin (review) Int J Oncol. 2002;21(6):1285–92. [PubMed] [Google Scholar]
- 37.DeNardo DG, Coussens LM. Inflammation and breast cancer. Balancing immune response: crosstalk between adaptive and innate immune cells during breast cancer progression. Breast Cancer Res. 2007;9(4):212. doi: 10.1186/bcr1746. [DOI] [PMC free article] [PubMed] [Google Scholar]
- 38.Coussens LM, Werb Z. Inflammation and cancer. Nature. 2002;420(6917):860–7. doi: 10.1038/nature01322. [DOI] [PMC free article] [PubMed] [Google Scholar]
- 39.Ulrich CM, Bigler J, Potter JD. Non-steroidal anti-inflammatory drugs for cancer prevention: promise, perils and pharmacogenetics. Nat Rev Cancer. 2006;6(2):130–40. doi: 10.1038/nrc1801. [DOI] [PubMed] [Google Scholar]
- 40.Goodwin PJ, Ennis M, Fantus IG, Pritchard KI, Trudeau ME, Koo J, Hood N. Is leptin a mediator of adverse prognostic effects of obesity in breast cancer? J Clin Oncol. 2005;23(25):6037–42. doi: 10.1200/JCO.2005.02.048. [DOI] [PubMed] [Google Scholar]
- 41.Oh SW, Park CY, Lee ES, Yoon YS, Park SS, Kim Y, Sung NJ, Yun YH, Lee KS, Kang HS, Kwon Y, Ro J. Adipokines, insulin resistance, metabolic syndrome, and breast cancer recurrence: a cohort study. Breast Cancer Res. 2011;13(2):R34. doi: 10.1186/bcr2856. [DOI] [PMC free article] [PubMed] [Google Scholar]
- 42.Duggan C, Irwin ML, Xiao L, Henderson KD, Smith AW, Baumgartner RN, Baumgartner KB, Bernstein L, Ballard-Barbash R, McTiernan A. Associations of insulin resistance and adiponectin with mortality in women with breast cancer. J Clin Oncol. 2011;29(1):32–9. doi: 10.1200/JCO.2009.26.4473. [DOI] [PMC free article] [PubMed] [Google Scholar]
- 43.Cole SW. Chronic inflammation and breast cancer recurrence. J Clin Oncol. 2009;27(21):3418–9. doi: 10.1200/JCO.2009.21.9782. [DOI] [PMC free article] [PubMed] [Google Scholar]
- 44.Pierce BL, Ballard-Barbash R, Bernstein L, Baumgartner RN, Neuhouser ML, Wener MH, Baumgartner KB, Gilliland FD, Sorensen BE, McTiernan A, Ulrich CM. Elevated biomarkers of inflammation are associated with reduced survival among breast cancer patients. J Clin Oncol. 2009;27(21):3437–44. doi: 10.1200/JCO.2008.18.9068. [DOI] [PMC free article] [PubMed] [Google Scholar]
- 45.Albuquerque KV, Price MR, Badley RA, Jonrup I, Pearson D, Blamey RW, Robertson JF. Pre-treatment serum levels of tumour markers in metastatic breast cancer: a prospective assessment of their role in predicting response to therapy and survival. Eur J Surg Oncol. 1995;21(5):504–9. doi: 10.1016/s0748-7983(95)96935-7. [DOI] [PubMed] [Google Scholar]
- 46.Al Murri AM, Wilson C, Lannigan A, Doughty JC, Angerson WJ, McArdle CS, McMillan DC. Evaluation of the relationship between the systemic inflammatory response and cancer-specific survival in patients with primary operable breast cancer. Br J Cancer. 2007;96(6):891–5. doi: 10.1038/sj.bjc.6603682. [DOI] [PMC free article] [PubMed] [Google Scholar]
- 47.Griggs JJ, Sorbero ME, Lyman GH. Undertreatment of obese women receiving breast cancer chemotherapy. Arch Intern Med. 2005;165(11):1267–73. doi: 10.1001/archinte.165.11.1267. [DOI] [PubMed] [Google Scholar]
- 48.Madarnas Y, Sawka CA, Franssen E, Bjarnason GA. Are medical oncologists biased in their treatment of the large woman with breast cancer? Breast Cancer Res Treat. 2001;66(2):123–33. doi: 10.1023/a:1010635328299. [DOI] [PubMed] [Google Scholar]
- 49.Greenman CG, Jagielski CH, Griggs JJ. Breast cancer adjuvant chemotherapy dosing in obese patients: dissemination of information from clinical trials to clinical practice. Cancer. 2008;112(10):2159–65. doi: 10.1002/cncr.23416. [DOI] [PMC free article] [PubMed] [Google Scholar]
- 50.Pfeiler G, Konigsberg R, Fesl C, Mlineritsch B, Stoeger H, Singer CF, Postlberger S, Steger GG, Seifert M, Dubsky P, Taucher S, Samonigg H, Bjelic-Radisic V, Greil R, Marth C, Gnant M. Impact of Body Mass Index on the Efficacy of Endocrine Therapy in Premenopausal Patients With Breast Cancer: An Analysis of the Prospective ABCSG-12 Trial. J Clin Oncol. 2011;29(19):2653–9. doi: 10.1200/JCO.2010.33.2585. [DOI] [PubMed] [Google Scholar]
- 51.Sestak I, Distler W, Forbes JF, Dowsett M, Howell A, Cuzick J. Effect of body mass index on recurrences in tamoxifen and anastrozole treated women: an exploratory analysis from the ATAC trial. J Clin Oncol. 2010;28(21):3411–5. doi: 10.1200/JCO.2009.27.2021. [DOI] [PubMed] [Google Scholar]
- 52.Manson JE, Willett WC, Stampfer MJ, Colditz GA, Hunter DJ, Hankinson SE, Hennekens CH, Speizer FE. Body weight and mortality among women. N Engl J Med. 1995;333(11):677–85. doi: 10.1056/NEJM199509143331101. [DOI] [PubMed] [Google Scholar]
- 53.DeNardo DG, Johansson M, Coussens LM. Immune cells as mediators of solid tumor metastasis. Cancer Metastasis Rev. 2008;27(1):11–8. doi: 10.1007/s10555-007-9100-0. [DOI] [PubMed] [Google Scholar]
- 54.Mueller MM, Fusenig NE. Friends or foes - bipolar effects of the tumour stroma in cancer. Nat Rev Cancer. 2004;4(11):839–49. doi: 10.1038/nrc1477. [DOI] [PubMed] [Google Scholar]
- 55.Cunningham-Rundles S, McNeeley DF, Moon A. Mechanisms of nutrient modulation of the immune response. J Allergy Clin Immunol. 2005;115(6)(6):1119–28. doi: 10.1016/j.jaci.2005.04.036. quiz 1129. [DOI] [PubMed] [Google Scholar]
- 56.Wintergerst ES, Maggini S, Hornig DH. Contribution of selected vitamins and trace elements to immune function. Ann Nutr Metab. 2007;51(4):301–23. doi: 10.1159/000107673. [DOI] [PubMed] [Google Scholar]
- 57.Craig BM, Adams AK. Accuracy of body mass index categories based on self-reported height and weight among women in the United States. Matern Child Health J. 2009;13(4):489–96. doi: 10.1007/s10995-008-0384-7. [DOI] [PMC free article] [PubMed] [Google Scholar]
- 58.Stommel M, Schoenborn CA. Accuracy and usefulness of BMI measures based on self-reported weight and height: findings from the NHANES & NHIS 2001-2006. BMC Public Health. 2009;9:421. doi: 10.1186/1471-2458-9-421. [DOI] [PMC free article] [PubMed] [Google Scholar]