

Abstract
OBJECTIVE
The glycation gap (the difference between measured A1C and the value predicted by regression on fructosamine) is stable and is associated with microvascular complications of diabetes but has not hitherto been estimated within a clinically useful time frame. We investigated whether two determinations 30 days apart suffice for a reasonably reliable estimate if both A1C and fructosamine exhibit stability.
RESEARCH DESIGN AND METHODS
We studied 311 patients with type 1 or type 2 diabetes for whom simultaneous measurements of A1C and serum fructosamine had been made on at least two occasions separated by 1 month (t0 and t1). Glycemia was deemed stable if A1C(t1) – A1C(t0) and fructosamine(t1) − fructosamine(t0) were both less than their reference change values (RCVs). Instantaneous glycation gaps [gg(t0) and gg(t1)] and their mean (GG), were calculated using the data from all stable patients for the required regression.
RESULTS
Stable glycemia was shown by 144 patients. In 90% of unstable case subjects, a change in medication was identified as the cause of instability. Among 129 stable patients with an average of eight gg determinations prior to t0, GG correlated closely with the mean of these prior determinations (r2 = 0.902, slope 1.025, intercept −0.038).
CONCLUSIONS
The glycation gap can be calculated reliably from pairs of A1C and fructosamine measurements taken 1 month apart if these measurements satisfy the RCV criteria for glycemic control.
It is now well established that among patients with type 1 diabetes (1–4), patients with type 2 diabetes (5), and nondiabetic patients (6–9), there are considerable interindividual differences in A1C that are not accounted for by corresponding differences in glycemia but instead seem to reflect the different glycabilities of hemoglobin in different individuals. Yudkin et al. (6) referred to persons with A1C levels higher than was expected from their serum glucose levels as “high glycators” and to those with lower-than-expected A1C as “low glycators.” McCarter et al. (1) quantified these tendencies as the hemoglobin glycation index, the difference between measured A1C and the value predicted by regression of A1C on mean blood glucose in the study sample, and found that the hemoglobin glycation index was a statistically significant predictor of retinopathy and nephropathy in the Diabetes Control and Complications Trial (DCCT).
More recently, two studies have used fructosamine instead of mean blood glucose as the predictor of A1C in quantifying glycability. In both (2,5), A1C and fructosamine were both measured at one or more visits to the clinic; A1C was regressed on fructosamine using all valid measurements from all patients in the sample; an instantaneous “glycation gap” (gg) was calculated for each visit as the difference between the measured A1C and the value predicted from the fructosamine measurement using the regression equation; in one of these studies (5), a characteristic glycation gap was calculated for each patient as the mean of that patient's gg values (GG). Cohen et al. (2) reported that in type 1 diabetic patients, gg partly explained the excess between-patient variance in A1C. In our retrospective analysis of 2,314 type 2 diabetic patients followed up for a mean of 6.5 years, GG predicted the progression of nephropathy independently of fructosamine even after adjustment for A1C (5).
Authors finding fault with the notion of the glycation gap have asserted that it is itself nothing but the residual of the regression of A1C on fructosamine and that therefore “no difference between high-, medium-, and low-GG groups would be expected after statistical adjustment for A1C and fructosamine” (10). They have accordingly questioned the findings of Rodríguez-Segade et al. (5). This argument ignores the distinction between the regression residual, gg, and the intrinsic glycation gap of the individual (GG*) (estimated by Rodríguez-Segade et al. [5] as an average over gg) and assumes the validity of a statistical model in which measured A1C deviates randomly, both between and within individuals, from the value predicted from fructosamine (A1C*). Yet, this statistical model is precisely what is called into question by the glycation gap hypothesis, which replaces it by a model in which, for a given patient, measured A1C is the result of random deviation from A1C* + GG* and not A1C*. The fact that GG* is not directly measurable is inconvenient but should not cause confusion about the model that is being investigated.
GG, calculated as an average over several years' measurements (5), is evidently not usable clinically. A single gg also cannot be used with confidence because although gg appears to be fairly stable in general (2,5,11), it is liable to alter if there is a sudden change in average glycemia due to, for example, a change in medication. This is so because of the different turnover times of A1C and fructosamine (8–12 weeks [12,13] and 1–3 weeks [14,15], respectively), which make the response of A1C to such a change lag behind the response of fructosamine.
In this study, we investigated whether two determinations 30 days apart suffice for a reliable estimate of the GG* if both A1C and fructosamine show sufficient stability.
RESEARCH DESIGN AND METHODS
We studied 311 diabetic patients for whom data were available for simultaneous measurements of A1C and fructosamine on dates 30 ± 2 days apart within the past 5 years, none of whom had any known hemoglobinopathy or erythrocyte disorder. Of the 311, 50 (the “volunteer group”) were recruited specifically for the study; i.e., they were requested, and agreed, to provide a second blood sample for research purposes 1 month after the first was taken; the albumin excretion rates of these 50 at entry were all in the range of 4–14 mg/24 h. The other 261 were patients for whom suitable data were already available in our database; at entry in the current study, these 261 all had albumin excretion rates <100 mg/24 h. Age, sex, duration of diabetes, and type of treatment were recorded, as were the corresponding A1C and fructosamine levels. In consonance with the racial make-up of our area, all participants were Caucasian.
Biochemical analyses
A1C was determined by high-performance liquid chromatography in a Menarini Diagnostics HA-8140 analyzer. All A1C values were converted from Japanese Diabetes Society (JDS)/Japanese Society for Clinical Chemistry (JSCC)-referenced values to DCCT-aligned units using the following equation: A1CNGSP = 0.985 A1CJDS/JSCC + 0.46%, where NGSP is National Glycohemoglobin Standardization Program (16). Fructosamine was assayed using Genzyme GlyPro kits, which implement an enzymatic method adapted to the Roche Diagnostics Cobas Mira analyzer.
Samples
Whole blood was collected in EDTA-containing tubes for determination of A1C. A1C and serum fructosamine were both determined on the day of collection in the Clinical Biochemistry Laboratory of the University Hospital Complex, Santiago de Compostela. Control materials were analyzed to estimate between-run analytical coefficients of variation (CVA) for both fructosamine (at 189 and 560 μmol/L) and A1C (at 5.4 and 9.3%); for each analyte and level, the control material was run in duplicate twice a day for 10 days.
Statistical analyses
Reference change values (RCVs) were calculated as RCV = 21/2 × 1.96 × [(CVA)2 + (CVI)2]1/2, where CVI is the within-subject biological CV (17); pairs of A1C and fructosamine values taken 1 month apart were considered to indicate glycemic stability during this period if their differences, ΔA1C and Δfructosamine (ΔFA), were both less than the corresponding RCV. That A1C and fructosamine values were normally distributed was verified by skewness and kurtosis tests. gg were calculated as described above, with the preliminary regression of A1C on fructosamine being performed with the pooled data from all patients satisfying the glycemic stability criteria; GG were calculated as the mean of each patient's two gg values. Agreement between GG and GGnRl (an alternative characteristic glycation gap [see results]) as regards classification of patients as high, medium, or low glycators was assessed as Cohen κ (18). All statistical analyses were performed using SPSS 17 software (SPSS, Chicago, IL).
RESULTS
The CVAs were 1.4% for fructosamine and 1.1% for A1C. The corresponding CVIs for nondiabetic patients, taken from the literature, are 3.4% for fructosamine (19) and 2.5% for A1C (20). Thus, the RCVs used were 10.2% for fructosamine and 7.6% for A1C.
Table 1 summarizes relevant clinical and biochemical characteristics of the patients studied. Of the 311, 144 (46.3%) fulfilled the glycemic stability criteria. Of these 144, 34 were volunteers (68% of the volunteer group) and 110 nonvolunteers (42% of the nonvolunteer group); similar proportions were observed in subgroups of the volunteer and nonvolunteer groups defined by sex or type of diabetes. Table 2 shows that, on average, both ΔA1C and ΔFA were smaller among both type 1 and type 2 diabetic volunteers than among other patients with the same type of diabetes, although the differences only attained statistical significance in the case of ΔA1C (P < 0.001). Moreover, the A1C and fructosamine levels of the 16 volunteers who did not fulfill the glycemic stability criteria were all lower at the second determination than at the first.
Table 1.
Baseline characteristics of the study groups

Table 2.
Differences between initial and final values of fructosamine and A1C (% of initial values) and compliance with the RCV criteria

Among the nonvolunteers, 151 failed to fulfill the glycemic stability criteria. In 90% of these cases, the patient's treatment had been changed in the month before the first measurement in a way that was plausibly responsible for nonfulfillment (in 74 cases between 10 and 15 days earlier, in 55 between 15 and 20 days earlier, and in 22 between 20 and 30 days earlier). None of the 144 patients fulfilling the stability criteria had had their treatment changed in the month before the first measurement.
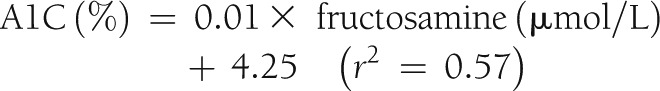
Regression of A1C on fructosamine using the 288 measurements from the 144 stable patients produced the following relationship:
 |
The SD of the 144 differences between the first and second gg values was 0.28% and that of the GG values 1.1%. These patients were classified as high, medium, or low glycators depending on whether their GG values were >0.5%, between −0.5 and 0.5%, or below −0.5%.
During the past 5 years, our laboratory has maintained the same analytical procedures for both fructosamine and A1C. For 129 of the 144 stable patients (23 volunteers and 106 nonvolunteers), simultaneous A1C and fructosamine measurements were made during this time on at least three occasions before the first measurement used in the above regression (the average number of prior measurements per patient was eight). Without regard to glycemic stability, gg values were calculated for each of these prior measurements using the above regression equation, and a “non–RCV-limited” characteristic glycation gap (GGnRl) was calculated for each patient as the mean of his or her prior gg values. Regression of GG on GGnRl showed good correlation between the two (r2 = 0.902) (Fig. 1), and a t test showed no significant difference between mean GG and mean GGnRl; the SD of the 129 differences between GG and GGnRl was 0.34%. Some 86% of patients were placed in the same category by GGnRl as by GG, and in no case was a patient a high glycator according to GG but a low glycator according to GGnRl—or vice versa. Cohen κ was 0.79 (95% CI 0.75–0.84), indicating good agreement between GG and GGnRl.
Figure 1.

Scatterplot of GG (%) vs. GGnRl (%) with the estimated regression line and correlation.
CONCLUSIONS
As argued above, estimation of a patient's GG* requires more than one determination of the gg because of the different kinetics of A1C and fructosamine: A1C reflects weighted mean plasma glucose over the past 100 days, and fructosamine reflects it over the past 30 days (15,21). However, since ∼50% of A1C is produced during the 30–35 days prior to measurement (15,21,22), both fructosamine and A1C are affected by any significant alteration in plasma glucose during this period. It therefore seems reasonable to establish the stability of fructosamine and A1C over this period as a criterion for the probable validity of the associated gg values. This was the criterion adopted in this study, with the stability of the analytes identified by comparison of the 30-day differences with the corresponding RCVs. The adequacy of this criterion is reflected partly by the small SD of the gg differences for the 144 pairs of determinations by which it was satisfied and partly by the close correlation between the GG and GGnRl values of the 129 patients for whom the latter were available. Definitive validation would consist in showing that GG, determined from two gg values as in this study, remains stable throughout the course of the disease (or that it varies in a well-defined manner); pending long-term studies designed to test this possibility, the procedure tested here seems reasonably adequate.
It is striking that the proportion of patients satisfying the glycemic stability criterion was much larger in the volunteer group than among the other participants. This suggests that patients aware that the first and second determinations will be considered jointly may exercise better control than others, and this notion is supported by the finding that the volunteers who did not fulfill the glycemic stability criteria all had lower A1C and fructosamine levels at the second determination than at the first. The exercise of better control does not in itself invalidate measurement of the glycation gap, since the gap is in principle independent of glucose level; what is important is that A1C and fructosamine both reflect the same glucose level, and it is this that is favored by requiring fulfillment of the RCV criterion by both analytes over the 30-day period.
The equation obtained in this study for the regression of A1C on fructosamine predicts A1C levels ∼0.5% higher than those predicted by the equation obtained in our earlier study (5). The cause of this discrepancy appears to be the fact that for both A1C and fructosamine, the earlier study included data obtained by a variety of different methods (though standard linear conversions were used to minimize the influence of this heterogeneity). Analysis of 5,987 A1C/fructosamine pairs that were included in the earlier study and had been obtained by the methods used in the current study produces an equation that is very similar to the one obtained in the current study. In short, as one might expect, the crucial regression equation, like the analyte measurements it relates, depends on the methods used for the measurements, and this should be taken into account by physicians interpreting glycation gap data.
In summary, GG, the average of two gg values determined 1 month apart, agrees reasonably well with long-term average gg if neither A1C nor fructosamine changes by more than their RCV during the month in question. GG so measured constitutes an adequate estimation of the patient's GG*.
Acknowledgments
This work was supported in part by grants from the Secretariat General for Research and Development of the Xunta de Galicia, Spain (PGIDIT04BTF203016PR and PGIDIT06BTF20302PR and 10SCA203008PR) and from the Spanish Ministry of Education and Science (SAF2004-07602).
This work was also supported by Menarini Diagnostics and Siemens Healthcare Diagnostics. No other potential conflicts of interest relevant to this article were reported.
S.R.-S. designed, researched, and wrote the manuscript and approved the final version of the manuscript. J.R., J.M.G.L., and F.F.C. researched data, contributed to discussion, and approved the final version of the manuscript. F.C. researched data, contributed to discussion, edited the manuscript, and approved the final version of the manuscript. S.R.-S. is the guarantor of this work and, as such, had full access to all the data in the study and takes responsibility for the integrity of the data and the accuracy of the data analysis.
The authors acknowledge the statistical guidance of Dr. Juan Manuel Paz and of Dr. Francisco Gude from the Clinical Epidemiology Unit, University Hospital, University of Santiago de Compostela.
Footnotes
References
- 1.McCarter RJ, Hempe JM, Gomez R, Chalew SA. Biological variation in HbA1c predicts risk of retinopathy and nephropathy in type 1 diabetes. Diabetes Care 2004;27:1259–1264 [DOI] [PubMed] [Google Scholar]
- 2.Cohen RM, Holmes YR, Chenier TC, Joiner CH. Discordance between HbA1c and fructosamine: evidence for a glycosylation gap and its relation to diabetic nephropathy. Diabetes Care 2003;26:163–167 [DOI] [PubMed] [Google Scholar]
- 3.Wilson DM, Kollman, Diabetes Research in Children Network (DirecNet) Study Group Relationship of A1C to glucose concentrations in children with type 1 diabetes: assessments by high-frequency glucose determinations by sensors. Diabetes Care 2008;31:381–385 [DOI] [PMC free article] [PubMed] [Google Scholar]
- 4.Soros AA, Chalew SA, McCarter RJ, Shepard R, Hempe JM. Hemoglobin glycation index: a robust measure of hemoglobin A1c bias in pediatric type 1 diabetes patients. Pediatr Diabetes 2010;11:455–461 [DOI] [PubMed] [Google Scholar]
- 5.Rodriguez-Segade S, Rodriguez J, Cabezas-Agricola JM, Casanueva FF, Camiña F. Progression of nephropathy in type 2 diabetes: the glycation gap is a significant predictor after adjustment for glycohemoglobin (HbA1c). Clin Chem 2011;57:264–271 [DOI] [PubMed] [Google Scholar]
- 6.Yudkin JS, Forrest RD, Jackson CA, Ryle AJ, Davie SJ, Gould BJ. Unexplained variability of glycated haemoglobin in non-diabetic subjects not related to glycaemia. Diabetologia 1990;33:208–215 [DOI] [PubMed] [Google Scholar]
- 7.Gould BJ, Davie SJ, Yudkin JS. Investigation of the mechanism underlying the variability of glycated haemoglobin in non-diabetic subjects not related to glycaemia. Clin Chim Acta 1997;260:49–64 [DOI] [PubMed] [Google Scholar]
- 8.Kilpatrick ES, Maylor PW, Keevil BG. Biological variation of glycated hemoglobin. Implications for diabetes screening and monitoring. Diabetes Care 1998;21:261–264 [DOI] [PubMed] [Google Scholar]
- 9.Rohlfing C, Wiedmeyer HM, Little R, et al. Biological variation of glycohemoglobin. Clin Chem 2002;48:1116–1118 [PubMed] [Google Scholar]
- 10.Sacks DB, Nathan DM, Lachin JM. Gaps in the glycation gap hypothesis. Clin Chem 2011;57:150–152 [DOI] [PubMed] [Google Scholar]
- 11.Nayak AU, Holland MR, Macdonald DR, Nevill A, Singh BM. Evidence for consistency of the glycation gap in diabetes. Diabetes Care 2011;34:1712–1716 [DOI] [PMC free article] [PubMed] [Google Scholar]
- 12.Goldstein DE, Little RR, Lorenz RA, et al. Tests of glycemia in diabetes. Diabetes Care 2004;27:1761–1773 [DOI] [PubMed] [Google Scholar]
- 13.Rohlfing CL, Wiedmeyer HM, Little RR, England JD, Tennill A, Goldstein DE. Defining the relationship between plasma glucose and HbA(1c): analysis of glucose profiles and HbA(1c) in the Diabetes Control and Complications Trial. Diabetes Care 2002;25:275–278 [DOI] [PubMed] [Google Scholar]
- 14.Baker JR, Metcalf PA, Holdaway IM, Johnson RN. Serum fructosamine concentration as measure of blood glucose control in type I (insulin dependent) diabetes mellitus. Br Med J (Clin Res Ed) 1985;290:352–355 [DOI] [PMC free article] [PubMed] [Google Scholar]
- 15.Tahara Y, Shima K. Kinetics of HbA1c, glycated albumin, and fructosamine and analysis of their weight functions against preceding plasma glucose level. Diabetes Care 1995;18:440–447 [DOI] [PubMed] [Google Scholar]
- 16.Hoelzel W, Weykamp C, Jeppsson JO, et al. IFCC Working Group on HbA1c Standardization IFCC reference system for measurement of hemoglobin A1c in human blood and the national standardization schemes in the United States, Japan, and Sweden: a method-comparison study. Clin Chem 2004;50:166–174 [DOI] [PubMed] [Google Scholar]
- 17.Fraser CG, Harris EK. Generation and application of data on biological variation in clinical chemistry. Crit Rev Clin Lab Sci 1989;27:409–437 [DOI] [PubMed] [Google Scholar]
- 18.Fleiss JL. Statistical Methods for Rates and Proportions. New York, Wiley, 1981 [Google Scholar]
- 19.Ricós C, Alvarez V, Cava F, et al. Current databases on biological variation: pros, cons and progress. Scand J Clin Lab Invest 1999;59:491–500 [DOI] [PubMed] [Google Scholar]
- 20.Braga F, Dolci A, Montagnana M, et al. Revaluation of biological variation of glycated hemoglobin (HbA(1c)) using an accurately designed protocol and an assay traceable to the IFCC reference system. Clin Chim Acta 2011;412:1412–1416 [DOI] [PubMed] [Google Scholar]
- 21.Tahara Y, Shima K. The response of GHb to stepwise plasma glucose change over time in diabetic patients. Diabetes Care 1993;16:1313–1314 [DOI] [PubMed] [Google Scholar]
- 22.Cohen RM, Franco RS, Khera PK, et al. Red cell life span heterogeneity in hematologically normal people is sufficient to alter HbA1c. Blood 2008;112:4284–4291 [DOI] [PMC free article] [PubMed] [Google Scholar]