Abstract
We present the design and implementation of an oxidized silicon “nanofence array” for long DNA electrophoresis. The device consists of a periodic array of post-filled regions (the nanofences) alternating with empty channel regions. Even in this prototype version, the nanofence array provides the resolving power of a hexagonal nanopost array without requiring any direct-write nanopatterning steps such as electron-beam lithography. Through detailed single molecule investigations, we demonstrate that the origin of the resolving power of the nanofence array is not a reduction in band broadening, which might be expected from the theories for DNA electrophoresis in post arrays. Rather, the enhanced stretching of the hooked DNA by the uniform electric field between nanofences increases the efficiency of the collisions.
1 Introduction
Long DNA in the tens of kilobase pair (kbp) range cannot be readily separated by conventional dc gel electrophoresis,1 and the alternative approach, pulsed-field gel electrophoresis, requires hours to separate these DNA.2 Ordered post arrays, embedded in a microfluidic channel, increase the range of DNA sizes that can be separated by electrophoresis in a dc electric field3-15 because the mechanical stability of a post array permits much larger pore sizes than are possible in a gel. DNA electrophoresis in pores larger than its radius of gyration does not take place by biased reptation.16 Rather, the DNA moves primarily in its relaxed, coiled conformation. The separation is effected by occasional collisions between the DNA and the posts, where the DNA is deformed.17-20 Both the duration of a collision and the distance traveled between collisions are random variables21-29 that depend on the size of the DNA, electric field, and the arrangement of the posts.
In this paper, we present an improved post array geometry for long DNA electrophoresis that we call the “nanofence” array. Existing post array devices for DNA electrophoresis use a regular lattice of posts,3-5,8-15 either in a hexagonal or square configuration, or a quasi-hexagonal array of self-assembled magnetic beads.6,7 In contrast, the nanofence device shown in Fig. 1 consists of regions of closely spaced posts (the nanofences) separated by a relatively long distance (20 μm) between them. Our recent results on the origin of the band broadening in post arrays26,27 led us to hypothesize that the nanofence should have sharper bands since the DNA collide at regular intervals. In such a system, the distance between collisions is no longer a random variable and its contribution to the plate height should vanish.27 We show here that, remarkably, the nanofence array provides a high separation resolution but actually exhibits an increase in band broadening compared to a hexagonal geometry. Through detailed single molecule investigations and continuous-time random walk (CTRW) modeling, we provide evidence that the uniform field lines between collisions lead to more efficient collisions with the posts. Even with the increased band broadening due to these collisions, the nanofence ultimately exhibits a separation resolution comparable to the best results presented for a hexagonal array of posts. As the device in Fig. 1 is only a prototype version, we expect that the nanofence array will quickly surpass the resolving power of hexagonal arrays.
Fig. 1.
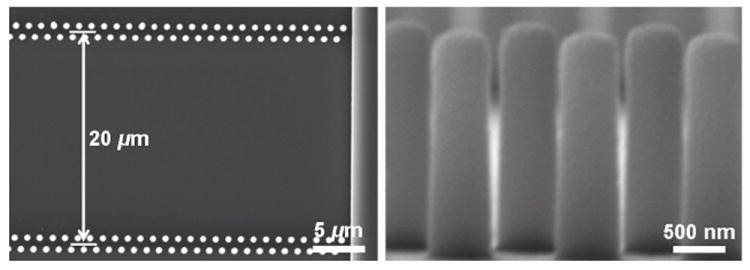
Scanning electron microscope (SEM) images of one period of the nanofence array. (a) Top view of the nanofence array with a 20 μm distance between fences. (b) Cross-sectional image of the nanofence array showing the smooth nanopost side walls. The nanoposts are 600 nm in diameter and 2 μm high. The fabrication method is described in Fig. 2.
2 Experimental Section
2.1 Device fabrication
The silicon nanoposts were fabricated using projection lithography and a deep reactive ion etching (DRIE) process. Fig. 2 shows the typical procedure for fabricating a nanofence array in a microfluidic channel starting from a silicon wafer with a 300 nm thermal oxide layer. The mask for the nanofence array consists of 500 fences (500 nm post diameter, 700 nm spacing between adjacent posts, and 20 μm fence-to-fence distance) embedded in a 150 μm wide microchannel with a shifted-T injection (170 μm offset). The assembled microfluidic device is shown in Fig. 2g. The uniform diffraction color results from the periodic pattern in the separation channel.
Fig. 2.
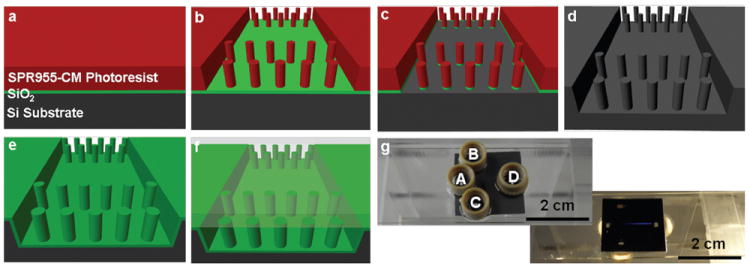
Schematic illustration of the typical procedure for fabricating a nanofence array in a microfluidic channel. (a) A 700 nm thick photoresist layer (SPR955-CM, Megaposit) was obtained by spin casting the photoresist solution onto the substrate. (b) The die pattern was transferred to the photoresist using a projection lithography stepper (2500 i3, Canon). (c) The exposed silicon dioxide was removed by reactive ion etching (RIE, STS 320, Surface Technology System) and the remaining post-patterned oxide and photoresist served as the etching mask for silicon DRIE (SLR-770, Plasma-Therm). (d) Silicon posts with a height of 2 μm were obtained after 12 minutes of etching in SF6/C4F8/O2/Ar (flow rate of 27/63/10/40 sccm) under a power of 700 W with a dc bias of 60 V and a pressure of 8 mTorr. In order to provide external access to the microchannels, four square openings through the silicon substrate for each die were made by silicon nitride low pressure chemical vapor deposition and KOH wet etching.31 (e) After stripping the silicon nitride, the silicon substrate was coated with a 120 nm thick layer of thermally grown silicon dioxide for electrical passivation. (f) For the separation experiments, a 500 μm thick borofloat glass wafer was sealed to the frontside of the oxidized silicon wafer using anodic bonding (SB6, Karl Suss). To permit single molecule observations, one wafer was bonded with a 100 μm thick borofloat glass wafer for use with high numerical aperture objectives. The finished devices (12 per wafer) were diced with a wafer saw (DAD 2H/6T, Disco) into approximately 20 mm × 20 mm pieces. (g) Each piece was bonded on its backside using optical adhesive (Norland Optical Adhesive 81) to a 1 mm thick microscope slide (25 mm × 75 mm) that had been drilled previously with openings for the reservoirs. Four plastic reservoirs (Upchurch 131 reservoirs) were also mounted to the back of this microscope slide using optical adhesive.
2.2 DNA preparation
A stock solution of λ-DNA (48.5 kbp, 20.5 μm stained contour length,30-32 0.73 μm radius of gyration,33 500 μg/ml, New England BioLabs) was mixed with XhoI (New England BioLabs) digested λ-DNA fragments. There is a single XhoI restriction site in λ-DNA, leading to 15 kbp (6.3 μm stained contour length, 0.23 μm radius of gyration) and 33.5 kbp (14.2 μm stained contour length, 0.50 μm radius of gyration) digestion fragments. The aforementioned radii of gyration for the digestion fragments were computed from the scaling for a swollen chain.33 Owing to the stiffness of double-stranded DNA, these radii of gyration for the restriction fragments may be overestimates. Our stock mixture for the DNA separation experiments contains XhoI digest fragments at an approximate concentration of 18 μg/ml and intact λ-DNA at an approximate concentration of 16 μg/ml in 2.2× TBE buffer (196 mM tris base, 196 mM boric acid, 6.2 mM ethylenediaminetetraacetic acid, Sigma). The DNA solution was dyed with YOYO-1 (Invitrogen) at the ratio of one dye molecule per five base pairs by gently rocking the DNA and dye mixture overnight. For the single molecule experiments, the DNA contains either XhoI digestion fragments or intact λ-DNA, dyed with YOYO-1 at the same dye ratio, and diluted to a concentration around 0.1 μg/ml in 2.2× TBE buffer. Before loading the DNA into the chip, the solution was heated at 75 °C for 10 min to melt any λ-DNA concatemers to single, linear λ-DNA molecules.
2.3 DNA separation experiments
Upon loading de-ionized (DI) water into reservoir D (Fig. 2g), the microchannel was wet spontaneously by capillary action. After complete wetting with DI water, the microchannel was filled with a buffer solution of 2.2× TBE, supplemented with 0.07 wt% ascorbic acid, 0.07 wt% polyvinylpyrollidone (PVP), and 3 vol% ß-mercaptoethanol and submerged in the buffer for 48 h.34 The chip was mounted on a customized plastic stage with four platinum electrodes connecting the reservoirs to a programmable power supply (HVS-1500, LabSmith). The electric fields were specified by assigning the appropriate potentials at the electrodes based on Kirchoff’s law and the assumption that the electrical resistance of each arm is proportional to its length. Prior to loading the DNA, the system was equilibrated by pre-running the chip at 20 V/cm in the separation arm for 30 min. After pipetting the DNA into reservoir B (Fig. 2g), the DNA were loaded and injected into the nanofence array using a standard shifted T-protocol.35 An inverted epifluorescence microscope (DMI-4000, Leica) with a 40×, 0.5 numerical aperture objective (HI PLAN 1, Leica) was used to monitor the progress of the separation. To obtain electropherograms, the smallest rectangular field diaphragm (130 × 100 μm2) setting of the microscope was used to limit the field of view and the emitted light was focused onto a photomultiplier tube (H7422-04, Hamamatsu) connected to a data acquisition card operating at 1 kHz. During the electrophoretic run, the stage moved at a speed of 7.0 mm/s between the start and endpoint approximately every 20 s, allowing us to monitor continuously the DNA electrophoresis along the 10 mm separation channel.36 The experimental system is entirely automated and controlled by a custom LABVIEW program.
To make a quantitative analysis of the separation, we obtained electropherograms at 20 second intervals between scans (25 electrophegrams/run) and fit the electropherograms with a sum of three Gaussian functions. The fits provide the evolution of the peak position, X(t), and its variance, σ2(t), of each species as a function of time. The separation resolution during the experiment can be computed directly from these fitted quantities37
| (1) |
where the subscripts refer to the Gaussian peaks corresponding to individual species.
2.4 Single molecule experiments
After complete wetting of the microchannel with DI water, the microchannel was filled with the same buffer solution as in the DNA separations. We began with the XhoI digested λ-DNA fragments and determined the size of each observed molecule based on its maximum extension during a collision, as explained in Figure S1 and S2. After completing the single molecule experiments with XhoI digested λ-DNA fragments, the DNA and running buffer were replaced with DI water and the chip was submerged in the running buffer for 48 h before proceeding with the experiments with λ-DNA. During the λ-DNA single molecule experiments, we still observed some smaller DNA. These DNA could be restriction fragments that were not removed from the device during the cleaning or, posssibly, λ-DNA that was sheared during loading. In order to avoid including fragments during λ-DNA analysis, we again estimated the size of every molecule based on its contour length when hooked on the post and only included those that could be λ-DNA. The DNA imaging was performed with an inverted epifluorescence microscope (Leica DMI 4000B). A potential difference of 16 V was applied across the 1.6 cm long channel using platinum electrodes and a Trek power supply (Model 677B), corresponding to an electric field of 10 V/cm. An EM-CCD camera (Photometrics Cascade II) was used to observe single DNAs using a 100 ×, 1.4 NA oil immersion objective lens (8 bit grayscale pixels and a pixel size of 162 nm). The square viewing widow of width 82.7 μm included 4 nanofences in the channel. Tiff image stacks of 1500 frames at 25 frames per second were captured in the center of the channel (1 mm into the nanofence array).
We used a custom MATLAB-based GUI to track the center of mass and aspect ratio of each DNA identified in the image stack.26 DNA-post collisions were identified by a delay in the center of mass motion of the DNA molecule. The holdup time of the collision was measured as the time between constant velocity motion of the molecule before and after the collision, as defined previously.26 The location of each collision was at a specific nanofence as determined from a brightfield image of the nanofence array.
The single molecule data provide probability distributions for the holdup time, tH, and the number of rows between collisions, NRow. In addition to using these data to analyze the microscale transport in the device, we can also use them to calculate the mean velocity and dispersion coefficient for transport inside the nanofence array (i.e., neglecting the contributions due to injection and detection) using a previously developed continuous-time random walk (CTRW) model.27 Briefly, we treat the DNA molecule as a particle moving in one dimension. The particle can be in one of two states: (i) colliding with a nanofence for a random time tH, resulting in no translation of the center of mass of the molecule, or (ii) translating at a steady velocity, U, between collisions over a random distance x, which is obtained from the random number of rows between subsequent collisions, x(μm) = 20 Nrow. The corresponding mean velocity is
| (2) |
and the dispersion coefficient, D̄, is given by
| (3) |
where σ2i is the variance in random variable i. We write Eqn. (3) in this slightly longer form to emphasize the separate contributions due to the random distance between collisions (first term) and the variance in the collision times (second term).
3 Results and Discussion
3.1 Separation resolution
Figure 3 (and Fig. S3 in ESI†) shows the detailed evolution of an electrophoretic separation of the mixture of λ-DNA and its XhoI digest at an electric field of 10 V/cm. Two bands become visible along the separation channel after 45.0 s, with the slower band corresponding to a mixture of the 33.5 kbp and 48.5 kbp species and the faster band being the 15 kbp fragment. The mixture of 33.5 and 48.5 kbp starts to separate after 157.0 s and all three bands are further resolved with the passage of time. After 7 min, the resolution in Fig. 3 between the 15 and 33.5 kbp fragments is 1.15, and the resolution between the 15 and 48.5 kbp fragments is 1.91.
Fig. 3.
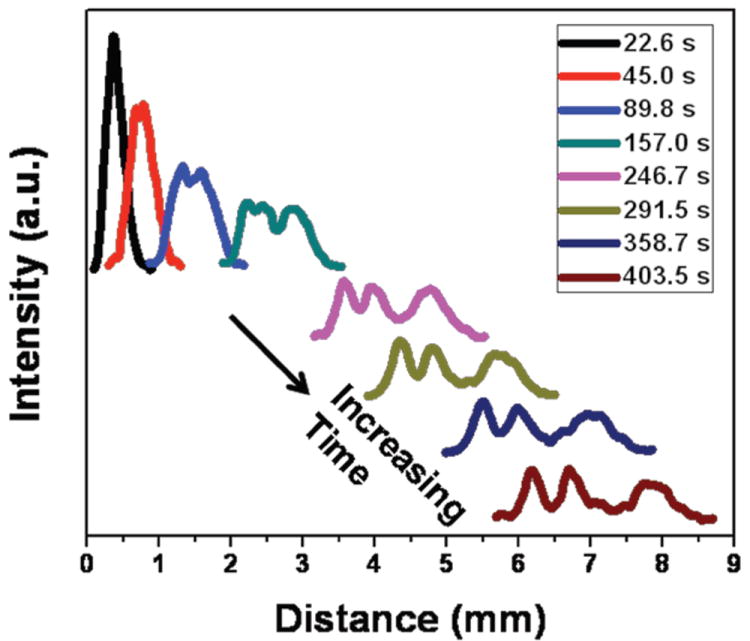
Evolution of the bands during DNA electrophoresis at 10 V/cm. Multiple scans of the separation channel are acquired at different times during the run, making it possible to monitor the continuous separation of λ and the XhoI λ-digest.
We also tested the nanofence array at a higher electric field (see ESI† Fig. S4). At 20 V/cm, two distinct bands are again resolved after 45.0 s. The slower band, consisting of the 33.5 and 48.5 kbp fragments, begins to separate into two bands after 201.8 s, but the resolution at the end of the array is inferior to the results we obtained at 10 V/cm. Based on the detailed single molecule study at 10 V/cm described in the following subsections, we propose that the reduced resolution at 20 V/cm is due to incomplete relaxation of the DNA between collisions. Thus, as the electric field increases further, the resolution in the particular nanofence design in Fig. 1 should continue to decrease.
Figure 4 shows the evolution of the separation resolution at 10 V/cm as a function of time, averaged over three separate experiments. Compared with other types of microfluidic devices, the nanofence array quickly separates the mixture of λ-DNA and its XhoI digest with high resolution. For example, in self-assembled magnetic beads a lower electric field (4.8 V/cm) and around 15 minutes was required to obtain a similar resolution to Fig. 4.6 The nanofence also exhibits superior resolution compared to a previous device produced by projection lithography; the latter hexagonal nanopillar chip with a post diameter and a post spacing of 500 nm only led to a resolution of 0.8 between 21 kbp and 165 kbp fragments after 15 min.8,13 Separations in a hexagonal array of 360 nm posts with a 3 μm center-to-center distance at 10 V/cm required around 20 min to achieve a resolution of 2.15 between 15 and 33.5 kbp fragments.15 Using the t1/2 scaling for the resolution,37 this corresponds to a value of 1.2 after 7 min, comparable to the nanofence array. Although there are no data for the XhoI λ-digest in dense nanopillar arrays fabricated from electron-beam lithography (EBL)5 and nanoimprint lithography (NIL),9 the data available for separating 10 kbp and 38 kbp fragments5 lead us to speculate that dense nanopillar arrays will exhibit a somewhat higher separation resolution than the nanofence. However, from a fabrication standpoint, EBL is limited to short separation matrices and requires long processing times because of the serial nature of the fabrication procedure. NIL is an alternative choice for mass-production, but it is still limited by the need to make the mold by EBL and by challenges in transferring the pattern over the large areas required for separations.38 In contrast, our approach using projection lithography allows high-throughput, easy, wafer-scale fabrication of devices for rapid, sharp separations of long DNA.
Fig. 4.
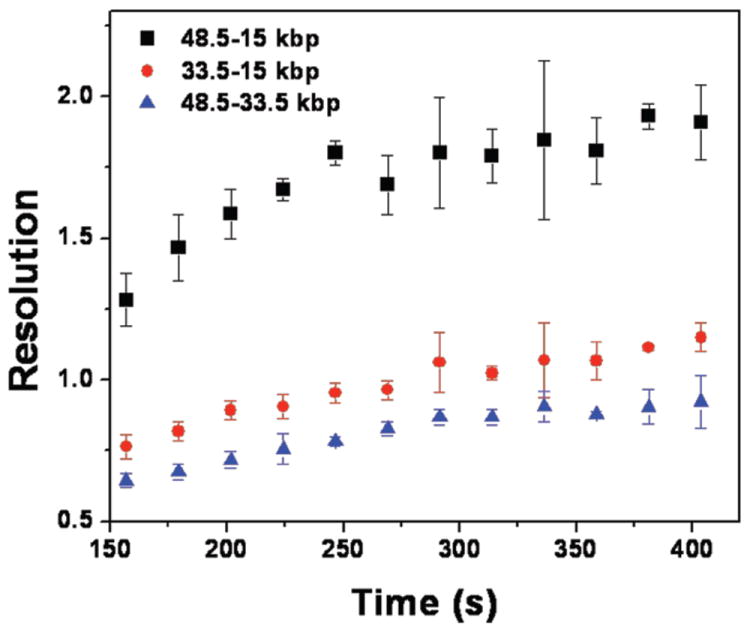
Plot of the separation resolution at 10 V/cm. Error bars represent the standard deviations for the different data sets in Fig. 3 and Fig. S3.
3.2 Do the DNA collide with each nanofence?
The underlying principle of the nanofence is to enforce regularly spaced collisions. Realizing this goal requires that the gap between the posts be small enough to prevent the DNA from squeezing through without a collision. Since we also wanted to minimize the cost of the device, we chose to use projection lithography to pattern the device. Our projection lithography system has a line width of 500 nm, which sets the lower bound on both the post diameter and the spacing between the posts. To maintain a small gap, we used two offset rows of posts to create each nanofence.
From a fabrication standpoint, it appears that we met our design criteria. As one would expect, the dry etching and the thermal oxidation processes affect the gap between nanoposts and the post diameter in the finished device. After DRIE, the diameter of the etched silicon nanoposts is about 360 nm due to undercutting (see ESI† Fig. S5). After the thermal oxidation step, the diameter of the oxidized silicon nanoposts increased to 600 nm (Fig. 1b), giving a post radius commensurate with the 230 nm radius of gyration of the 15 kbp fragment. At the same time, the gap between the posts projected onto a plane with its normal vector parallel to the direction of motion, 100 nm, is small compared to the radius of gyration of the smallest DNA in our separation.
From an operational standpoint, DNA transport in the device is more complicated than we initially expected. To see if the DNA actually collided with each nanofence, we measured the probability distribution for the number of rows between collisions at 10 V/cm, conditioned on colliding in the first row of the viewing window. We chose to condition on a collision in the first row to obtain the most reliable statistics for the limited viewing window (a square with width = 82.7 μm) available to us for single molecule imaging with a high numerical aperture objective. While the data in Fig. 5 do not indicate a unit conditional probability P(NRow = 1) = 1 for any of the DNA sizes, P(NRow = 1) + P(NRow = 2) ≈ 1 for all of the DNA sizes. The best results were obtained for the 33.5 kbp DNA, as we can see from the exemplary trajectory in Fig. 6. The conditional collision probability for the 33.5 kbp DNA appears to decay exponentially with a constant of 76.2%, and only 1 of the 101 molecules that collided in the first row exited the viewing window without a second collision. For the smaller 15 kbp DNA, most of the DNA make their next collision in the subsequent row, but 6 out of the 68 molecules exited the observation window without making a second collision. Although the gap between posts is small, the porosity of a fence is still limited by the projection photolithography to 33% (measured from the entrance to the exit of a nanofence in the direction of net motion). Apparently the combination of this porosity and thermal fluctuations of the 15 kbp DNA coil, along with deformation caused by the nonuniform electric field near the posts, is sufficient to allow occassional passage of these small DNA through the nanofence. In contrast, all of the 96 observed λ-DNA molecules collided within the observation window. However, we found that the incomplete relaxation after the collision leads to 40.6% of the molecules slithering through the next row of posts without a collision. (See Fig. 7 for an exemplary trajectory.) The slow relaxation is offset by a large radius of gyration, whereupon a vast majority (89.7%) of the λ-DNA molecules that reptated through the first nanofence collided with the second nanofence.
Fig. 5.
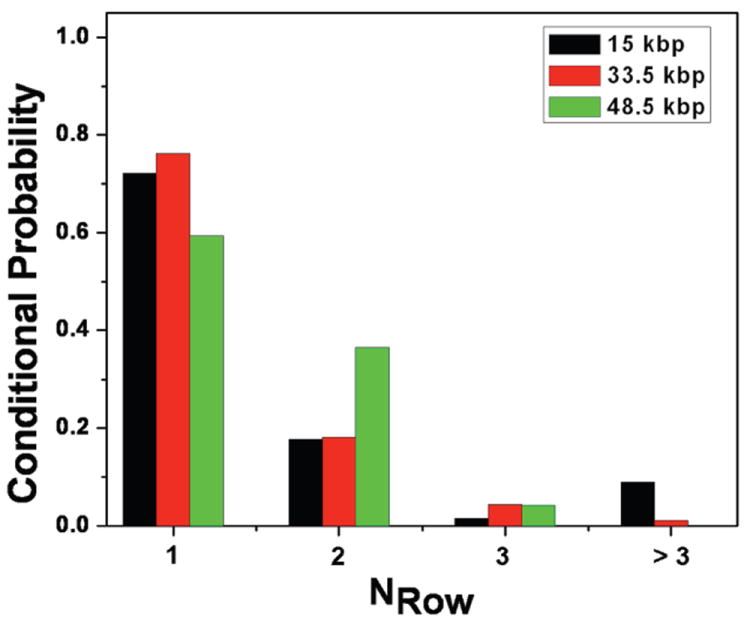
Probability distribution for the collision at a given row conditioned on colliding with the first nanofence in the viewing area. The histogram shows the probability of a DNA molecule that collides with the first fence to make its next collision with the 2nd fence (NRow = 1), 3rd fence (NRow = 2), 4th fence (NRow = 3), or some later fence (NRow > 3) outside of the viewing area. The experiments were carried out at an electric field of 10 V/cm.
Fig. 6.
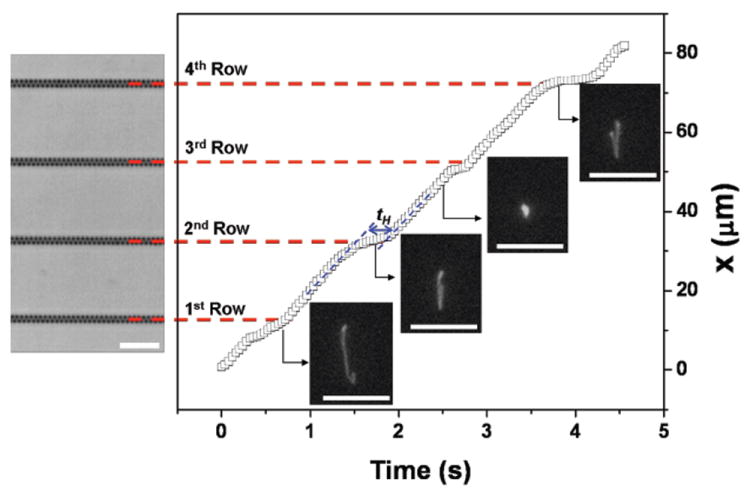
Trajectory of the center of mass of a 33.5 kbp DNA at 10 V/cm. There are four nanofences in the viewing window of 82.7 μm. Four images of a 33.5 kbp DNA during migration in the nanofence array are included, with the direction of motion being from bottom-to-top (corresponding to the bright field image). The DNA moves at constant free solution migration velocity before and after collisions (blue dotted lines). Scale bars = 10 μm.
Fig. 7.
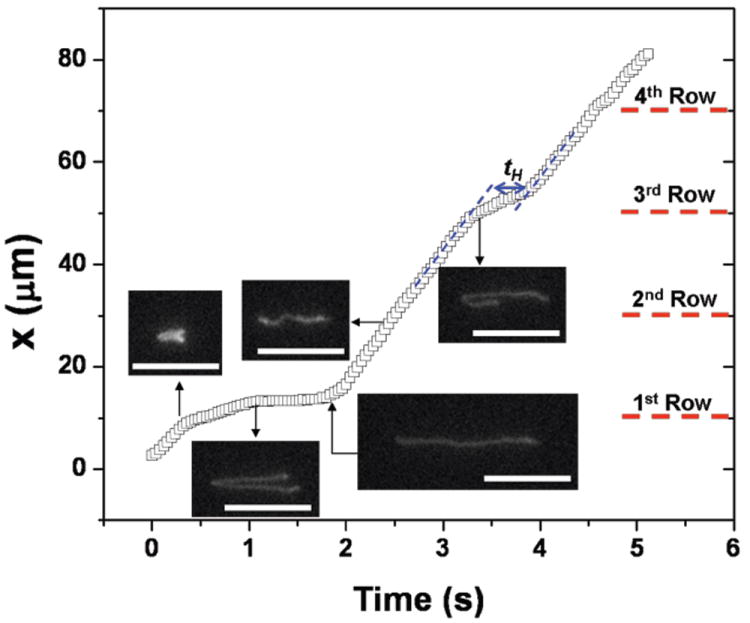
Trajectory of the center of mass of a λ-DNA molecule at 10 V/cm. The λ-DNA is highly extended and does not always have enough time for complete relaxation before next collision, which for this particular trajectory results in reptation through the 2nd nanofence array. Five images of a λ-DNA during migration in the nanofence array are included, with the direction of motion being from left-to-right. The DNA moves at constant free solution migration velocity before and after collisions (blue dotted lines). Scale bars = 10 μm.
3.3 Continuous-time random walk model
The CTRW model equations (2) and (3), combined with probability distributions obtained from single molecule experiments, are the most straightforward way to analyze the role of the post geometry on band broadening. In this approach, we assume that the region of the nanofence array probed by the single molecule experiments is representative of the rest of the array; i.e., that there are no defective fences or changes in the surface zeta potential that could impart a non-uniform electroosmotic flow elsewhere in the channel. Under these assumptions, the CTRW equations readily provide the rate of growth of the width of the bands as a function of time solely due to the interactions between the DNA and the fences. In contrast, extracting the same data from electropherograms such as the ones in Fig. 3 is considerably more challenging. While we can easily estimate the position of the peaks, Xi(t), by visual inspection of the electropherogram, the corresponding measurements of the peak variances, σ2 i(t), are hindered by the absence of a unique deconvolution of the electropherogram into the sum of three Gaussians. Moreover, the signal-to-noise ratio begins to affect the measurements of the peak widths towards the end of the experiment. Indeed, the signal-to-noise ratio also limits the resolution we can obtain in our separations.
However, in order to use the CTRW model to compare the dispersion in a nanofence array to the hexagonal array, we should first check if the CTRW model predictions agree with the separation data. The form of Eqn. (2) is a simplification of the general result27 for the case where the DNA velocity, U, between collisions in the direction of the net motion is a constant, as suggested by Figs. 6 and 7. As we see in Table 1, this “in-array” free solution mobility was essentially independent of the DNA molecular weight. We can then compute the average velocity and dispersion coefficient by determining the parameters in Eqns. (2) and (3) from the distribution for the distance between collisions (Fig. 5) and the distribution for the holdup times (Fig. 8). The data appearing in Fig. 8 are reminiscent of the cumulative distribution function for a gamma distribution, which we might expect for collisions with an isolated nanopost.39 However, we found that the average collision time in the nanofence appear to be somewhat longer-lived than equivalent data for isolated nanoposts.39 To estimate the average distance between collisions and its variance from Fig. 5, we assumed that any DNA in the NRow>3 category collided at NRow = 4; as there are very few DNA that fail to collide in the viewing window, their collisions contribute little to the mobility and dispersivity from the CTRW model. The relevant statistics from the single molecule experiments are summarized in Table 1, along with the corresponding predictions for the mean velocity and the dispersion coefficient.
Table 1.
CTRW parameters measured from single-molecule data at 10 V/cm.
| U (μm/s) | tH(s) | (s2) | X (μm) | (μm2) | U̅(μm/s) | D̅(μm2/s) | |
|---|---|---|---|---|---|---|---|
| 15 kbp | 23.5 ± 1.7 | 0.26 | 0.04 | 29.4 | 323.2 | 19.4 ± 0.09 | 8.00 ± 0.06 |
| 33.5 kbp | 24.0 ± 1.5 | 0.40 | 0.08 | 25.9 | 140.4 | 17.6 ± 0.06 | 12.0 ± 0.03 |
| 48.5 kbp (Nanofence) | 23.0 ± 2.0 | 0.54 | 0.22 | 29.0 | 133.6 | 16.1 ± 0.38 | 19.4 ± 0.4 |
| 48.5 kbp (Hexagonal Array) | 14.9 ± 0.9 | 0.34 | 0.08 | 18.5 | 150.7 | 11.7 ± 0.05 | 5.7 ± 0.03 |
The first three rows correspond to the data obtained here for the nanofence array. The last row are previously reported data for λ-DNA in a hexagonal array of 1 μm diameter posts with a 3 μm pitch.26 The in-array free solution velocity, U, is the average of the slopes of the trajectories (e.g., Figs. 6 and 7) for all molecules and the error corresponds to the standard deviation of this ensemble. The errors for the mean velocity and dispersion coefficient are estimates of the sampling error for the distributions for the holdup time and the variance, propagated through Eqns. (2) and (3).
Fig. 8.
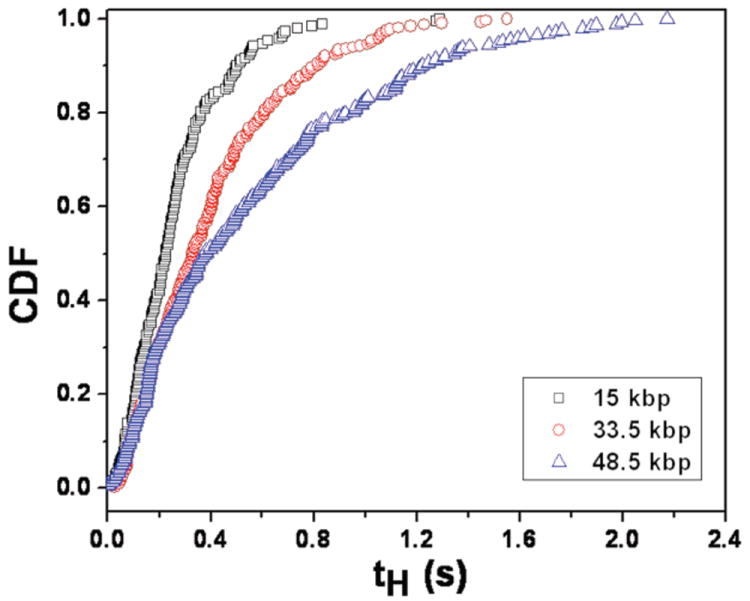
Cumulative distribution function (CDF) of the holdup time for each molecular weight at 10 V/cm.
The CTRW results for the average velocity agree with the separation experiments. To obtain the latter data, we used the average of the peak positions, X(t), from three separate experiments at 10 V/cm and then computed the velocity from linear regression (Fig. S6 in ESI†). The corresponding velocities (19.9 ± 0.08, 17.2 ± 0.06, and 16.0 ± 0.07 μm/s for the 15 kbp, 33.5 kbp and 48.5 kbp DNA) are in excellent agreement with the CTRW results in Table 1.
We also checked to see whether the band broadening predicted from the CTRW model agrees with the data from the separation experiments. Figure 9 shows the variance data for one run; the data for the other runs are included as Figs. S7 and S8 in ESI†. The difficulty in obtaining accurate values of the peak width from the deconvoluted electropherograms is apparent in Fig. 9; the variance should increase monotonically but the data are scattered about a general increase in width. Figure 9 also includes estimates for the band broadening from the CTRW dispersion coefficients appearing in Table 1. Since we do not know the initial width of the band due to the injection, we fixed the slope as twice the dispersivity and chose the intercept to minimize the sum-squared error between the separation data and the CTRW prediction.
Fig. 9.
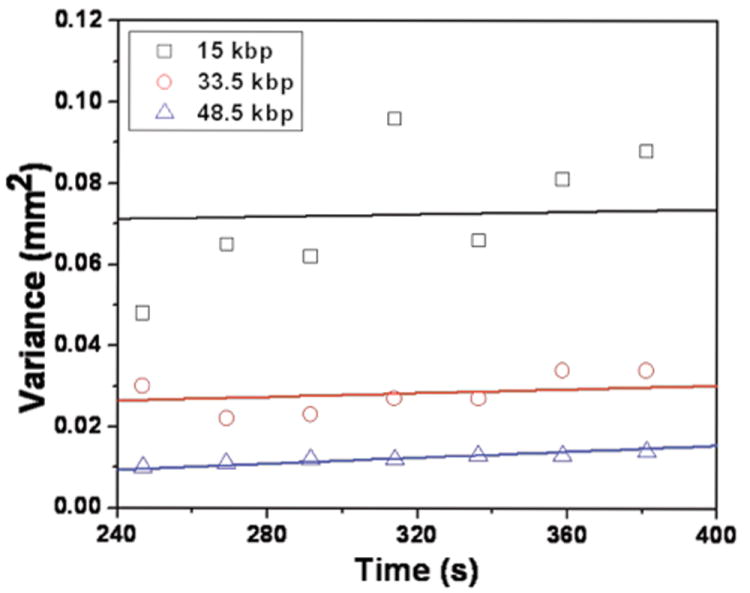
Variance of the peaks during the separation as a function of time and the comparison with the prediction of the single-molecule data for (a) 15 kbp, (b) 33.5 kbp and (c) 48.6 kbp. The intercept for the single-molecule data is the best fit of a line with slope of twice the dispersion coefficient in Table 1 to the separation data.
For the larger DNA, the agreement between the CTRW predictions and the experimental data is quite good, especially considering the error in extracting the variance from the separation data. The agreement is not as good for the 15 kbp DNA. We did not find that the disagreement was due to the limited statistics in Figs. 5 and 8, since we had to alter the single molecule data in an unrealistic manner to fit the separation data. We can also exclude fragmentation of the DNA as an explanation, since this would lead to a band of non-colliding small fragments moving at the free solution mobility that do not appear in the electropherogram. We ultimately concluded that the relatively low signal-to-noise ratio during detection of the bands in the separation is the most likely explanation for the discrepancy between the CTRW predictions for the band broadening of the 15 kbp DNA and the peak widths we extracted from the electropherogram. Our explanation is supported by two features of the electropherogram for the 15 kbp peak. First, while the 48.5 and 33.5 kbp peaks are reasonably Gaussian, the 15 kbp peak is highly non-Gaussian. The sum of a weak Gaussian peak and random noise from the detector gives a non-Gaussian result. Second, the area under the 15 kbp peak is much larger than one would expect from an XhoI digest of λ -DNA. Assuming a stoichiometric dye ratio and uniform detection of the fluorescence, we would have expected the area of this 15 kbp peak to be ~45% of the area under the 33.5 kbp peak. As we can see in Fig. 3, this is clearly not the case.
3.4 Comparison with a hexagonal array
We are now in a good position to evaluate our initial hypothesis that the nanofence reduces the band broadening compared to a hexagonal array. In a previous publication,26 we obtained the probability distributions for the holdup time and distance between collisions for λ-DNA at the same electric field (10 V/cm) in a hexagonal array of 1 μm diameter posts with a 3 μm pitch. Table 1 includes the in-array free solution velocity, U, mean and variance of the probability distributions, and the predictions of Eqn. (2) for the mean velocity and Eqn. (3) for the dispersion coefficient of λ-DNA.
Remarkably, the dispersion coefficient for λ-DNA in the nanofence array is a four-fold increase over a hexagonal array. The latter result contrasts sharply with our expectation that, by enforcing uniform distances between collisions, the dispersion in the nanofence array would be smaller than the dispersion in a hexagonal array. The CTRW model provides ready insights into the origin of the increased dispersion. Equation (3) provides two distinct sources to the band broadening; the first term is the contribution due to the distance between collisions and the second term is the contribution due to the collisions themselves.27 Both terms are normalized with the average time for a collision-translation cycle. While the nanofence array did not enforce uniform collision distances, the variance in the collision distance, σ2x, is indeed lower in the nanofence array. However, the first term in Eqn. (3) is 3.35 μm2/s in the nanofence array, compared to 2.23 μm2/s in the hexagonal array. As the total cycle time, <tH> + <x>/U, is longer in the nanofence array, we can conclude that the increase in dispersion due to the variance in the distance between collisions arises from an increase in the difference between the mean DNA velocity and its velocity between the collisions. In other words, the collisions in the nanofence array are more efficiently retarding the DNA. Such an effect is obviously desirable for separating the peaks, but it has a deleterious effect on the band broadening. Indeed, even if the nanofence worked perfectly with <x> = 20 μm and σ2x = 0, the dispersion coefficient would still be substantial (5.56, 8.82, and 15.9 μm2/s for the 15, 33.5 and 48.5 kbp DNA). All of these values exceed the dispersion coefficient of λ -DNA in the hexagonal post array.
Since the band broadening in the nanofence array is actually higher than in a hexagonal array, inspection of Eqn. (1) reveals that the resolution in the nanofence array must be due to the separation between the peaks. Between collisions in the nanofence, the DNA relax and translate through an empty channel under a uniform electric field. In contrast, DNA moving in a hexagonal array experience a complex electrophoretic “flow” field, consisting of regions of compression and extension along with substantial steric hindrances caused the presence of nearby posts. The difference between these two types of electric field distributions is readily apparent in the in-array free solution velocity U in Table 1. Although both experiments correspond to the same potential drop per over the array length, ΔV/ΔL = E, the apparent speed in the direction of this potential drop is much lower in the hexagonal array due to the curved field lines.12 The interfence transport in the nanofence array leaves the DNA in a conformation that favors collisions. This favorable conformational effect is enhanced by the high local density of post in the nanofence array, whereupon a DNA molecule approaching a nanofence is always reasonably aligned with one of the posts (i.e., the impact parameter40 is small). In contrast, collisions in a hexagonal post array occur over a wide range of impact parameters. The combination of these two effects leads to stronger stretching on the post. Indeed, the mean extension of the hooked λ DNA in the nanofence at 10 V/cm was 15.2 ± 2.6 μm, which is significantly longer than the typical value of 9.4 μm in the hexagonal array at the same electric field.26
4 Conclusions
While we initially expected that the unique geometry of the nanofence array would reduce the band broadening compared to a regular post array without reducing the nominal collision frequency, our single molecule data and CTRW modeling led to the opposite conclusion. Rather, the resolution in the nanofence array is the result of more efficient collisions due to the absence of conformational changes caused by the electric field gradients and steric obstacles in a hexagonal post array. As our device is a prototype, we expect that the resolution can be enhanced further. As we now know that the device operates by ensuring high-quality collisions with the obstacles, we expect that the performance might be improved by ensuring that all of the DNA are completely relaxed prior to colliding. In particular, there are a substantial number of λ-DNA that reptate through the first row of posts following a collision before colliding in the second row. We suspect that a number of the λ-DNA collisions are partially relaxed molecules that are arrested during their reptation through the nanofence or instances of the bunching instability.41,42
There are two possible routes to increasing the time between collisions and thus ensuring complete relaxation: (i) We could reduce the electric field so that it takes more time to move between fences with the same distance between fences. While this approach is a simple remedy to the problem, since it does not require any change in the device geometry, it is of limited utility since the electric field still needs to be strong enough to deform the DNA when it collides with an obstacle. Reducing the electric field also will increase the number of roll-off collisions for the smaller DNA, thereby reducing the efficiency of the separation. (ii) We could increase the distance between fences while keeping the electric field fixed. While this second solution will certainly allow the λ-DNA to relax before the subsequent collision while providing sufficient electrical force to deform the DNA during a collision, it increases the footprint of the device. It is not obvious that increasing the time between collisions will actually lead to an improved separation since, by definition, the same number of collisions will now require more time. The challenges related to relaxation will only increase as the size of the DNA increases. Indeed, we could reach the point where the fence spacing is so long that we need to introduce turns into the separation channel, which can introduce substantial band broadening.43 In the most extreme case, the time between collisions could be much longer than the nominal collision time, at which point the separation would vanish. Owing to the non-trivial cost of fabricating next-generation prototypes, the nanofence is an ideal candidate for optimization through simulation, provided that we can identify a suitable DNA model that resolves the relatively small post size and the long DNA contour length.
Supplementary Material
Acknowledgments
We thank Mark N. Joswiak for the implementation of the automated scanning detection method. This work was supported by the National Institute of Health (NIH) Grant no. R01HG005216 and the National Science Foundation (NSF) CBET-0642794. Portions of this work were performed in the University of Minnesota Nanofabrication Center, which receives a partial support from the NSF through NNIN, and in the Institute of Technology Characterization Facility, University of Minnesota, a member of the NSF-funded Materials Research Facilities Network (www.mrfn.org).
Footnotes
Electronic Supplementary Information (ESI) available: Data related to the stretching of the DNA on the post, electropherograms obtained at 10 V/cm and 20 V/cm, SEM images of the nanofence array after the silicon etching step, a plot of the X(t) and its linear regression, and the comparable data to Fig. 9 for two additional runs. See DOI: 10.1039/b000000x/
Notes and references
- 1.Heller C, Duke T, Viovy JL. Biopolymers. 1994;34:249–259. [Google Scholar]
- 2.Schwartz DC, Cantor CR. Cell. 1984;37:67–75. doi: 10.1016/0092-8674(84)90301-5. [DOI] [PubMed] [Google Scholar]
- 3.Volkmuth WD, Austin RH. Nature. 1992;358:600–602. doi: 10.1038/358600a0. [DOI] [PubMed] [Google Scholar]
- 4.Chan YC, Carles M, Sucher NJ, Wong M, Zohar Y. J Micromech Microeng. 2003;13:914–921. [Google Scholar]
- 5.Kaji N, Tezuka Y, Takamura Y, Ueda M, Nishimoto T, Nakanishi H, Horiike Y, Baba Y. Anal Chem. 2004;76:15–22. doi: 10.1021/ac030303m. [DOI] [PubMed] [Google Scholar]
- 6.Doyle PS, Bibette J, Bancaud A, Viovy JL. Science. 2002;295:2237. doi: 10.1126/science.1068420. [DOI] [PubMed] [Google Scholar]
- 7.Minc N, Futterer C, Dorfman KD, Bancaud A, Gosse C, Goubault C, Viovy JL. Anal Chem. 2004;76:3770–3776. doi: 10.1021/ac035246b. [DOI] [PubMed] [Google Scholar]
- 8.Chan YC, Lee YK, Zohar Y. J Micromech Microeng. 2006;16:699–707. [Google Scholar]
- 9.Shi J, Fang AP, Malaquin L, Pepin A, Decanini D, Viovy JL, Chen Y. Appl Phys Lett. 2007;91:153114. [Google Scholar]
- 10.Kaji N, Oki A, Ogawa R, Takamura Y, Nishimoto T, Nakanishi H, Horiike Y, Tokeshi M, Baba Y. Isr J Chem. 2007;47:161–169. [Google Scholar]
- 11.Ogawa R, Kaji N, Hashioka S, Baba Y, Horiike Y. Jpn J Appl Phys Part 1. 2007;46:2771–2774. [Google Scholar]
- 12.Ou J, Cho J, Olson DW, Dorfman KD. Phys Rev E. 2009;79:061904. doi: 10.1103/PhysRevE.79.061904. [DOI] [PubMed] [Google Scholar]
- 13.Chan YC, Zohar Y, Lee YK. Electrophoresis. 2009;30:3242–3249. doi: 10.1002/elps.200900127. [DOI] [PubMed] [Google Scholar]
- 14.Ou J, Carpenter SJ, Dorfman KD. Biomicrofluidics. 2010;4:013203. doi: 10.1063/1.3283903. [DOI] [PMC free article] [PubMed] [Google Scholar]
- 15.Ou J, Joswiak MN, Carpenter SJ, Dorfman KD. J Vac Sci Technol A. 2011;29:011015. [Google Scholar]
- 16.Viovy JL. Rev Mod Phys. 2000;72:813–872. [Google Scholar]
- 17.Nixon GI, Slater GW. Phys Rev E. 1994;50:5033–5038. doi: 10.1103/physreve.50.5033. [DOI] [PubMed] [Google Scholar]
- 18.Volkmuth WD, Duke T, Wu MC, Austin RH, Szabo A. Phys Rev Lett. 1994;72:2117–2120. doi: 10.1103/PhysRevLett.72.2117. [DOI] [PubMed] [Google Scholar]
- 19.Salieb-Beugelaar GB, Dorfman KD, van den Berg A, Eijkel JCT. Lab Chip. 2009;9:2508–2523. doi: 10.1039/b905448k. [DOI] [PubMed] [Google Scholar]
- 20.Dorfman KD. Rev Mod Phys. 2010;82:2903–2947. [Google Scholar]
- 21.Patel PD, Shaqfeh ESG. J Chem Phys. 2003;118:2941–2951. [Google Scholar]
- 22.Dorfman KD, Viovy JL. Phys Rev E. 2004;69:011901. doi: 10.1103/PhysRevE.69.011901. [DOI] [PubMed] [Google Scholar]
- 23.Minc N, Viovy JL, Dorfman KD. Phys Rev Lett. 2005;94:198105. doi: 10.1103/PhysRevLett.94.198105. [DOI] [PubMed] [Google Scholar]
- 24.Dorfman KD. Phys Rev E. 2006;73:061922. doi: 10.1103/PhysRevE.73.061922. [DOI] [PubMed] [Google Scholar]
- 25.Mohan A, Doyle PS. Macromolecules. 2007;40:8794–8806. [Google Scholar]
- 26.Olson DW, Ou J, Tian M, Dorfman KD. Electrophoresis. 2011;32:573–580. doi: 10.1002/elps.201000466. [DOI] [PubMed] [Google Scholar]
- 27.Olson DW, Dutta S, Laachi N, Tian M, Dorfman KD. Electrophoresis. 2011;32:581–587. doi: 10.1002/elps.201000467. [DOI] [PMC free article] [PubMed] [Google Scholar]
- 28.Minc N, Bokov P, Zeldovich KB, Futterer C, Viovy JL, Dorfman KD. Electrophoresis. 2005;26:362–375. doi: 10.1002/elps.200410115. [DOI] [PubMed] [Google Scholar]
- 29.Teclemariam NP, Beck VA, Shaqfeh ESG, Muller SJ. Macromolecules. 2007;40:3848–3859. [Google Scholar]
- 30.Bakajin OB, Duke TAJ, Chou CF, Chan SS, Austin RH, Cox EC. Phys Rev Lett. 1998;80:2737–2740. [Google Scholar]
- 31.Perkins TT, Smith DE, Larson RG, Chu S. Science. 1995;268:83–87. doi: 10.1126/science.7701345. [DOI] [PubMed] [Google Scholar]
- 32.Randall GC, Doyle PS. Macromolecules. 2006;39:7734–7745. [Google Scholar]
- 33.Smith DE, Perkins TT, Chu S. Macromolecules. 1996;29:1372–1373. [Google Scholar]
- 34.Randall GC, Doyle PS. Macromolecules. 2005;38:2410–2418. [Google Scholar]
- 35.Jacobson SC, Hergenroder R, Koutny LB, Warmack RJ, Ramsey JM. Anal Chem. 1994;66:1107–1113. [Google Scholar]
- 36.Lo RC, Ugaz VM. Lab Chip. 2008;8:2135–2145. doi: 10.1039/b811033f. [DOI] [PubMed] [Google Scholar]
- 37.Giddings JC. Unified Separation Science. John Wiley & Sons, Inc.; New York: 1991. [Google Scholar]
- 38.Landis S, Chaix N, Gourgon C, Perret C, Leveder T. Nanotechnol. 2006;17:2701–2709. doi: 10.1088/0957-4484/17/10/043. [DOI] [PubMed] [Google Scholar]
- 39.Joswiak MN, Ou J, Dorfman KD. Electrophoresis. 2011 doi: 10.1002/elps.201100471. in press. [DOI] [PubMed] [Google Scholar]
- 40.Sevick EM, Williams DRM. Phys Rev Lett. 1996;76:2595–2598. doi: 10.1103/PhysRevLett.76.2595. [DOI] [PubMed] [Google Scholar]
- 41.Deutsch JM. Science. 1988;240:922–924. doi: 10.1126/science.3363374. [DOI] [PubMed] [Google Scholar]
- 42.Deutsch JM, Madden TL. J Chem Phys. 1989;90:2476–2485. [Google Scholar]
- 43.Culbertson CT, Jacobson SC, Ramsey JM. Anal Chem. 1998;70:3781–3789. [Google Scholar]
Associated Data
This section collects any data citations, data availability statements, or supplementary materials included in this article.


