

Abstract
Mineral crystals, the major strength-bearing component of bone, are aligned in longitudinal bone with (00l) axes preferentially along the longitudinal axis, which in concert with crystal anisotropy leads to macroscopic anisotropy in mechanical behavior. Thus, it is of great interest to delineate the contributions of different subsets of mineral crystals as a function of orientation, on the bulk mechanical behavior of bone. Using a unique synergistic approach combining a progressive loading scheme and synchrotron X-ray scattering techniques, human cortical bone specimens were loaded in compression to examine the in situ mechanical behavior of mineral crystals as the function of orientation. The orientation distribution of mineral crystals was quantitatively estimated by measuring the X-ray diffraction intensity from the crystallographic (002) plane in different orientations. In addition, the average longitudinal (c-axis), transverse (a-axis), and shear strains of the subset of mineral crystals aligned in each orientation were determined by measuring the lattice deformation in the crystals normal to three distinct crystallographic planes (i.e. 002, 310, and 213). The experimental results indicated that the in situ strain and stress of mineral crystals varied with orientation. The normal strain and stress exerted on the longitudinally aligned mineral crystals were markedly greater than those on the transversely oriented crystals, whereas the shear stress reached a maximum for the crystals aligned in ±30° with respect to the loading direction, which coincided with the long axis of bone. The maximum principal strain and stress were observed in the mineral crystals oriented along the loading axis, with a similar trend observed in the maximum shear strain and stress. By examining their in situ behavior, the contribution of mineral crystals to load bearing and the bulk behavior of bone are discussed.
Keywords: Bone, mineral crystals, synchrotron, X-ray scattering, internal stress-strain
1. INTRODUCTION
Age and disease-related disorders (e.g. Osteoporosis, Osteopetrosis, and Osteogenesis Imperfecta) reduce bone quality, thus making it prone to fragility fractures (Seeman, 2001; Yamagishi et al., 2005). Most of existing methodologies for fracture risk assessments are based on bone mineral density measured by dual energy X-ray absorptiometry (DEXA) and quantitative computed tomography (QCT). However, measuring mineral density alone is not sufficient to assess bone fracture risks since fragility fractures may occur in bones with normal mineral densities (Schnitzler, 1993). The structural and tissue properties are also critical for such fractures (Ammann and Rizzoli, 2003; Dalle Carbonare and Giannini, 2004; Turner, 2002; Yeni et al., 2011). Bone fragility fractures may be originated at different hierarchies of bone and its origins could often be traced back to the ultrastructural levels, such as mutation induced defects in collagen fibrils for osteogenesis imperfecta patients and localized hypermineralization by aging (Chavassieux et al., 2007). Hence, to understand the cause of bone failure it is necessary to elucidate its nanomechanics at ultrastructural levels.
Bone is mainly composed of mineral crystals and collagen fibrils. Since these components have long-range order at atomic and molecular levels, X-ray scattering can be used to determine lattice features (Ascenzi et al., 1985; Ascenzi et al., 1978; Handschin and Stern, 1995; Lees and Hukins, 1992). High energy X-ray beams with shorter wavelengths available at the third generation synchrotron radiation sources have allowed for faster data acquisition, less exposure time, less restriction to the sample size, higher accuracy, and more lattice information (Almer and Stock, 2005). Furthermore, use of area detectors in transmission mode enables the capture of scattering vectors at different orientations without the need of adjusting sample during the measurements.
The recent advancements in synchrotron X-ray scattering techniques have enabled researchers to directly measure the in situ deformation of mineral and collagen phases in bone under loads using wide-angle and small-angle X-ray scattering (WAXS and SAXS), respectively (Almer and Stock, 2007; Dong et al., 2011; Gupta et al., 2006). Taking advantage of these unique features, notable progress has been made in correlating nano-scale structure with the bulk properties of bone (Almer and Stock, 2005, 2007; Dong et al., 2011; Fujisaki and Tadano, 2007; Gupta et al., 2006). A recent study (Dong et al., 2011), which combined a unique progressive loading protocol (Wang and Nyman, 2007) with synchrotron X-ray scattering techniques, studied the evolution of local behavior of mineral crystals and collagen fibers and bulk properties of bone simultaneously.
It has been well documented that the hexagonal mineral crystals are aligned preferentially with their (00l) axes parallel to the longitudinal axis of bone (Ascenzi et al., 2003; Fratzl et al., 1992; Sasaki et al., 1989; Wagermaier et al., 2006). The orientation of mineral crystals can affect the macroscopic compliance of bone in different directions due to the combined effects of orientation and elastic/plastic anisotropy (Giri et al., 2009). However, in previous studies the average internal strain tensor was often determined for mineral crystals as an aggregate without considering the potentially distinct deformation of crystals in different orientations. To fully characterize the in situ deformation of a subset of mineral crystals along each orientation, the lattice deformation of the crystals needs to be measured separately with their orientation distribution being taken into account.
To address the issue, this study presents the methodologies necessary for determining the orientation distribution and the in situ strain components of each subset of mineral crystals using the full WAXS spectra of human cortical bone. The correlation between the in situ behavior of mineral crystals and the bulk mechanical behavior of bone was investigated under the uniaxial compressive loading.
2. MATERIALS AND METHODS
2.1 Bone specimen preparation
Cylindrical compressive specimens (3.0mm in diameter and 5.0mm long) were harvested from the anterior quadrant of mid-diaphyses of five human cadaveric femurs (n=5). These femurs were obtained from the National Disease Research Initiatives (NDRI, Philadelphia, PA) and screened for diseases and drug treatments that affect the tissue. Since only middle-aged male donors (51.6±1.8 years of age) were used in the study, the confounding effects of gender and aging could be alleviated.
2.2 Principle of synchrotron X-ray diffraction
Diffraction of X-rays from an ordered structure can be described using the modified Bragg's equation:
| (1) |
Here, EB is energy of irradiated X-ray (in keV), h is the Planck constant, c is the speed of light, λ is the wavelength, d is the lattice spacing of ordered crystallographic planes, 2θ is the angle between the incident and diffracted X-ray beams (Bragg's angle), and k (= hc =12.398) is a constant. The diffracted angle (2θ) is inversely related to the d-spacing for a given X-ray energy (EB) (Fig. 1). The monochromatic X-ray beam is diffracted by the crystallographic planes with different d-spacing to form multiple rings (Debye rings) in the detector plane (Fig. 2a). Each of the rings corresponds to a crystallographic plane from the mineral crystals and the radius (r) of the ring from the beam center is related to the d-spacing of the plane through the angle 2θ in Eqn. 1 (Fig. 1). For the preferentially oriented structures like bone, the intensity of diffracted X-ray beam on the Debye rings varies with the amount of crystals aligned in each specific orientation (referred to as azimuthal angle, η). Since multiple rings diffracted from different lattice planes of the crystals are observed in the full spectra of X-ray scattering of bone (Fig. 2), the lattice deformation along the distinct planes within the subset of mineral crystals that are aligned in the same direction could be examined. This information is critical to fully characterize the in situ deformation of the mineral crystals in bone.
Figure 1.

Strain measurements using X-ray diffraction: Schematic of WAXS in transmission mode with two dimensional area detector systems.
Figure 2.

WAXS diffraction pattern and data processing: (a) Debye rings of WAXS pattern from human cortical bone in compression with its longitudinal axis parallel to the loading axis η = 0° (X-axis). (b) The diffraction pattern converted to Cartesian coordinates, and (c) in three-dimensional plot. (d) The diffraction peaks extracted along the longitudinal axis (loading direction), transverse axis and at inclined angle (37° from the longitudinal axis). The vertical dotted lines represent a reference pattern for synthetic hydroxyapatite (HAp) [International Centre for Diffraction Data - Powder Diffraction File, Card No. 00-009-0432]. Diffraction peaks used in this study (002, 213, 310) are labeled. The intensity in (002) plane after removal of background was integrated to calculate the orientation distribution of the mineral phase. (e) A representative distribution of integrated intensities as a function of orientations. First half of the WAXS spectrum (left half in the figure; η = ±90 degrees) was used to estimate the orientation distribution function using Eqn. 2.
2.3 Mechanical testing with concurrent X-ray measurements
The mechanical testing was performed using a well-established progressive loading scheme (Leng et al., 2009; Nyman et al., 2009; Wang and Nyman, 2007). Briefly, the bone specimens were incrementally deformed in a series of load-dwell-unload-dwell cycles until failure. During each loading cycle, the specimen was first loaded in displacement control at a constant rate to a prescribed displacement level (loading stage), held at the displacement level for 150 seconds (stress relaxation dwell stage), unloaded in the load control at constant rate to zero force (unloading stage), held at the zero force level for 150 seconds (viscoelastic creep dwell stage), and then reloaded again to the next designated strain level. The yield strain (εy) was determined as the strain level at which permanent deformation started to be detectable (Leng et al., 2009). Hydration of bone specimens was maintained throughout the test by continuously dripping normal saline to the specimens.
In this study, WAXS measurements were performed at the end of the loading stage in each cycle in a servo-hydraulic materials-testing system (MTS Model 858) aligned with the 1-ID beamline of the Advanced Photon Source, Argonne National Laboratory. A monochromatic high-energy (E~65keV) X-ray beam with a size of approximately 0.1mm×0.1mm was incident on the center of the specimen perpendicular to the loading axis. The WAXS spectra were captured in a transmission mode within one second using a large area detector (GE rad detector) placed at 1.6m from the sample. Calibration was performed using an NIST Ceria standard. The macroscopic strain was recorded using an extensometer of 8.0mm gage length attached to the loading platens.
2.4 Determination of orientation distribution of mineral crystals
Among different lattice planes in mineral crystals, the normal of (002) plane uniquely represents their longitudinal axis (c-axis). Hence, the diffraction intensity of (002) planes can be used to estimate the amount of mineral crystals aligned in each orientation under the assumption that the volume fraction of the crystals in each orientation is proportional to the integrated diffraction intensity in the specific orientation. To do this, firstly, the diffraction region over a certain radial width enveloping (002) Debye ring was integrated after background correction for a 5-degree angular region each. The fraction of these integrated intensities at 5-degree intervals (I(η)) to the total intensity of azimuthal distribution were used to represent the orientation distribution function (ODF) of mineral crystals along each orientation as shown in Eqn. 2.
| (2) |
Only first half of the azimuthal distribution (±90 degrees) was considered due to the symmetric nature of X-ray scattering from the same planes (Fig. 2e).
2.5 Measurement of in situ strain of mineral crystals
The d-spacings of crystallographic planes serve as internal strain gages to estimate the local deformation of mineral crystals. When bone is loaded, the d-spacing of crystallographic planes in the mineral crystals either expand (tension) or contract (compression), thus resulting in the distortion of the initial (unloaded) Debye rings (Fig. 1). To measure the internal strain, the Debye rings recorded on the detector (Fig. 2a) were first converted into the Cartesian system (Fig. 2b) by averaging the intensity within one pixel radial bin and 0.5 degree azimuthal bins. The distribution (or spectrum) of WAXS intensities was then presented in the three-dimensional plot (Figs. 2c). By sectioning through the spectrum at different azimuthal angles (η), the WAXS peaks from the lattice planes were obtained in a radial profile (Fig. 2d). The diffraction peaks corresponding to the crystallographic planes of interest (peaks labeled in Fig. 2) were determined by fitting the profile with the pseudo-Voigt function to determine corresponding radial positions rη. The lattice strain (εη) normal to a crystallographic plane was then readily calculated using the following relation derived from the Bragg's law:
| (3) |
where, rη0 is the initial radius of the unloaded ring corresponding to the plane aligned in an azimuthal angle (η). Using Eqn. 3, the lattice strains of different crystallographic planes in each subset of mineral crystals aligned in the same direction (η) were determined.
In the past, strains have been obtained for the mineral phase by fitting the load-induced distortion of individual Debye ring to a biaxial model (Almer and Stock, 2005; Dong et al., 2011). Using this method for a two-dimensional case in a fixed coordinate system (X-Y), in which X-axis was defined along the loading axis, Z-axis parallel to the beam line, and Y-axis normal to X-Z plane, the strain components (εx, εy, εxy) could be determined by measuring the deformation of (002) plane in any three orientations (Fig. 3a).
| (4) |
where, Ai = sin2θi+ sin2ηi cos2θi; Bi = −sinθi cosθi cosηi; Ci = cos2θi cos2ηi; and is the lattice strain of (002) plane in a direction, ηi (i = 1, 2, 3). The strain components (εx, εy, εxy) could be readily transformed to (εL, εT, εLT) in the local (crystal) coordinate system (L–T), whose two axes are set to coincide with the long (c-axis) and transverse (c-axis) directions of the crystals, respectively (Fig. 3b).
Figure 3.

Determination of in situ strain components using two methods: (a) The strain components were estimated based on the assumption of a continuum mineral phase by measuring the deformation of (002) plane of mineral crystals aligned in the following three directions, i.e. X-axis, Y-axis and η with respect to X-axis using Eqn. 4. (b) The strain components were estimated for individual mineral crystals aligned in all orientations (η) by directly measuring the deformation of three crystallographic planes: (002), (310), and (213).
In this study, a new approach is proposed to determine the strain tensors of individual subsets of mineral crystals aligned in different orientations (η) separately. The internal deformation normal to (002), (310), and (213) crystallographic planes in each subset of mineral crystals were measured using WAXS to determine the average strain tensors of the subset of crystals in the local (lattice) coordinate system (L-T). The lattice strains η(002) and η(310) uniquely represent the deformation of the crystals along the c-axis and a-axis, respectively (Fig. 3b). The lattice strain η(213) gives a measure of deformation of the crystals in an inclined direction with respect to c-axis. From Eq. (5) (Taylor and Leber, 1954), the calculated interplanar angle β of (213) plane with (002) (i.e. c-axis) was 36.69 (approximated to 37° for rest of the calculations) using estimated lattice parameters (c = 0.939nm; a = 0.687nm).
| (5) |
Eqn. 5 is true for the angle between any plane (hkl) and (002). The lattice planes ((002)(310), (213)) were selected for strain estimation because they are not affected considerably by the neighboring peaks. It is obvious from the linear profiles (Fig. 2d) that (002) and (213) peaks are uniquely corresponding to the reference peaks from hydroxyapatite [International Centre for Diffraction Data - Powder Diffraction File, Card No. 00-009-0432]. In addition, it was found that (310) peak was also not affected by the nearby peak [i.e. (212)] as shown by deconvolution of the composite peak region and corresponding strain measurements (data not presented here).
Unlike (002) and (310) planes, the orientation of the inclined plane (213) may not be unique in each subset of mineral crystals, but involve two orientations symmetric to the c-axis of the crystals. Hence, the diffraction of (213) planes in each orientation on its Debye ring may be a combination from a pair of subsets of crystals aligned in two different orientations at 2*β (~74°) intervals. Since different deformations are expected in the (213) planes under the same load due to the inherent anisotropy of mineral crystals, the observed (213) peak may actually consist of two sub peaks corresponding to two different subsets of crystals. No netheless, the deconvolution analysis on (213) peaks under different loads indicated that the error induced by the inconsistent deformation of the pair of crystals was negligible (data not presented here).
By determining the normal deformation in the three directions (i.e., c-axis, a-axis, and 37° from c-axis), the in situ strain components (εL, εT, and εLT) were calculated in the local coordinates for the mineral crystals aligned in each orientation (η) using the following two-dimensional transformation equation:
| (6) |
Then, they were transformed to the fixed coordinates (εx, εy, εxy) using the equation below:
| (7) |
The value of these strain components is actually representative of the average deformation of the subset of mineral crystals aligned in the same orientation (η).
In fact, the strain state of spatially distributed mineral crystals is three-dimensional, and there is a third component of strain (i.e. circumferential) perpendicular to the recorder plane (in Fig. 3b). Since a uniaxial load was applied to bone specimens in this study, it is presumable that the stress in transverse directions would be negligible. Thus, a plane stress condition may most closely reflect the local loading environment in this case.
2.6 Determination of in situ stresses of mineral crystals
Assuming the state of plane stress for mineral crystals, the in situ stress tensors in the subset of mineral crystals in the same orientations (η) can be estimated to the fixed coordinates using following relation.
| (8) |
Here, c11 = 172 (c-axis); c22 = 137 (a-axis); c12 = 54.9; c23 = 42.5; c66 = 39.6 in GPa (Gardner et al., 1992).
The principal and maximum shear stresses (σ1,2(η), and σxymax(η)) were also calculated for the mineral crystals aligned in each orientation,
| (9) |
| (10) |
The corresponding maximum principal and shear stresses directions (θp(η) and θs(η)) were determined as,
| (11) |
Finally, by taking into account the contribution of all mineral crystals and their orientation distribution, the average (effective) strains (, , ) and stresses (, , ) of the entire mineral phase were calculated as follows:
| (12)a |
| (12)b |
3. RESULTS
The orientation distribution of mineral crystals was found to reach the maximum value (about 5.30%) along the long axis of bone and the minimum (about 1.25%) along the transverse direction (Fig. 4). The orientation distribution of mineral crystals was symmetrical about the long axis of bone (direction of preferential orientation of mineral crystals). However, it was also noted that the loading axis (i.e., 0°) was shifted slightly (<5°) from the long axis of bone. Almost 60% of the crystals were oriented within ±30° with respect to the longitudinal axis of bone.
Figure 4.
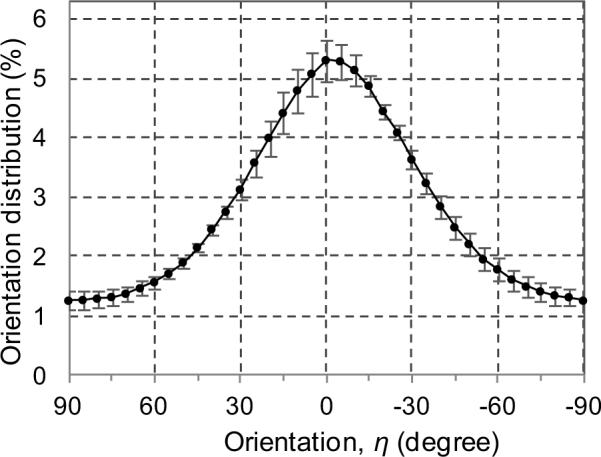
Orientation distribution of mineral crystals at the initial (unloaded) state. The error bars are standard error of mean (n=5).
Significant differences were found between the strain components (εL, εT, εLT) directly measured from the subsets of mineral crystals and those (εbL, εbT, εbLT) estimated using the biaxial model in the local coordinates (Fig. 5). The transverse and shear strains directly measured in this study were much smaller than those estimated using the biaxial model. However, the longitudinal strain estimated using both the approaches was almost identical in all orientations.
Figure 5.

Comparison of strain components obtained using two methods: The strain components (longitudinal, transverse, and shear) for mineral crystals aligned in different orientations are shown in the format of radar graph. The circular coordinate represent the orientation of mineral crystals, and the radial coordinate represents the strain magnitude. Marked differences (magnitude and distribution) were observed in the transverse and shear strains between the directly measured and biaxial average based on the continuum assumption (superscripted `b'). The macroscopic strain is 1.2%, which is immediately prior to yielding of bone.
By measuring the strain components (εL, εT, εLT) at the pre-yield, yield, and post-yield stages (Fig. 6), it was found that the mineral crystals oriented within η=±60° about the long axis of bone were in compression, whereas those outside the range were in tension along their c-axis (Fig. 6a). Similarly, the transverse strain (εT) showed a transition between tension and compression at about η=η30± (Fig. 6b). The maximum longitudinal (εL), transverse (εT) and shear strains (εLT) occurred at the yielding and were measured to be εLmax=0.35% for the crystals aligned in 0°, εTmax=0.22% for those in ±90η, and εLTmax=0.34% for those in ±45° with respect to the long axis of the specimens, respectively. Also observed was a slight shift of the symmetry (~5η) of the crystal deformation in bone.
Figure 6.

Strain components in the local coordinates (L–T) in different orientations: (a) Longitudinal strains (c-axis); (b) transverse strains (a-axis); and (c) shear strains. Loading axis is along 0°. The error bars are standard error (n = 5). The macroscopic applied strains are (mean±SE): −0.41±0.04 at pre-yield; −1.19±0.08 at yield; and −5.27±0.35 at post-yield (in %), respectively.
The discrepancy in the transformed in situ strains (εx, εy, εxy) in the fixed coordinates was found among the mineral crystals that were aligned in different orientations (Fig. 7). The longitudinal strain (εx) of the crystals aligned around the loading direction (η=0°) was about 1.64 times more than those aligned in the transverse direction (η=90°) at the onset of yielding (Fig. 7a-1). The transverse strain (εy) was less varied among the crystals aligned in all orientations (Fig. 7b-1). However, greater shear strains (εxy) were observed in the crystals oriented around η=0°~−30° (Fig. 7c-1). Taking into account the spatial distribution of mineral crystals, their contribution to the deformation of bone in each orientation were evaluated as a product of the strain components (εx, εy and εxy) and corresponding orientation distribution function (ODF(η)) (Figs. 7a-2, 7b-2, and 7c-2). It was indicated that the mineral crystals aligned within η =±30° with respect to the loading direction carried the major portion of deformation of the mineral phase. Comparing the crystals aligned in the longitudinal and transverse orientations at yield, the ratio of their contribution for the longitudinal strain was approximated to be 6:1.
Figure 7.

Orientation-dependence of mineral crystal strains: (a) Longitudinal (X-axis); (b) transverse (Y-axis); (c) shear strain components for the mineral crystals aligned in all orientations (left), and the normalized values by taking into account the volume fraction of mineral crystals (right). The error bars are standard error (n=5). The macroscopic applied strains are (mean±SE): −0.41±0.04 at pre-yield; −1.19±0.08 at yield; and −5.27±0.35 at post-yield (in %), respectively.
The discrepancy in the in situ stresses (σx, σy, σxy) followed the similar trend of the strains (Fig. 8). The longitudinal stress (σx) for the crystals aligned around the loading direction (η=0°) was 1.67 times greater (at yield) than those aligned in the transverse direction (η=90°) (Fig. 8a-1), which is similar to the corresponding strains. On the other hand, both the transverse and shear stresses (σy, σxy) were less varied among the crystals aligned in all orientations (Figs. 8b-1, 8c-1). Furthermore, by evaluating the contribution of mineral crystals to the bulk load bearing of bone in each orientation as a product of the stress components (σx, σy, σxy) and the corresponding orientation distribution, ODF(η), the mineral crystals aligned in η=±30° with respect to the loading direction were found to carry the major portion of the load (Fig. 8-a2). Comparing the crystals aligned in the longitudinal and transverse orientations, the ratio of their contribution was also approximated to be 6:1. The contribution parameter for transverse direction was scattered largely (Fig. 8-b2).
Figure 8.

Orientation-dependence of mineral crystal stress: (a) Longitudinal (X-axis); (b) transverse (Y-axis); (c) shear stresses for the mineral crystals aligned in all orientations (left), and the normalized values of stresses by taking into account the volume fraction of mineral crystals (right). The error bars are standard error (n=5). The macroscopic applied stresses are (mean±SE): 30.3±2.92MPa at pre-yield; 102±12.2MPa at yield; 58.9±17.7MPa at post-yield, respectively.
Both the maximum principal and shear stresses were found in the crystals aligned in the loading direction (η=0°), implying that these crystals would most likely be damaged first compared with those aligned in the other orientations (Figs. 9a-1, 9b-1). In addition, it was observed that the maximum principal direction was within 0~14° (Fig. 9a-2), whereas the direction of maximum shear stress ranged in between −30°~−45° with respect to the loading direction (Fig. 9b-2).
Figure 9.

Maximum stresses and their directions in mineral crystals: (a) Maximum principal stress, and (b) maximum shear stress (left) and corresponding direction (right) in mineral crystals aligned in different orientations. The error bars represent standard error (n=5). The macroscopic applied stresses are (mean±SE): 30.3±2.92MPa at pre-yield; 102±12.2MPa at yield; 58.9±17.7MPa at post-yield, respectively.
To determine the overall contribution of all mineral crystals to the bulk behavior of bone, the average strains (, , ) and stresses (, , ) were calculated at different bulk strain levels by taking into account the effect of orientation distribution of mineral crystals (Table 1). The strain in the loading direction () represented the major deformation of bone corresponding to the uniaxial compression, with the limited transverse strain () being largely due to the Poisson's effect and an appreciable shear strain (). A similar trend was also found in the average stress components, showing that except for the longitudinal stress (), the transverse and shear stresses (, ) were limited. The remaining transverse and shear stresses (, ) might reflect certain interaction between the mineral phase and the surrounding matrix, considering the fact that these components should be naught by force equilibrium in bone under uniaxial compression. In addition, it was observed that the average strain and stress (, ) of all mineral crystals in the loading axis was about 20% less than those (, ) obtained from the subset of crystals aligned in the loading direction (Table 2).
Table 1.
Average strains and stresses of the mineral phase (mean±SE)
| Bulk strain (%) | Effective mineral strains (%) | Bulk stress (MPa) | Effective mineral stresses (MPa) | |||||
|---|---|---|---|---|---|---|---|---|
| Pre-yield | −0.41 ±0.04 | −0.09±0.01 | 0.03±0.00 | −0.02±0.00 | −30.25±2.92 | −115.44±9.45 | 8.74±3.42 | −16.54±2.07 |
| Yield | −1.19±0.08 | −0.30±0.03 | 0.09±0.01 | −0.06±0.01 | −102.34±12.21 | −412.78±38.43 | −5.44±2.19 | −50.79±5.06 |
| Post-yield | −5.27±0.35 | −0.14±0.04 | 0.03±0.00 | −0.04±0.01 | −58.94±17.67 | −202.10±53.87 | −30.01±13.39 | −28.70±11.47 |
Table 2.
Comparison of the average strain and stress of the mineral phase and the measured strain and stress of the mineral crystals aligned in the loading axis (mean±SE)
| Mineral strain (%) | Mineral stress (MPa) | |||
|---|---|---|---|---|
| Pre-yield | −0.09±0.01 | −0.10±0.01 | −115.44±9.45 | −139.24±12.01 |
| Yield | −0.30±0.03 | −0.35±0.03 | −412.78±38.43 | −492.52±47.11 |
| Post-yield | −0.14±0.04 | −0.16±0.04 | −202.10±53.87 | −233.49±59.69 |
4. DISCUSSION
This study employed a synergistic approach combining synchrotron X-ray scattering techniques with the progressive loading scheme to determine the in situ mechanical behavior of mineral crystals in bone. Using the full-spectrum of WAXS, the in situ deformation of individual subsets of mineral crystals that are aligned in each orientation in bone was determined in compression. By examining the evolution of the in situ strains and stresses of the mineral crystals in the pre and post-yield deformation, we addressed several important aspects in this study pertaining to the relationship between the in situ behavior of mineral crystals and the bulk behavior of bone under compression.
First, the orientation distribution of mineral crystals in bone was estimated in this study based on the assumption that the X-ray diffraction intensity by (002) plane is proportional to the amount of mineral crystals, showing that it was symmetrical with respect to the longitudinal axis of bone (Fig. 4). The orientation distribution of mineral crystals also exhibited a significant variation from the longitudinal (5.30%) to transverse (1.25%) direction of bone. Similar but qualitative results about crystal distribution in bone have been reported in the literature (Giri et al., 2009; Tanaka et al., 2010; Tesch et al., 2003). Such an uneven distribution of mineral crystals may have direct effects on the bulk elastic constants of bone along different directions (Deuerling et al., 2009) and may play a major role in determining the degree of compliance or stiffness with respect to the loading direction (Giri et al., 2009). One interesting observation of this study is that the offset of the orientation distribution of mineral crystals with respect to the loading direction (Fig. 4) would lead to a shift of symmetry in the deformation of mineral crystals too (Fig 6) (though the shift were observed to be in the opposite direction for the average values presented here), and becoming more pronounced as the load increased, thus resulting in an unsymmetrical in situ stress distribution in bone. It could also be anticipated that such an asymmetry of the stress distribution would be more pronounced if the preferential alignment of mineral crystals in bone is further deviated from the loading direction. This could be governed not only by the initial orientation distribution of mineral crystals (which is only shown here in Fig. 4), but also their redistributions with the applied loads (Giri et al., 2009) and the offset of loading axis with the preferential direction of the crystals. This is an important issue that needs more detailed investigation in the future.
Next, deformation of the individual subsets mineral crystals aligned in different orientations was considered in this study in order to obtain more details pertaining to the local behavior of the mineral phase in bone. The results indicated that the average in situ strains of each subset of mineral crystals was indeed different from the average strains estimated using the biaxial model of mineral aggregate reported in the literature (Fig. 5) (He and Smith, 1997). In addition, we found that the contribution of each subset of mineral crystals to the deformation of bone in the loading direction varied significantly with its orientation (Fig. 7a-1). By considering the symmetric nature of orientation distribution of mineral crystals, such changes may be significantly different if the loading direction is inclined with respect to the longitudinal axis of bone (Fig. 7a-2).
Another important result obtained from this study is that the contribution of mineral crystals to load bearing of bone is evidently dependent on their orientation distribution. Reflected by the significantly higher longitudinal stress (σx), the mineral crystals whose c-axis is aligned in the loading direction are found to carry most of the load compared with those aligned towards the transverse direction (Figs. 8a-1). When taking into account the effect of orientation distribution (ODF()), such differences become more prominent (Fig. 8a-2). While the average transverse stress (σy) is negligible even with larger scattering (Fig. 8b-2), it is noteworthy that the shear stress (σxy) is appreciable for the crystals aligned within ±30° about the loading direction (Fig. 8c-2). Since bone is a composite material in nature, the shear stress might be induced by the deformation mismatch between mineral crystals and collagen phase even though only uniaxial load is applied. Furthermore, the orientation-dependence of mineral strains and stresses are also related to the anisotropic nature of the crystals since they are stiffer in c-axis than in a-axis (Katz and Meuner, 1987; Gardner et al., 1992; Sha et al., 1994). It is noteworthy that the measured strain and stress data obtained in this study support neither isostrain nor isostress assumptions (Voigt and Reuss models), showing the load carrying capacity of mineral varies with orientations. In fact, such a phenomenon was also reported in the literature. For instance, the higher c-axis strains compared to a-axis strains along the loading direction were noted in the mineral crystals in bovine (Akhtar et al., 2011) and antler (Akhtar et al., 2008) trabecular bones and the bone mechanical properties have been shown to correlate with the orientation distribution of mineral crystals (Deuerling et al., 2009; Giri et al., 2009). The mechanical anisotropy of bone is also dependent on several other factors, such as preferential orientation distribution of collagen fibers and distribution of intra/extrafibrillar crystals.
By examining the maximum principal and shear stresses (σ1 and σxymax) in mineral crystals, it was found that the mineral crystals aligned in the loading direction were stressed most (Fig. 9a-1, 9b-1), thus implying that any potential damage to the mineral phase is likely to occur in the mineral crystals aligned in the loading direction. In addition, the direction of the maximum shear stress changed between 30°~45°, and the principal stress direction varied between 0°~14° with respect to the loading direction for mineral crystals aligned in all orientations (Fig. 9a-2, 9b-2). When the direction of the maximum shear stress coincides with the long axis (c-axis) of the mineral crystals, the maximum shear stress would most likely occur at the interface between the crystals and the surrounding matrix. As shown in Fig. 9b-2, the mineral crystals aligned in −30° are coincided with the direction of maximum shear stress compared to the crystals in other orientations, thus suggesting possible interfacial failures along the orientation of about 30°. This observation is in good agreement with the results reported in the previous studies, in which cross-hatch cracks in bone were observed in a similar orientation range (between 30°~40°) under compression (Ebacher, 2007). In fact, investigators have speculated that interfibrillar shear and sliding may be an important mechanism for the plastic deformation of bone (Gupta et al., 2006). The observations noted in trabecular bone also depicted that the local strains may be much larger than the apparent strain exerted on the specimen resulting in the localized structural damage in shear bands (Nazarian and Müller, 2004). While further investigation is required, the maximum shear direction observed in this study and its relation to the possible interfacial failure could be directly or indirectly linked to the average collagen fibril orientation in bone. Studies have already shown that the average fibril orientation is mainly along 30° with respect to the longitudinal axis of bone (Turner et al., 1995; Wagermaier et al., 2006; Weiner, 1997).
It is also notable that the average strain of the mineral phase in the longitudinal axis is much smaller than the bulk strain of bone, whereas the longitudinal stress is much higher than the bulk stress applied to bone (Table 1). This further clarifies that mineral crystals in bone are a major contributor to the load bearing (particularly those aligned along the loading axis), but contribute much less in the bulk deformation of bone and responsible for providing the stiffness to the bone. In fact, the bulk deformation of bone may be compensated by the deformation of collagen fibrils and other matrix components (e.g. non-collagenous proteins, etc.). Previous studies have already reported that the deformation of collagen fibrils is much higher (about two times) than that of mineral crystals (Almer and Stock, 2007; Dong et al., 2011; Gupta et al., 2006). However, it should be pointed out that the bulk strain measured in this study was not the exact strain with an error of about 40% induced by the system compliance since the extensometer was mounted to the loading platens instead of the specimen itself in order to avoid its interference with X-ray beam. Nonetheless, use of these values for qualitative analyses should be still valid.
Several limitations are, however, imposed upon this study. First, the X-ray scattering measurements were carried out with fixed orientation of bone specimens and the information about the orientation distribution of mineral crystals is only two-dimensional. Nonetheless, it is presumable that a symmetrical orientation distribution of mineral crystals exists with respect to the loading axis (Fig. 4). One can expect a similar orientation pattern in all planes rotating about this longitudinal axis and evidently a transversely isotropic state (Sasaki et al., 1989). In addition, it is legitimate to consider that shear is negligible in the cross-section of the bone specimens under uniaxial loading condition. Moreover, the plane stress state was assumed in this study to provide a simplified estimate of the response of infinitesimal stress elements (mineral crystals) at any point to the load. This is valid only when the loading axis coincides with the axis of symmetry of distribution. If the loading axis is offset with respect to the symmetric axis, uneven deformation would be induced and the plane stress state might no longer be guaranteed. From the diffraction profile broadening, size and shape of the crystals can be quantified (Almer and Stock, 2005). However, the influence of size and shape of mineral crystals (Landis, 1995) were not considered in this study. Such effects are expected to be limited since the bone specimens used in this study are taken from the same anatomic location and from donors with similar ages and the same gender. The detailed analysis on this aspect is planned for future studies. Moreover, only mineral crystals were studied in this study. It is known that the collagen fibers experience higher strains than mineral crystals (Almer and Stock, 2007; Dong et al., 2011; Gupta et al., 2006) and that both the phases are aligned in the similar orientations (Giraud Guille et al., 2005; Wagermaier et al., 2006). Thus, combining deformation of collagen fibers may further shed light on the contribution of minerals crystals to the bulk behavior of bone. Finally, the relative roles of extra- and intrafibrillar mineral crystals are not differentiated in this study. In fact, the arrangement and fraction of extra- and intrafibrillar crystals are still in debate in the scientific community (Nikolov and Raabe, 2008; Pidaparti et al., 1996) and need further investigations. Furthermore, the orientation distribution of mineral crystals at microstructural levels, such as in osteons (Rindby et al., 1998), were not considered in this study. However, this information is important in understanding the contribution of mineral phase to the mechanical behavior of bone at microstructures. These issues will be considered in future studies.
In conclusion, using the novel approaches proposed in this study it is revealed that a major portion of mineral crystals (>50%) are aligned within ±30° with respect to the longitudinal axis of bone. In addition, the mineral crystals aligned in distinct orientations deform rather differently, showing that the crystals aligned about the loading direction carry most load and dominate the average deformation of the mineral phase compared to the crystals lying in other orientations. Consequently, these load-bearing mineral crystals would be more prone to load-induced damage. Moreover, the maximum shear stress occurs in the mineral crystals that are aligned in about 30° with respect to the loading direction, suggesting that the interfacial damage between the mineral crystals and the surrounding matrix is most likely induced along such orientations.
Highlights
Local deformation behavior of mineral phase in bone as a function of orientation
Variation in the in situ stress/strain of mineral crystals with orientation
Contribution of mineral crystals to load bearing dependent on their orientation distribution
Correlation of in situ mechanical behavior with the bulk mechanical behavior of bone
ACKNOWLEDGEMENT
This study was partially supported by a NIH/NIAMS grant (1R01AR055955) and a NSF/CREST grant (HRD-0932339). The authors are grateful of Mr. Siyuan Ding for his assistance in preparing all bone specimens. Use of the Advanced Photon Source is supported by the U.S. Department of Energy (Office of Science) under Contract No. DE-AC02-06CH11357.
Footnotes
Publisher's Disclaimer: This is a PDF file of an unedited manuscript that has been accepted for publication. As a service to our customers we are providing this early version of the manuscript. The manuscript will undergo copyediting, typesetting, and review of the resulting proof before it is published in its final citable form. Please note that during the production process errors may be discovered which could affect the content, and all legal disclaimers that apply to the journal pertain.
Finally, it is observed that the average strain and stress (, ) along the loading axis of all mineral crystals differ approximately by 20% (at yield) from those obtained from the subset of crystals aligned in the loading direction (, ) (Table 2). In addition, their difference is not considerable irrespective of the status of bone deformation (i.e., ranging approximately from 20% at pre-yield to 15% at post-yield). These results suggest that even though only about 5% of the mineral crystals are aligned along the loading direction, these mineral crystals actually dominate the overall deformation of the mineral phase under the test conditions of this study and contribute more to the load-bearing than the mineral crystals oriented in other directions. However, the results might differ if the specimens are loaded off-axis from the preferential orientation of bone (Giri et al., 2009).
REFERENCES
- Akhtar R, Daymond MR, Almer JD, Mummery PM. Elastic strains in antler trabecular bone determined by synchrotron X-ray diffraction. Acta Biomaterialia. 2008;4:1677–1687. doi: 10.1016/j.actbio.2008.05.008. [DOI] [PubMed] [Google Scholar]
- Akhtar R, Daymond MR, Almer JD, Mummery PM. Lattice strains and load partitioning in bovine trabecular bone. Acta Biomaterialia. 2011;7:716–723. doi: 10.1016/j.actbio.2010.10.007. [DOI] [PubMed] [Google Scholar]
- Almer JD, Stock SR. Internal strains and stresses measured in cortical bone via high-energy X-ray diffraction. Journal of Structural Biology. 2005;152:14–27. doi: 10.1016/j.jsb.2005.08.003. [DOI] [PubMed] [Google Scholar]
- Almer JD, Stock SR. Micromechanical response of mineral and collagen phases in bone. Journal of Structural Biology. 2007;157:365–370. doi: 10.1016/j.jsb.2006.09.001. [DOI] [PubMed] [Google Scholar]
- Ammann P, Rizzoli R. Bone strength and its determinants. Osteoporosis International. 2003;14:S13–18. doi: 10.1007/s00198-002-1345-4. [DOI] [PubMed] [Google Scholar]
- Ascenzi A, Bigi A, Koch MH, Ripamonti A, Roveri N. A low-angle X-ray diffraction analysis of osteonic inorganic phase using synchrotron radiation. Calcified Tissue International. 1985;37:659–664. doi: 10.1007/BF02554926. [DOI] [PubMed] [Google Scholar]
- Ascenzi A, Bonucci E, Ripamonti A, Roveri N. X-ray diffraction and electron microscope study of osteons during calcification. Calcified Tissue Research. 1978;25:133–143. doi: 10.1007/BF02010762. [DOI] [PubMed] [Google Scholar]
- Ascenzi M, Ascenzi A, Benvenuti A, Burghammer M, Panzavolta S, Bigi A. Structural differences between“dark” and “bright” isolated human osteonic lamellae. Journal of Structural Biology. 2003;141:22–33. doi: 10.1016/s1047-8477(02)00578-6. [DOI] [PubMed] [Google Scholar]
- Chavassieux P, Seeman E, Delmas PD. Insights into material and structural basis of bone fragility from diseases associated with fractures: how determinants of the biomechanical properties of bone are compromised by disease. Endocrine Reviews. 2007;28:151–164. doi: 10.1210/er.2006-0029. [DOI] [PubMed] [Google Scholar]
- Dalle Carbonare L, Giannini S. Bone microarchitecture as an important determinant of bone strength. Journal of Endocrinological Investigation. 2004;27:99–105. doi: 10.1007/BF03350919. [DOI] [PubMed] [Google Scholar]
- Deuerling JM, Yue W, Espinoza Orías AA, Roeder RK. Specimen-specific multi-scale model for the anisotropic elastic constants of human cortical bone. Journal of Biomechanics. 2009;42:2061–2067. doi: 10.1016/j.jbiomech.2009.06.002. [DOI] [PMC free article] [PubMed] [Google Scholar]
- Dong XN, Almer JD, Wang X. Post-yield nanomechanics of human cortical bone in compression using synchrotron X-ray scattering techniques. Journal of Biomechanics. 2011;44:676–682. doi: 10.1016/j.jbiomech.2010.11.003. [DOI] [PMC free article] [PubMed] [Google Scholar]
- Ebacher V. Strain redistribution and cracking behavior of human bone during bending. Bone. 2007;40:1265–1275. doi: 10.1016/j.bone.2006.12.065. [DOI] [PubMed] [Google Scholar]
- Fratzl P, Groschner M, Vogl G, Plenk H, Jr., Eschberger J, Fratzl-Zelman N, Koller K, Klaushofer K. Mineral crystals in calcified tissues: a comparative study by SAXS. Journal of Bone and Mineral Research. 1992;7:329–334. doi: 10.1002/jbmr.5650070313. [DOI] [PubMed] [Google Scholar]
- Fujisaki K, Tadano S. Relationship between bone tissue strain and lattice strain of HAp crystals in bovine cortical bone under tensile loading. Journal of Biomechanics. 2007;40:1832–1838. doi: 10.1016/j.jbiomech.2006.07.003. [DOI] [PubMed] [Google Scholar]
- Gardner TN, Elliott JC, Sklar Z, Briggs GA. Acoustic microscope study of the elastic properties of fluorapatite and hydroxyapatite, tooth enamel and bone. Journal of Biomechanics. 1992;25:1265–1277. doi: 10.1016/0021-9290(92)90282-6. [DOI] [PubMed] [Google Scholar]
- Giraud Guille MM, Mosser G, Helary C, Eglin D. Bone matrix like assemblies of collagen: from liquid crystals to gels and biomimetic materials. Micron. 2005;36:602–608. doi: 10.1016/j.micron.2005.07.005. [DOI] [PubMed] [Google Scholar]
- Giri B, Tadano S, Fujisaki K, Sasaki N. Deformation of mineral crystals in cortical bone depending on structural anisotropy. Bone. 2009;44:1111–1120. doi: 10.1016/j.bone.2009.01.394. [DOI] [PubMed] [Google Scholar]
- Gupta HS, Seto J, Wagermaier W, Zaslansky P, Boesecke P, Fratzl P. Cooperative deformation of mineral and collagen in bone at the nanoscale. Proceedings of the National Academy of Sciences of the United States of America. 2006;103:17741–17746. doi: 10.1073/pnas.0604237103. [DOI] [PMC free article] [PubMed] [Google Scholar]
- Handschin RG, Stern WB. X-ray diffraction studies on the lattice perfection of human bone apatite (Crista Iliaca) Bone. 1995;16:S355–S363. [PubMed] [Google Scholar]
- He BB, Smith KL. Strain and stress measurements with a two-dimensional detector. Advanced X-ray Analysis. 1997;41:501–508. [Google Scholar]
- Landis WJ. The strength of a calcified tissue depends in part on the molecular structure and organization of its constituent mineral crystals in their organic matrix. Bone. 1995;16:533–544. doi: 10.1016/8756-3282(95)00076-p. [DOI] [PubMed] [Google Scholar]
- Lees S, Hukins DW. X-ray diffraction by collagen in the fully mineralized cortical bone of cow tibia. Bone and Mineral. 1992;17:59–63. doi: 10.1016/0169-6009(92)90710-u. [DOI] [PubMed] [Google Scholar]
- Leng H, Dong XN, Wang X. Progressive post-yield behavior of human cortical bone in compression for middle-aged and elderly groups. Journal of Biomechanics. 2009;42:491–497. doi: 10.1016/j.jbiomech.2008.11.016. [DOI] [PMC free article] [PubMed] [Google Scholar]
- Nazarian A, Müller R. Time-lapsed microstructural imaging of bone failure behavior. Journal of Biomechanics. 2004;37:55–65. doi: 10.1016/s0021-9290(03)00254-9. [DOI] [PubMed] [Google Scholar]
- Nikolov S, Raabe D. Hierarchical modeling of the elastic properties of bone at submicron scales: the role of extrafibrillar mineralization. Biophysical Journal. 2008;94:4220–4232. doi: 10.1529/biophysj.107.125567. [DOI] [PMC free article] [PubMed] [Google Scholar]
- Nyman JS, Leng H, Dong XN, Wang X. Differences in the mechanical behavior of cortical bone between compression and tension when subjected to progressive loading. Journal of the Mechanical Behavior of Biomedical Materials. 2009;2:613–619. doi: 10.1016/j.jmbbm.2008.11.008. [DOI] [PMC free article] [PubMed] [Google Scholar]
- Pidaparti RM, Chandran A, Takano Y, Turner CH. Bone mineral lies mainly outside collagen fibrils: predictions of a composite model for osteonal bone. Journal of Biomechanics. 1996;29:909–916. doi: 10.1016/0021-9290(95)00147-6. [DOI] [PubMed] [Google Scholar]
- Rindby A, Voglis P, Engström P. Microdiffraction studies of bone tissues using synchrotron radiation. Biomaterials. 1998;19:2083–2090. doi: 10.1016/s0142-9612(98)00120-3. [DOI] [PubMed] [Google Scholar]
- Sasaki N, Matsushima N, Ikawa T, Yamamura H, Fukuda A. Orientation of bone mineral and its role in the anisotropic mechanical properties of bone--transverse anisotropy. Journal of Biomechanics. 1989;22:157–164. doi: 10.1016/0021-9290(89)90038-9. [DOI] [PubMed] [Google Scholar]
- Schnitzler CM. Bone quality: a determinant for certain risk factors for bone fragility. Calcified Tissue International. 1993;53:S27–31. doi: 10.1007/BF01673398. [DOI] [PubMed] [Google Scholar]
- Seeman E. Unresolved issues in osteoporosis in men. Reviews in Endocrine & Metabolic Disorders. 2001;2:45–64. doi: 10.1023/a:1010054924085. [DOI] [PubMed] [Google Scholar]
- Tanaka T, Yagi N, Ohta T, Matsuo Y, Terada H, Kamasaka K, To-o K, Kometani T, Kuriki T. Evaluation of the distribution and orientation of remineralized enamel crystallites in subsurface lesions by X-ray diffraction. Caries Research. 2010;44:253–259. doi: 10.1159/000314672. [DOI] [PubMed] [Google Scholar]
- Taylor A, Leber S. Crystallographic angles for hexagonal metals. Journal of Metals. 1954;207E:190–192. [Google Scholar]
- Tesch W, Vandenbos T, Roschgr P, Fratzl-Zelman N, Klaushofer K, Beertsen W, Fratzl P. Orientation of mineral crystallites and mineral density during skeletal development in mice deficient in tissue nonspecific alkaline phosphatase. Journal of Bone and Mineral Research. 2003;18:117–125. doi: 10.1359/jbmr.2003.18.1.117. [DOI] [PubMed] [Google Scholar]
- Turner CH. Biomechanics of bone: determinants of skeletal fragility and bone quality. Osteoporosis International. 2002;13:97–104. doi: 10.1007/s001980200000. [DOI] [PubMed] [Google Scholar]
- Turner CH, Chandran A, Pidaparti RMV. The anisotropy of osteonal bone and its ultrastructural implications. Bone. 1995;17:85–89. doi: 10.1016/8756-3282(95)00148-7. [DOI] [PubMed] [Google Scholar]
- Wagermaier W, Gupta HS, Gourrier A, Burghammer M, Roschger P, Fratzl P. Spiral twisting of fiber orientation inside bone lamellae. Biointerphases. 2006;1:1–6. doi: 10.1116/1.2178386. [DOI] [PubMed] [Google Scholar]
- Wang X, Nyman JS. A novel approach to assess post-yield energy dissipation of bone in tension. Journal of Biomechanics. 2007;40:674–677. doi: 10.1016/j.jbiomech.2006.02.002. [DOI] [PMC free article] [PubMed] [Google Scholar]
- Weiner S. Rotated plywood structure of primary lamellar bone in the rat: orientations of the collagen fibril arrays. Bone. 1997;20:509–514. doi: 10.1016/s8756-3282(97)00053-7. [DOI] [PubMed] [Google Scholar]
- Yamagishi S, Nakamura K, Inoue H. Possible participation of advanced glycation end products in the pathogenesis of osteoporosis in diabetic patients. Medical Hypotheses. 2005;65:1013–1015. doi: 10.1016/j.mehy.2005.07.017. [DOI] [PubMed] [Google Scholar]
- Yeni YN, Zinno MJ, Yerramshetty JS, Zauel R, Fyhrie DP. Variability of trabecular microstructure is age-, gender-, race- and anatomic site-dependent and affects stiffness and stress distribution properties of human vertebral cancellous bone. Bone. 2011;49:886–894. doi: 10.1016/j.bone.2011.07.006. [DOI] [PMC free article] [PubMed] [Google Scholar]