

Abstract
Purpose
The purpose of this study was to examine lumbar segmental mobility using kinetic magnetic resonance imaging (MRI) in patients with minimal lumbar spondylosis.
Methods
Mid-sagittal images of patients who underwent weight-bearing, multi-position kinetic MRI for symptomatic low back pain or radiculopathy were reviewed. Only patients with a Pfirrmann grade of I or II, indicating minimal disc disease, in all lumbar discs from L1–2 to L5–S1 were included for further analysis. Translational and angular motion was measured at each motion segment.
Results
The mean translational motion of the lumbar spine at each level was 1.38 mm at L1–L2, 1.41 mm at L2–L3, 1.14 mm at L3–L4, 1.10 mm at L4–L5 and 1.01 mm at L5–S1. Translational motion at L1–L2 and L2–L3 was significantly greater than L3–4, L4–L5 and L5–S1 levels (P < 0.007). The mean angular motion at each level was 7.34° at L1–L2, 8.56° at L2–L3, 8.34° at L3–L4, 8.87° at L4–L5, and 5.87° at L5–S1. The L5–S1 segment had significantly less angular motion when compared to all other levels (P < 0.006). The mean percentage contribution of each level to the total angular mobility of the lumbar spine was highest at L2–L3 (22.45 %) and least at L5/S1 (14.71 %) (P < 0.001).
Conclusion
In the current study, we evaluated lumbar segmental mobility in patients without significant degenerative disc disease and found that translational motion was greatest in the proximal lumbar levels whereas angular motion was similar in the mid-lumbar levels but decreased at L1–L2 and L5–S1.
Keywords: Segmental motion, Lumbar spine, Kinetic magnetic resonance imaging, Degeneration
Introduction
Lumbar disc degeneration, a common cause of low back pain, can be associated with lumbar spine segmental instability [1, 2]. Spinal instability is defined as excessive motion beyond the normal range of vertebral motion [3, 4], which can cause compression or stretching of the neural elements, or result in abnormal deformations of sagittal spinal alignment. Studies have evaluated instability by measuring segmental motion in the lumbar spine using a variety of methods, including flexion–extension radiographs [5], CT-based approaches [6], and invasive spinous wires [7]. The effectiveness of these techniques is limited by the associated radiation exposure, decreased accuracy secondary to differences in magnification of plain films, and small sample sizes of subjects and morbidity associated with invasive techniques.
Magnetic resonance imaging (MRI) has become the preferred diagnostic method for intervertebral disc pathology [8], as degenerative changes in the disc such as loss of water and proteoglycan content are reflected in MR images. Kinetic magnetic resonance imaging (kMRI) can be a valuable modification to traditional MRI in which images can be obtained of patients in weight-bearing flexion–extension positions. This provides additional information unavailable on normal supine MR imaging of the spine and can be used to noninvasively demonstrate the mobility of each motion segment and define regions of spine motion. Combined with digital imaging software that allows accurate, reproducible measurements of distance and quantification of motion, kMRI represents a useful tool in analyzing spinal kinematics.
Using kMRI, previous studies have shown the effect of lumbar disc degeneration on lumbar segmental mobility [9, 10]. In addition to understanding how spondylosis affects lumbar segmental motion, it is important to define lumbar segmental motion in patients without significant spondylosis. Knowing the relative contributions of each lumbar motion unit to lumbar segmental mobility may allow surgeons to predict the impact that pathologic changes or surgical interventions, such as fusion at a given motion segment, may have on adjacent levels and to further evaluate the cause of adjacent segment disease.
In the current study, we aim to determine the kinematics of each spinal motion unit in the lumbar spine in patients without significant degenerative disc disease and thus establish normal values for translational and angular lumbar segmental motion and the relative contribution of each segment to total lumbar segmental motion.
Materials and methods
Lumbar disc degeneration and disc grading system
All patients were referred for kMRI due to complaints of low back pain with or without leg pain. Three blinded spine surgeons (A–C) graded the degree of disc degeneration using T2-weighted neutral sagittal images according to the grading system proposed by Pfirrmann et al. [8] (Table 1). Grade I (Fig. 1a) and grade II (Fig. 1b) discs were considered mildly degenerative discs. Grade III and grade IV discs were considered moderately degenerative discs. Grade V discs were classified as severely degenerated discs. The reliability of the MR imaging grading was estimated using agreement percentages and kappa statistics within each observer (intra-observer reliability) and between the three observers (inter-observer reliability). The agreement was listed as follows: kappa values 0–0.2 indicated slight agreement; 0.21–0.4 fair agreement; 0.41–0.60 moderate agreement; 0.61–0.8 substantial agreement; and ≥ 0.81 excellent agreement. Only patients with grade I or II discs at all lumbar vertebral levels (Fig. 1c) were included (i.e. a patient with a grade III disc or higher at any lumbar level was excluded).
Table 1.
Pfirrmann classification of disc degeneration
| Grade | Structure | Distinction of nucleus and anulus | Signal intensity | Height of intervertebral disc |
|---|---|---|---|---|
| I | Homogeneous, bright white | Clear | Hyperintense, isointense to cerebrospinal fluid | Normal |
| II | Inhomogeneous with or without horizontal bands | Clear | Hyperintense, isointense to cerebrospinal fluid | Normal |
| III | Inhomogeneous, grey | Unclear | Intermediate | Normal to slightly decreased |
| IV | Inhomogeneous, grey to black | Lost | Intermediate to hypointense | Normal to moderately decreased |
| V | Inhomogeneous, black | Lost | Hypointense | Collapsed disc space |
Fig. 1.
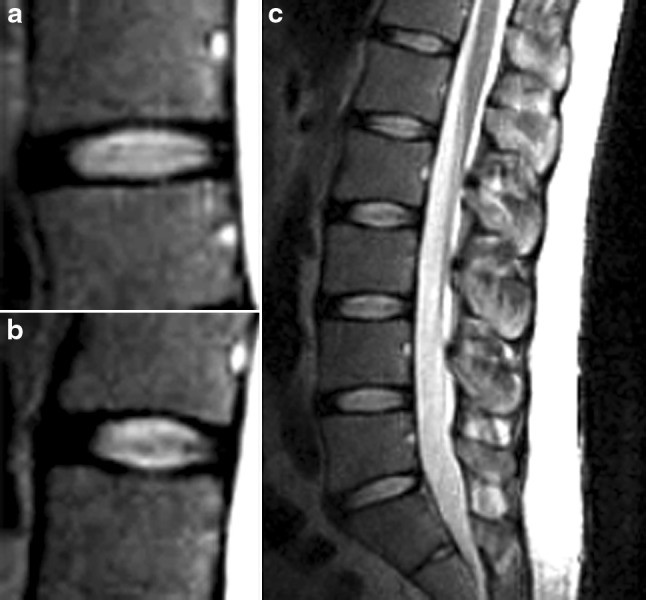
Grading of lumbar intervertebral discs was performed based on the grading system proposed by Pfirrmann et al. for degenerative changes. a Grade I: the structure of the disc is homogeneous, with a bright or hyper-intense white signal intensity in addition to a normal disc height. b Grade II: the structure of the disc is inhomogeneous, with a hyper-intense white signal. The distinction between nucleus and anulus is clear, but the disc height is normal, with or without horizontal gray bands. c Only patients demonstrating grade I or II discs at all lumbar levels were included in the study
Patient population
Of over 550 lumbar MRIs were reviewed, and 100 patients (500 intervertebral discs) were identified that met the inclusion criteria. A total of 43 female and 57 male patients were included and the mean age of participants was 32.6 years (range 18–57 years). Exclusion criteria included a previous history of spinal surgery, vertebral fractures, tumor, spondylolisthesis, or scoliotic deformity. The Institutional Review Board approved this study and informed consent was obtained from all participants. The study measured all functional lumbar spinal levels (L1–L2, L2–L3, L3–L4, L4–L5, and L5–S1).
Kinetic MR imaging
MRI of the spine was performed using a 0.6 tesla MRI scanner (Upright Multi-Position, Fonar Corp., New York, NY). Two vertically orientated opposing magnetic doughnuts placed 18 in. apart were used, allowing scanning of the patient standing in an upright axially loaded position. A quad channel planar coil was used to obtain images. We examined the T1-weighted sagittal spin echo images (repetitive time 671 ms, echo time 17 ms, thickness 4.0 mm, field of view 30 cm, matrix 256 × 224, NEX 2) and T2-weighted fast spin echo images (repetition time 3,000 ms, echo time 140 ms, thickness 4.0 mm, field of view 30 cm, matrix 256 × 224, NEX 2) of each patient. All patients were scanned in flexion (30°), neutral, and extension (20°) positions.
Measurements of segmental translational and angular motion
Mid-sagittal T2-weighted images were marked for digitalization by a spine surgeon from L1 to S1 on the flexion, neutral and extension position images. The vertebral body was marked at four points (anterior–inferior, anterior–superior, posterior–superior, and posterior–inferior corners). Segmental translational and angular motion were calculated using MRI analyzer Version 3 software (Truemetric Corp., Bellflower, CA) as previously described [11]. The amount of segmental translation was defined as the difference in displacement between two vertebrae from flexion to extension (Fig. 2a, b). Segmental angular motion was defined as the difference in intervertebral angles between two adjacent vertebrae from flexion to extension (Fig. 2c, d).
Fig. 2.

Translational and angular motion from flexion to extension as measured by MR Analyzer computer-based software on sagittal MR images. a Translational motion in flexion. b Translational motion in extension. Total translational motion is calculated using the following equation: A + P (P + A) or A − A (P − P). At the L4–L5 level, for example, total translational motion is 1.5(A)−0.1(A) = 1.4 mm. c Angular motion in flexion. d Angular motion in extension. Total angular motion is calculated as the absolute value of the difference between the angle between adjacent vertebral bodies in flexion and in extension in degrees. At the L4–L5 level, for example, the total angular motion is 2.5−10.1 = 7.6°
The percentage contribution of each individual segment to the total angular mobility of the lumbar spine was measured to elucidate the role of each spine unit in the changes of sagittal alignment and was defined as follows: [(sagittal angular motion of each segment in degrees)/(total sagittal angular motion in degrees) × 100].
Statistical analysis
All statistical analyses were performed using SPSS software (version 15, SPSS, Chicago, IL). The Mann–Whitney test was used to make comparisons among the five lumbar levels. A P value less than 0.05 represented a significant difference.
Results
Intra- and inter-observer agreement
The kappa values for intra- and inter-observer agreement for grading of the intervertebral discs on the 100 subjects are listed in Table 2. Intra-observer agreement among the three observers was excellent with kappa values ranging from 0.976 to 0.985. Similarly, inter-observer agreement results were excellent, with kappa values ranging from 0.962 to 0.970.
Table 2.
Intra- and inter-observer reliability for intervertebral disc grading
| Intra-observer | Inter-observer | ||||
|---|---|---|---|---|---|
| Observer | Kappa value | Agreement (%) | Observer | Kappa value | Agreement (%) |
| A | 0.982 | 98.3 | A–B | 0.968 | 97.8 |
| B | 0.990 | 98.5 | A–C | 0.946 | 96.2 |
| C | 0.978 | 97.6 | B–C | 0.973 | 96.5 |
A, B, and C represent three independent blinded observers grading the lumbar discs
Translational motion
The average translational motion of the lumbar spine at each level was 1.38 ± 0.78 mm at L1–L2, 1.41 ± 0.95 mm at L2–L3, 1.14 ± 1.09 mm at L3–L4, 1.10 ± 0.89 mm at L4–L5 and 1.01 ± 1.00 mm at L5–S1 (Table 3; Fig. 3a). The L1–2 and L2–3 motion units had significantly greater translational motion than L3–4, L4–L5 and L5–S1 levels (P < 0.007). In general, the translational motion decreased from proximal to distal levels.
Table 3.
Segmental mobility of the lumbar spine by level
| Spine levels | Translational motion (mm) | Angular motion (°) | Percentage of total angular mobility (%) |
|---|---|---|---|
| L1–L2 | 1.38 ± 0.78* | 7.34 ± 4.00** | 19.32 ± 9.68 |
| L2–L3 | 1.41 ± 0.95* | 8.56 ± 4.07 | 22.45 ± 10.69 |
| L3–L4 | 1.14 ± 1.09 | 8.34 ± 3.83 | 21.50 ± 8.36 |
| L4–L5 | 1.10 ± 0.89 | 8.87 ± 5.41 | 22.03 ± 11.52 |
| L5–S1 | 1.01 ± 1.00 | 5.87 ± 4.45** | 14.71 ± 9.86† |
Values presented as mean ± SD
* Significant difference between L1–L2 and L2–L3 compare to all other levels (P < 0.007)
** Significant difference between L5–S1 and L1–L2 when compared to all other levels (P < 0.05)
† L5–S1 contributes significantly less to total angular mobility when compared with all other levels (P < 0.001)
Angular motion
The mean angular motion of the lumbar spine at each level was 7.34 ± 4.00° at L1–L2, 8.56 ± 4.07° at L2–L3, 8.34 ± 4.83° at L3–L4, 8.87 ± 5.41° at L4–L5, and 5.87 ± 4.45° at L5–S1 (Table 3; Fig. 3b). The angular motion of the lumbar spine was increased from L1–L2 to L2–L3 (P = 0.015). Angular motion was noted to be similar in the middle lumbar segments (L2–L3 to L4–L5) and then significantly decreased at the L5–S1 segment (P < 0.006). With respect to the individual contribution of each segment to the total angular mobility of the lumbar spine, the L5–S1 segmental units contributed the least (Fig. 4), with a significant difference when compared with L1–L2 (P = 0.001), L2–L3 (P = 0.000), L3–L4 (P = 0.000) and L4–L5 (P = 0.000) (Table 3).
Fig. 3.

a Translational motion by spinal level. Asterisk represents a significantly larger contribution from L1–2 to L2–3 motion units in comparison with L3–4, L4–L5 and L5–S1 (P < 0.007). b Angular motion at each level. Asterisk represents a significantly smaller contribution from the L1–2 and L5–S1 motion units when compared with all other levels of the lumbar spine (P < 0.05)
Fig. 4.

Percentage of angular motion contributed by each level to total angular mobility. Asterisk represents significantly lower contribution of L5–S1 functional unit to total angular mobility when compared with all other lumbar levels (P < 0.001)
Gender analysis
A total of 43 females and 57 males were included in the study. Comparisons between genders were made in terms of translational and angular motion at each motion segment. No significant differences were observed between female and male patients at any lumbar motion segment (Table 4).
Table 4.
Segmental mobility stratified by gender
| Spinal levels | Translational motion (mm) | Angular motion (°) | ||||
|---|---|---|---|---|---|---|
| Male | Female | P value | Male | Female | P value | |
| L1–L2 | 1.48 ± 0.90 | 1.23 ± 0.56 | 0.194 | 6.91 ± 3.80 | 7.90 ± 4.23 | 0.224 |
| L2–L3 | 1.47 ± 1.04 | 1.33 ± 0.81 | 0.678 | 8.89 ± 4.43 | 8.13 ± 3.55 | 0.699 |
| L3–L4 | 1.16 ± 1.03 | 1.10 ± 1.16 | 0.560 | 7.98 ± 3.72 | 9.07 ± 3.88 | 0.110 |
| L4–L5 | 1.15 ± 0.95 | 1.01 ± 0.80 | 0.539 | 8.25 ± 5.53 | 9.69 ± 5.19 | 0.126 |
| L5–S1 | 0.94 ± 1.01 | 1.10 ± 1.03 | 0.216 | 6.22 ± 4.02 | 5.40 ± 4.99 | 0.131 |
| Total | 6.22 ± 2.92 | 5.78 ± 2.59 | 0.411 | 38.05 ± 11.10 | 40.20 ± 11.21 | 0.365 |
Male (n = 57, mean age 33.1), female (n = 43, mean age 31.9)
Values are presented as mean ± SD
P value was set as <0.05, and no significant differences were observed
Discussion
A thorough understanding of lumbar segmental motion is valuable to understand lumbar spine disease, and may help predict how treatments that affect lumbar segmental mobility will affect adjacent motion segments. In the current study, we evaluated several hundred lumbar spine MRIs and selected patients without significant spondylosis at any lumbar level to determine the relative contributions of each motion segment to translational and angular motion in the lumbar spine. Translational motion was greatest in the proximal lumbar levels whereas angular motion was similar in the mid-lumbar levels but decreased at L1–L2 and L5–S1.
Many investigations have reported attempting to define normal values of lumbar motion, including goniometry [12], cineradiography [13], and videofluoroscopy [14]. However, none of these studies have accurately assessed translational and angular motion at each motion segment in the lumbar spine. Ochia and colleagues [6] have published one of the few studies attempting to define lumbar segmental motion from L1 to S1 in patients without degenerative disc disease. Three-dimensional measurements were performed after CT scan of the lumbar spine of 16 healthy, asymptomatic volunteers with a mean age of 33.5 years for females and 35.9 for males. Similar to the current study, investigators found that lumbar angular mobility with flexion–extension was lowest at L1–2 and L5–S1 compared to the middle lumbar segments. However, lateral bending motion was greatest at L5–S1. No gender differences were observed.
Segmental instability in the lumbar spine, often defined as greater than 3 mm of translation in the AP direction [15, 16], is considered to be abnormal and has been associated with lower back pain and sciatica [1]. MRI studies of the lumbar spine have indicated that even small changes in translational motion are correlated with disc degeneration. Karadimas et al. [17] studied healthy and degenerative discs using positional MR images and found that changes in segmental motion were related to the degree of disc degeneration. Using kMRI, Kong et al. [9, 10] found that the prevalence of excessive translational motion significantly increased in patients with grade IV discs, but decreased when the disc degeneration advanced to grade V. Angular motion was similar regardless of disc grade, except in grade V degeneration in which angular motion decreased significantly.
However, in the analyses discussed above, the lumbar motion units were considered in isolation, without considering the effect of disc degeneration at one level on the segmental motion at adjacent or subadjacent levels. This distinction is important, and the effects of disc degeneration on lumbar segmental mobility have been observed clinically. In a comparison of rigid fusion versus dynamic non-fusion stabilization for L4–5 degenerative spondylolisthesis, Morishita et al. [18] found that a significant portion of angular motion occurred at L5–S1 (29–34 %) adjacent to the degenerative L4–5 level before treatment with fusion or dynamic stabilization. This is in contrast to our study of patients without significant spondylosis, in which the least angular motion occurred at L5–S1, accounting for only 14.7 % of total lumbar angular motion.
The assessment of lumbar motion is also of benefit for anticipating the effects of spinal fusion on adjacent, unfused segments and to help determine if adjacent segment disease is secondary to surgical fusion, or part of the natural history of lumbar spondylosis. Many clinical studies have described accelerated degeneration of lumbar segments adjacent to the site of a previous spinal fusion [19–21] and biomechanical studies have shown that lumbar fusion produces increased motion and increased intradiscal pressure at adjacent levels [22–25].
There are important limitations to the present study. Although we aimed to define normal values for lumbar segmental motion, patients were referred for an MRI based on symptoms of low back pain or radiculopathy and thus are not completely normal. In addition, to achieve a significant number of patients for analysis, patients with grade II discs were included in the study. Lastly, we have not taken into account the other factors that may affect segmental mobility, such as degenerative changes of the facet joint, ligamentum flavum, and paraspinal muscles. These structures also play an important role in determining abnormal segmental mobility individually or in combination with disc degeneration [3, 10]. Despite these limitations, this study evaluates lumbar segmental mobility in a large population of young patients with a safe and practical imaging technique.
Conclusion
In this study, we used kinetic MRI to measure lumbar segmental mobility in a young cohort of patients without significant spondylosis to define the relative contribution of each lumbar segment to lumbar motion. Information on lumbar spine kinematics is valuable for understanding and treating spine disorders such as degenerative disc disease and for evaluating phenomena such as adjacent segment disease. Additionally, this information will allow for future studies in which changes from these values are observed in patients with different pathologies of the lumbar spine.
Conflict of interest
None.
References
- 1.Kirkaldy-Willis WH, Farfan HF. Instability of the lumbar spine. Clin Orthop Relat Res. 1982;165:110–123. [PubMed] [Google Scholar]
- 2.Murata M, Morio Y, Kuranobu K. Lumbar disc degeneration and segmental instability:a comparison of magnetic resonance images and plain radiographs of patients with low back pain. Arch Orthop Trauma Surg. 1994;113:297–301. doi: 10.1007/BF00426175. [DOI] [PubMed] [Google Scholar]
- 3.Fujiwara A, Lim TH, An HS, et al. The effect of disc degeneration and facet joint osteoarthritis on the segmental flexibility of the lumbar spine. Spine. 2000;25:3036–3044. doi: 10.1097/00007632-200012010-00011. [DOI] [PubMed] [Google Scholar]
- 4.Iguchi T, Kanemura A, Kasahara K, Kurihara A, Doita M, Yoshiya S. Age distribution of three radiologic factors for lumbar instability: probable aging process of the instability with disc degeneration. Spine. 2003;28:2628–2633. doi: 10.1097/01.BRS.0000097162.80495.66. [DOI] [PubMed] [Google Scholar]
- 5.Frobin W, Brinckmann P, Leivseth G, et al. Precision measurement of segmental motion from flexion–extension radiographs of the lumbar spine. Clin Biomech (Bristol, Avon) 1996;11:457–465. doi: 10.1016/S0268-0033(96)00039-3. [DOI] [PubMed] [Google Scholar]
- 6.Ochia RS, Inoue N, Renner SM, et al. Three-dimensional in vivo measurement of lumbar spine segmental motion. Spine. 2006;31:2073–2078. doi: 10.1097/01.brs.0000231435.55842.9e. [DOI] [PubMed] [Google Scholar]
- 7.Steffen T, Rubin R, Baramki HG, Antoniou J, Marchesi D, Aebi M. A new technique for measuring lumbar segmental motion in vivo: method, accuracy, and preliminary results. Spine. 1996;22:156–166. doi: 10.1097/00007632-199701150-00006. [DOI] [PubMed] [Google Scholar]
- 8.Pfirrmann CW, Metzdorf A, Zanetti M, et al. Magnetic resonance classification of lumbar intervertebral disc degeneration. Spine. 2001;26:1873–1878. doi: 10.1097/00007632-200109010-00011. [DOI] [PubMed] [Google Scholar]
- 9.Kong MH, Hymanson HJ, Song KY, Chin DK, Cho YE, Yoon do H, et al. Kinetic magnetic resonance imaging analysis of abnormal segmental motion of the functional spine unit. J Neurosurg Spine. 2009;10:357–365. doi: 10.3171/2008.12.SPINE08321. [DOI] [PubMed] [Google Scholar]
- 10.Kong MH, Morishita Y, et al. Lumbar segmental mobility according to the grade of the disc, the facet joint, the muscle, and the ligament pathology by using kinetic magnetic resonance imaging. Spine. 2009;34:2537–2544. doi: 10.1097/BRS.0b013e3181b353ea. [DOI] [PubMed] [Google Scholar]
- 11.Zou J, Yan H, Miyasaki M, Wei F, Hong SW, Yoon SH, Morishita Y, Wang JC. Missed lumbar disc herniations diagnosed with kinetic magnetic resonance imaging. Spine. 2008;33(5):E140–E144. doi: 10.1097/BRS.0b013e3181657f7e. [DOI] [PubMed] [Google Scholar]
- 12.Fitzgerald GK, Wynveen KJ, Rheault W, et al. Objective assessment with establishment of normal values for lumbar spinal range of motion. Phys Ther. 1983;63:1776–1781. doi: 10.1093/ptj/63.11.1776. [DOI] [PubMed] [Google Scholar]
- 13.Harada M, Abumi K, Ito M, et al. Cineradiographic motion analysis of normal lumbar spine during forward and backward flexion. Spine. 2000;25:1932–1937. doi: 10.1097/00007632-200008010-00011. [DOI] [PubMed] [Google Scholar]
- 14.Okawa A, Shinomiya K, Komori H, et al. Dynamic motion study of the whole lumbar spine by videofluoroscopy. Spine. 1998;23:1743–1749. doi: 10.1097/00007632-199808150-00007. [DOI] [PubMed] [Google Scholar]
- 15.Kauppila LI, Eustace S, Kiel DP, et al. Degenerative displacement of lumbar vertebrae. A 25-year followup study in Framingham. Spine. 1998;23:1868–1874. doi: 10.1097/00007632-199809010-00014. [DOI] [PubMed] [Google Scholar]
- 16.Vogt MT, Rubin D, Valentin RS, et al. Lumbar spondylolisthesis and lower back symptoms in elderly white women. The Study of Osteoporotic Fractures. Spine. 1998;23:2640–2647. doi: 10.1097/00007632-199812010-00020. [DOI] [PubMed] [Google Scholar]
- 17.Karadimas EJ, Siddiqui M, Smith FW, Wardlaw D. Positional MRI changes in supine versus sitting postures in patients with degenerative lumbar spine. J Spinal Disord Tech. 2006;19:495–500. doi: 10.1097/01.bsd.0000211213.98070.c2. [DOI] [PubMed] [Google Scholar]
- 18.Morishita Y, Ohta H, Naito M, Matsumoto Y, Huang G, Tatsumi M, Takemitsu Y, Kida H. Kinematic evaluation of the adjacent segments after lumbar instrumented surgery: a comparison between rigid fusion and dynamic non-fusion stabilization. Eur Spine J. 2011;20(9):1480–1485. doi: 10.1007/s00586-011-1701-1. [DOI] [PMC free article] [PubMed] [Google Scholar]
- 19.Lee CK. Accelerated degeneration of the segment adjacent to a lumbar fusion. Spine. 1988;13:375–377. doi: 10.1097/00007632-198803000-00029. [DOI] [PubMed] [Google Scholar]
- 20.Park P, Garton HJ, Gala VC, et al. Adjacent segment disease after lumbar or lumbosacral fusion: review of the literature. Spine. 2004;29:1938–1944. doi: 10.1097/01.brs.0000137069.88904.03. [DOI] [PubMed] [Google Scholar]
- 21.Ghiselli G, Wang JC, Bhatia NN, et al. Adjacent segment degeneration in the lumbar spine. J Bone Joint Surg Am A. 2004;86:1497–1503. doi: 10.2106/00004623-200407000-00020. [DOI] [PubMed] [Google Scholar]
- 22.Lee CK, Langrana NA. Lumbosacral spinal fusion: a biomechanical study. Spine. 1984;9:574–581. doi: 10.1097/00007632-198409000-00007. [DOI] [PubMed] [Google Scholar]
- 23.Weinhoffer SL, Guyer RD, Herbert M, et al. Intradiscal pressure measurements above an instrumented fusion. Spine. 1995;20:526–531. doi: 10.1097/00007632-199503010-00004. [DOI] [PubMed] [Google Scholar]
- 24.Umehara S, Zindrick MR, Patwardhan AG, et al. The biomechanical effect of postoperative hypolordosis in instrumented lumbar fusion on instrumented and adjacent spinal segments. Spine. 2000;25:1617–1624. doi: 10.1097/00007632-200007010-00004. [DOI] [PubMed] [Google Scholar]
- 25.Akamuru T, Kawahara N, Tim Yoon S, et al. Adjacent segment motion after simulated lumbar fusion in different sagittal alignments: a biomechanical analysis. Spine. 2003;28:1560–1566. [PubMed] [Google Scholar]