

Abstract
Although nuclear copies of mitochondrial DNA (numts) can originate from any portion of the mitochondrial genome, evidence from humans suggests that more variable parts of the mitochondrial genome, such as the mitochondrial control region (MCR), are under-represented in the nucleus. This apparent deficit might arise from the erosion of sequence identity in numts originating from rapidly evolving mitochondrial sequences. However, the extent to which mitochondrial sequence properties impacts the number of numts detected in genomic surveys has not been evaluated. In order to address this question, we: (1) conducted exhaustive BLAST searches of MCR numts in three hominoid genomes; (2) assessed numt prevalence across the four MCR sub-domains (HV1, CCD, HV2, and MCRF); (3) estimated their insertion rates in great apes (Hominoidea); and (4) examined the relationship between mitochondrial DNA variability and numt prevalence in sequences originating from MCR and coding regions of the mitochondrial genome. Results indicate a marked deficit of numts from HV2 and MCRF MCR sub-domains in all three species. These MCR sub-domains exhibited the highest proportion of variable sites and the lowest number of detected numts per mitochondrial site. Variation in MCR insertion rate between lineages was also observed with a pronounced burst in recent integrations within chimpanzees and orangutans. A deficit of numts from HV2/MCRF was observed regardless of age, whereas HV1 is under-represented only in older numts (>25 million years). Finally, more variable mitochondrial genes also exhibit a lower identity with nuclear copies and because of this, appear to be under-represented in human numt databases.
Keywords: Mitochondrial DNA, Nuclear integration, Numt, Translocation, Hominoidea, Great ape
Introduction
Fragments of mitochondrial DNA (mtDNA) translocated into the nucleus (numts) are present in a wide range of eukaryotes (Du Buy and Riley 1967; Corral et al. 1989; Bensasson et al. 2001; Hazkani-Covo et al. 2010). Once integrated into the nucleus, numts escape from mitochondrial selective constraints (Perna and Kocher 1996; Bensasson et al. 2001) and generally experience mutation rates that are on average around one order of magnitude slower than the mitochondrial genome (Brown et al. 1982; Haag-Liautard et al. 2008; although see Lopez et al. 1997). For this reason, numts are usually considered “fossilized” copies of ancient mitochondrial lineages (Perna and Kocher 1996; Bensasson et al. 2001; Zischler et al. 1995), whose inadvertent amplification can potentially contaminate mitochondrial databases (Greenwood and Pääbo 1999; Jensen-Seaman et al. 2004; Anthony et al. 2007). Contamination of mitochondrial sequence databases is particularly acute for the mitochondrial control region (MCR) given its widespread use as a population genetic marker in many vertebrate taxa, including great apes (Sbisà et al. 1997; Jensen-Seaman and Kidd 2001; Arora et al. 2010). However, the prevalence of MCR integrations in many species remains poorly understood yet could have important implications for population genetic analyses of mitochondrial datasets.
A numt search in an early draft of the human genome showed an apparent deficit in the number of MCR numts compared to other mitochondrial regions (Mourier et al. 2001). Two possible explanations have been proposed to explain this observation. One states that if numts are predominately derived from RNA transcripts then untranscribed portions of the mitochondrial genome, such as the MCR, will be under-represented in the nuclear genome. Although such a mechanism of genetic transfer to the nucleus has been previously observed in plants (Nugent and Palmer 1991; Henze and Martin 2001), it remains to be shown that this is also the case in animals (Lopez et al. 1994; Henze and Martin 2001; Mourier et al. 2001). Alternatively, the deficit of numts originating from the MCR might be due to a detection bias arising from the high mutation rate of these regions and hence rapid loss in sequence identity relative to other portions of the mitochondrial genome (Saccone et al. 1991; Sbisà et al. 1997; Pesole et al. 1999; Mourier et al. 2001).
Compared to mitochondrial coding genes, the accumulation of insertions, deletions, and nucleotide substitutions is more common in non-coding mitochondrial regions such as the MCR (Sbisà et al. 1997). This region has a high prevalence of nucleotide repeats (i.e., low DNA complexity) and is known to have an elevated rate of change (Bodenteich et al. 1992; Sbisà et al. 1997; Zardoya and Meyer 1998). Over time, these properties of the MCR domain are expected to erode the mitochondrial sequence identity of the nuclear copies and thus explain the apparent numt deficit. Similarly, within the MCR, nucleotide variability and levels of DNA complexity are likely to differ among the four MCR sub-domains, potentially leading to differences in their apparent abundance in the nuclear genome. The vertebrate MCR domain is composed of two hyper-variable regions (HV1 and HV2), a conserved central domain (CCD), and a terminal portion adjacent to the phenylalanine tRNA gene (MCRF). In the mitochondrial genome of mammals, the sub-domains HV2 and MCRF exhibit considerable variation not only in nucleotide sequence composition and length but also in the proportion of repeat motifs (Sbisà et al. 1997). We, therefore, predict that more variable MCR sub-domains will exhibit a greater deficit in the number of numts identified in genomic databases and that this deficit would have arisen as a result of the greater difference in sequence identity observed between more variable mitochondrial sub-domains and their nuclear copies. Likewise, we also predict that more variable mitochondrial coding regions will exhibit a similar deficit in the number of detected numt copies.
Several studies have shown that in hominoids the nuclear integration of mtDNA fragments is an ongoing process (Thomas et al. 1996; Mourier et al. 2001; Ricchetti et al. 2004). However, the tempo and rate of insertion appears to vary between studies. While several studies have argued for a constant rate of numt insertion (Mourier et al. 2001; Bensasson et al. 2003; Hazkani-Covo et al. 2003), others instead suggest that the rate of numt insertion has not been constant, at least during the diversification process of great apes (Gherman et al. 2007; Hazkani-Covo 2009). A critical step in gauging rates of insertion is the reliable inference of numt age. However, past use of phylogenetic methods to date numts and estimate insertion rates in great apes can be misleading since numts are small (<500 bp) and usually contain insufficient phylogenetic information to accurately place their time of insertion (Jensen-Seaman et al. 2009). Furthermore, estimating the time of insertion of numt loci is problematic when both mitochondrial and nuclear loci are combined into the same phylogeny due to striking differences in patterns and rates of nucleotide substitution between the nuclear and mitochondrial genomes (Graur and Li 2000; Schmitz et al. 2002, 2005). Alternatively, the approximate time of insertion of candidate loci in a reference phylogeny can be estimated by either conducting comparative BLAT surveys of taxa which have whole genomic sequences available or via cross-species PCR amplification of candidate loci from taxa that presently lack a comprehensive genomic database (Zischler et al. 1998; Kent et al. 2002; Hazkani-Covo 2009; Jensen-Seaman et al. 2009).
Given our present lack of understanding of the molecular evolutionary dynamics of great ape MCR numts and the importance of these genetic elements in mitochondrial genetic studies, we set out to first conduct a rigorous inventory of numts from the four MCR sub-domains identified in the three most comprehensive reference genomic databases of great apes, i.e., human, chimpanzee, and orangutan. These data were then used to test the hypothesis that the prevalence of numts from each subdomain is negatively related to the proportion of variable sites (PVS) and positively related to DNA complexity. The presence of the MCR numt loci obtained from this study was then determined in other great ape taxa (gorilla and gibbon) to estimate their approximate time of insertion and test the hypothesis that the rate of numt insertion has been constant through the evolution of great apes (Hominoidea). These data were also used to determine whether more variable sub-domains are proportionally under-represented in more ancient numts. We also compared the PVS in 15 mitochondrial genes in humans (Ingman and Gyllensten 2006) to the prevalence of their nuclear pseudogenes (Triant and deWoody 2007) to assess whether variability in mitochondrial coding regions is also negatively related to numt prevalence. This research will ultimately contribute to a better understanding of the factors determining the apparent abundance and distribution of mitochondrial fragments in the nuclear genome of great apes and may have important implications for population genetic analyses of mtDNA where detection and elimination of numt contaminants is an issue.
Materials and Methods
Relative Abundance of MCR Numts in the Genome of Humans, Chimpanzees, and Orangutans
The BLASTn algorithm (Altschul et al. 1990) was used to carry out an exhaustive search for MCR numts in reference genome databases from human (build 36.3), chimpanzee (build 2.1), and orangutan (P_pygmaeus2.0.2) assemblies. Complete versions of the two other reference genomic databases of Hominoidea (gorilla and gibbon) were not available at the time BLAST searches were conducted. The MCR query sequence was taken from reference mitochondrial genomes of the corresponding species (NC001807.4 for human, NC001643.1 for chimpanzee, and D38115.1 for orangutan). Each contain four MCR sub-domains: the two hyper-variable regions (HV1 and HV2), the CCD, and the sub-domain proximal to the phenylalanine tRNA gene (MCRF). The query sequences also contained the two 500 bp flanking regions, defined here as MTP and MTF, where the former comprises the genes for tRNA of proline (MT-TP) and threonine (MT-TT) and 32 % of the cyto-chrome b gene (MT-CYB), whereas the latter comprises the genes for phenylalanine tRNA (MT-TF) and 45 % of the 12S rRNA gene (MT-RNR1). A fragment of 81 bp was found to be missing from the HV1 region of the mitochondrial reference sequence for the orangutan and was replaced by another HV1 sequence reported in the same species (AJ586559.1). The filters and mask options of BLAST searches were clicked off; search parameters were relaxed to a word size of 7; match/mismatch scores of 1/−1 were adopted and gap creation and extension penalties of 3 and 1 were applied, respectively. Only hits of either (i) at least 100 bp in length and 60 % identity or (ii) a size of between 50 and 99 bp with identity greater than 70 % were considered. As preliminary analyses indicated that expect-values for discontiguous numt hits did not exceed 0.39, this value was used as an upper limit above which hits were rejected.
Abundance of Numts Across the Different MCR Sub-domains
The mitochondrial sequences of the five major taxa in the Hominoidea, i.e., human, chimpanzee, orangutan (D38115.1-AJ586559.1), gibbon (X99256.1), and gorilla (NC001643.1) were aligned using ClustalW (Larkin et al. 2007) implemented in MEGA v4 (Tamura et al. 2007). Two fragments of 96 and 20 bp in the HV2 and MCRF, respectively, appear to have been historically deleted from the mitochondrial genome of orangutans but are present in both humans and chimpanzees. The PVS in the five major taxa of great apes, consisting of both indels and segregating sites, was then calculated for the four MCR sub-domains and the two flanking regions using the program DnaSP v5 (Librado and Rozas 2009). The average number of numts per nucleotide position (numts/site) was estimated for each region. Pearson’s r correlation analysis was used to compare the relationship between PVS and numts/site to test the effect of sequence variation on the number of detected numts.
Additionally, an index of DNA complexity was calculated by dividing the size in base pairs of each region by the number of base pairs considered to be part of nucleotide repeat blocks. Such blocks were determined by the program MSATFINDER v2.0 (Thurston and Field 2005) and defined as stretches of at least five tandem repeats of mononucleotides or at least three tandem repeats of longer motifs (2–6 nucleotides). Numt abundance was calculated as the number of numts partially or entirely derived from a particular region weighted by the size of the region. The relationship between DNA complexity and numt abundance was also assessed through regression analysis to test the hypothesis that potential mutational hotspots in repetitive blocks (low complexity) impact our ability to detect numts from sub-domains with low DNA complexity.
Observed Rate of Insertion of MCR Numts in the Hominoidea
The presence of human and chimpanzee numts retrieved from the BLAST searches in other hominoids and an outgroup macaque (rheMac2, Jan 2006) was determined by genomic BLAT surveys of reference genomic databases (i.e., human, chimpanzee, orangutan, and macaque) (Kent et al. 2002) and BLAST searches of partial genomic databases of the white-cheeked crested gibbon (Nomascus leucogenys, ADFV00000000; September 2010) and the western lowland gorilla (Gorilla gorilla gorilla, CABD00000000, November 2009). This approach allowed us to identify hominoid-specific numts and detect their orthologs in other taxa. In cases where genomic sequences from gorilla and gibbon were not available or orthology was ambiguous, the presence/absence of a given MCR numt was determined by cross-species PCR amplification of genomic DNA from western lowland gorilla or white-handed gibbon (Hylobates lar) using primers specific to both numt flanks (Supplementary Table 1).
The period of insertion of each numt was then deduced by mapping the first appearance of a given numt to the relevant inter-nodal position in the reference phylogeny of the Hominoidea (Goodman et al. 1998). This phylogeny is considered to be a robust estimate of phylogenetic relationships within this group and is based on sequence data from the β-globin gene cluster and fossil evidence. According to this phylogeny, the Cercopithecoidea (Old World monkeys including macaque) diverged from Hominoidea around 25 million years (Ma) ago. The lineage leading to the gibbon then diverged 18 Ma ago, followed by the divergence of Pongo (orangutan) 14 Ma ago, Gorilla 7 Ma ago, and then the separation of the two terminal taxa Homo (human) and Pan (chimpanzee and bonobo) around 6 Ma ago.
The observed rate of insertion of MCR numt loci was estimated as the number of detected insertions that first appeared in a given inter-nodal region divided by the period of time between successive nodes. We did not attempt to conduct a rigorous distinction between independent mitochondrial translocations and post-integration duplications owing to the difficulty of unambiguously differentiating between these two events. However, several duplication events could be confirmed in cases where multiple numts exhibited the same boundaries and high identity along their flanking regions (e.g., See panY8000 series in Supplementary Table 2).
Variability in Mitochondrial Genes and the Apparent Prevalence of Their Nuclear Copies
We tested the correlation between PVS of 15 human mitochondrial genes with the number of numts derived from the same genes in the human genome. In order to do this, we made use of 100 mitochondrial genomes from human populations around the world available through the Human Mitochondrial Genome Database (Ingman and Gyllensten 2006; see Supplementary Table 3) and an inventory of human numts found through BLAST searches for the 13 protein-coding and the two rRNA mitochondrial genes in humans, as reported by Triant and deWoody (2007). The PVS and the proportion of the average number of numts per nucleotide position (numts/site) were calculated for all 15 mitochondrial genes. The relationship between PVS and numts/site was assessed using a Pearson correlation test.
Results
MCR Numt Prevalence by Sub-domain
BLAST searches recovered a total of 122 chimpanzee, 100 orangutan, and 97 human putative MCR numts. Despite the overall excess of MCR numts in chimpanzee, the relative proportion of numts by MCR sub-domain was similar in all three great ape taxa (Fig. 1). There was also a pronounced deficit in numts originating from the HV2 and MCRF relative to the other sub-domains and a slight deficit was also noticed in numts from HV1. The PVS showed a bimodal distribution with maxima in HV1 and HV2/MCRF (Fig. 1). Unlike other sub-domains where PVS was mainly determined by the number of segregating sites, the elevated sequence variation in HV1 and HV2/MCRF was explained by both segregating sites and indel events.
Fig. 1.

Absolute number of numts per site in the four MCR sub-domains (HV1, CCD, HV2, and MCRF) and 500 bp flanking regions (MTP and MTF) of human, chimpanzee, and orangutan. The histogram below illustrates the PVS made up by nucleotide substitutions (dark gray) and indels (light gray) within sequence windows of 100 bp along the same six regions
Sequence Variability and the Number of Traceable Numts
There was a strong negative correlation between the PVS and the average number of numts/site when the three target genomes were analyzed together (Pearson = −0.82; d.f. = 16; p < 0.001; R2 = 0.67) (Fig. 2). This relationship was highly significant for orangutans (Pearson = −0.93; d.f. = 4; p = 0.007; R2 = 0.87) and marginally significant for chimpanzees (Pearson = −0.81; d.f. = 4; p = 0.053; R2 = 0.65) and humans (Pearson = −0.80; d.f. = 4; p = 0.057; R2 = 0.64). There was also a positive relationship between DNA complexity and numt abundance when the three genomes were pooled together (Pearson = 0.64; CI 99 % [0.096, 0.890]; d.f. = 16; p = 0.004; R2 = 0.41) (Fig. 3). For individual species, this relationship was significant for chimpanzees (Pearson = 0.87; d.f. = 4; p = 0.025; R2 = 0.75) and marginally significant for humans (Pearson = 0.78; d.f. = 4; p = 0.065; R2 = 0.62).
Fig. 2.

Relationship between PVS in the four MCR sub-domains and the two flanking regions in the Hominoidea and the average number of numts per nucleotide position (numts/site) in the human, chimpanzee, and orangutan genomes. The regression equation is y = −53.242x + 58.316. Individual regression lines are y = −51.2x + 54.497, y = −55.019x + 64.262, and y = −53.776x + 56.182 for humans, chimpanzees, and orangutans, respectively. Numbers located next to the symbols represent the regions MTP (1), HV1 (2), CCD (3), HV2 (4), MCRF (5), and MTF (6)
Fig. 3.
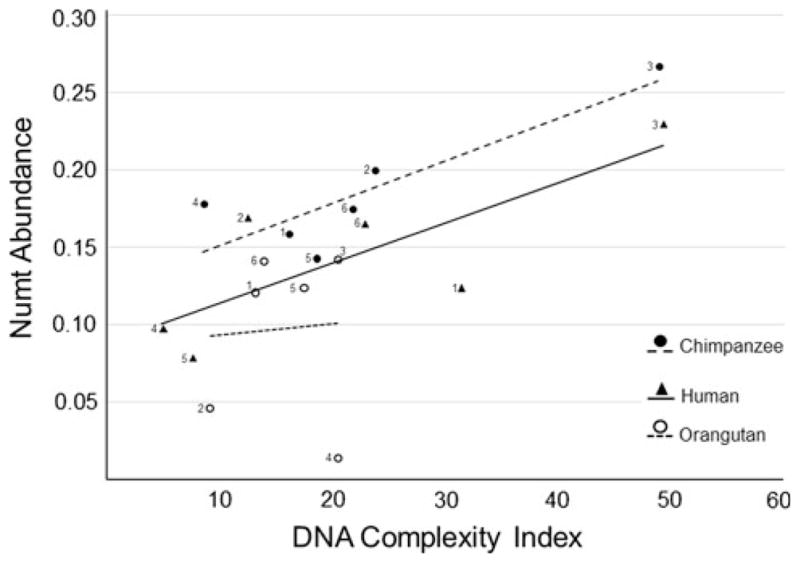
Relationship between DNA complexity and numt abundance in humans, chimpanzees, and orangutans. The regression equation is y = 0.0032x + 0.0789. Individual regression equations in chimpanzees and humans are y = 0.0028x + 0.123 and y = 0.0026x + 0.089, respectively. Numbers located next to the symbols represent MTP (1), HV1 (2), CCD (3), HV2 (4), MCRF (5), and MTF (6)
Variable Rate of Insertion of MCR and Coding Region Numts
Genomic database surveys and cross-species PCR assays succeeded in placing the origin of 62 MCR numts in the hominoid phylogeny along with 22 additional numts derived from the two flanking regions MTP (12) and MTF (10) (Fig. 4). MCR translocations include eight that originated prior to the divergence of orangutans, 25 specific to chimpanzees, 20 specific to orangutan, and two specific to humans (see Supplementary Tables 1 and 2 for detailed information). The presence/absence status of five additional candidate numts could not be unambiguously determined in macaque due to gaps in the reference genome database or chromosomal deletions containing the target region. From these data, we estimated an average observed rate of insertion of 1.38 MCR numts/Ma in the hominoid genome, although this is likely to be slightly biased as numts specific to gibbon and gorilla were missed. Different rates were found among taxa, with a much higher overall rate in chimpanzee (4.17 numts/Ma) that contrasts with those in human (0.33 numt/Ma; the sister taxon) and orangutan (1.43/Ma).
Fig. 4.

Phylogeny of the Hominoidea and macaque from Goodman et al. (1998) showing the number of MCR numts inserted during particular inter-nodal time periods, the observed insertion rate (numts/Ma), and the average sequence identity (%) between a given numt group and the corresponding mitochondrial region. The panY8000-numt cluster was excluded from calculations of identity in chimpanzee since they are known to be duplications of an ancient numt
The slight deficit in numts from HV1 relative to other sub-domains was only observed in numts predating the common ancestor of the Hominoidea, meaning that the overall numt deficit in this sub-domain is mostly determined by older numts. However, an ample deficit of numts from HV2 and MCRF is observed regardless of insertion time. In general, sequence identity between mitochondrial sequences and their numt copies steadily decreased with numt age from nearly 90 % in numts inserted in the lineage leading to human and chimpanzee to 75 % in numts originating prior to the diversification of hominoids, although this trend did not hold true for humans, where the two species-specific numts exhibited an identity of only 78 % (Fig. 5).
Fig. 5.

Hominoidea-specific numts derived from the region containing the MCR (HV1, CCD, HV2, and MCRF) and 500 bp on the flanking regions (MTP and MTF). They are organized in four groups depending on whether they are shared by multiple taxa (Hominoidea) or taxon-specific (human, chimpanzee, or orangutan). Relative size and region of mitochondrial origin are depicted by gray boxes. Dashed boxes represent regions absent from the orangutan mitochondrial genome. See Supplementary Table 2 for insertion time and specific chromosomal location of each numt
Although we did not intend to make a rigorous distinction between direct integrations of mitochondrial fragments and duplications of previous integrations, we found multiple cases of recent MCR numt duplications nested in larger duplications of chromosomal fragments, interestingly all located in the Y chromosome. These comprise the two human-specific MCR numts (hY_77 1 and 2), which exhibit identical size, sequence, and high identity with one another along both flanks. Likewise, 15 of the 26 chimpanzee-specific numts were nested in chromosomal duplications in the Y chromosome (panY8000). They share identities of over 88 % with one another and are derived from an ancient mitochondrial integration of ~8,000 bp that inserted over 25 Ma ago in the Hominoidea ancestor. Altogether, panY8000 numts accounts for over 1.2 × 10⁵ bp of mitochondrial sequences in the chimpanzee nuclear genome.
Analysis of the 15 mitochondrial genes in humans revealed that the average number of numts derived from each nucleotide site decreased with the PVS in each gene (Fig. 6). This results in a negative relationship between PVS and numts/site (Pearson = −0.61; d.f. = 13; p = 0.016; R2 = 0.37). For instance, the gene 16S has the smallest PVS (0.030) and one of the greatest proportions of numts per site (23.6), whereas the gene ATP8 has a relatively high PVS value of 0.09 and a proportion of numts/site of only 6.64.
Fig. 6.
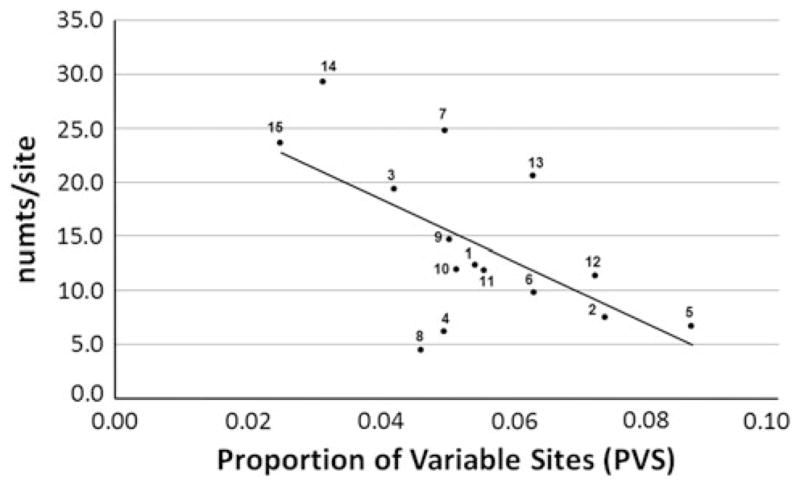
Relationship between the PVS in 15 human mitochondrial genes and the average proportion of numts per site (numts/site) for each given gene. The regression equation is y = −286.28x + 29.85. Numbers in the figure represent each of the 15 mitochondrial genes: 1 NDI, 2 NDII, 3 COI, 4 COII, 5 ATP8, 6 ATP6, 7 COIII, 8 ND3, 9 ND4L, 10 ND4, 11 ND5, 12 ND6, 13 CytB, 14 12S, 15 16S
Discussion
The resulting list of MCR numts from our BLAST search recovered 40 human and 34 chimpanzee numts previously reported for these taxa (Mourier et al. 2001; Hazkani-Covo and Graur 2007; Lascaro et al. 2008; Ricchetti et al. 2004; Zischler et al. 1998; MITOMAP 2008), along with a large number of loci reported here for the first time, including seven in human and 23 in chimpanzee. Our study also identified 27 numt loci exclusive to the orangutan genome and provides the first comprehensive report of MCR numts in this taxon.
Overall, our results show that our search strategy recovered not only all previously described MCR numts but also proved effective in uncovering additional numts with relatively small size and low sequence identity. In general, human MCR numts found here and previously reported in other studies share on average 87–88 % of sequence identity with their current mitochondrial genomes (Table 1). However, numts identified in previous studies (Mourier et al. 2001; Hazkani-Covo and Graur 2007; Lascaro et al. 2008) tend to be larger and less divergent than those loci reported herein for the first time. Although relaxing the search parameters in a BLAST survey is expected to increase the number of spurious associations, it can uncover additional numts whose authenticity can be established by the presence/absence comparisons in other taxa. Such an approach to numt detection could also prove useful in identification of additional numts in other species.
Table 1.
Number, average size, and nuclear/mitochondrial identity of human numts derived from MCR and 500 bp flanking regions that have been reported in previous searches or are newly reported in the present study
| Previous studies | Number | Average numt size (bp) | % Identity |
|---|---|---|---|
| a, b, c | 9 | 2954.8 | 88.4 |
| a, b or b, c | 8 | 200.9 | 88.0 |
| b | 4 | 140.8 | 87.0 |
| Newly reported | 7 | 120.6 | 73.0 |
Previous studies cited: a Mourier et al. (2001), b Hazkani-Covo and Graur 2007, c Lascaro et al. 2008
The strong negative relationship between PVS in the region containing the MCR and the number of numts/site supports the hypothesis that elevated mutational rate from both nucleotide substitutions and indel events in the mtDNA erodes sequence identity and leads to an apparent deficit in the amount of mitochondrial sequences located in the nuclear genome. All three target taxa exhibit a deficit in the number of numts derived from HV2 and MCRF, both of which are known for having an elevated number of variable sites and different lengths in mammals (Saccone et al. 1991). The positive relationship between MCR sequence complexity and numt abundance in humans and chimpanzees also indicates that the loss of sequence identity and our ability to detect numts can be partially explained by elevated mutation rates in low complexity regions of the mitochondrial genome (Bodenteich et al. 1992; Sbisà et al. 1997; Zardoya and Meyer 1998). In other words, numts are less likely to be detected if they contain regions of the mitochondrial genome of higher substitution rate, length variation, and repetitive sequence content. This might also explain the apparent deficit of numts from the MCR relative to other parts of the mitochondrial genome (Mourier et al. 2001). The comparison between PVS in mitochondrial coding sequences and numt abundance in humans supports this conclusion and suggests that mitochondrial genes with relatively conserved sequences are probably under stronger stabilizing selection and may thus maintain a greater identity with nuclear copies.
Several pieces of evidence point to the possibility that previous analyses based on humans have underestimated the rate of insertion in other great apes. First, humans are known to have reduced genetic diversity relative to other apes due to a past population bottleneck which might have led to a numt deficit relative to other apes (Zhao et al. 2000; Kaessmann et al. 2001; Mathews et al. 2003). Second, BLAST surveys of genomic databases based on a single individual are likely to underestimate the frequency of recent integrations that have not yet become fixed in the species (Schmitz et al. 2005). Third, recent deletions in mitochondrial genomes used as query sequences, such as the case of two fragments lost from the mtDNA of orangutans, may also result in limited detection of numts within these regions. Finally, although our search identified previously unreported numts in the hominoid genome, either partially or entirely derived from the MCR, our estimated rate is still likely to be a conservative estimate due to the exclusion of numt hits shorter than 50 bp and extremely divergent numts. Taken together, findings from this study provide strong evidence that MCR numts may be generally underestimated in most surveys of existing genomic databases of great apes. In order to tackle this problem, we recommend incorporating as many individual genomes as become available in future genomic surveys, combined with previous suggestions such as relaxing parameters in BLAST searches and the use of alternative query sequences. Future search strategies should also experiment with using query sequences either derived from consensus sequences of multiple taxa or from an inferred ancestral mitochondrial sequence of Hominoidea to determine whether more divergent nuclear translocations and/or query sequences derived from regions no longer present in the mitochondrial genome can be detected.
Findings from the present study also provide evidence of substantial variation in the rate of insertion of MCR numts among different taxa and lineages. Such differences are unlikely to result from a systematic bias in the BLAST methods used here since these were the same in all three taxa. Rate heterogeneity among lineages cannot be attributed to a bias introduced by gaps in genome projects since the slowest rate of insertion was found in the human genome whose sequencing database is the most comprehensive. The remarkable contrast in insertion rates between humans and chimpanzees is also in agreement with previous reports (Hazkani-Covo and Graur 2007; Hazkani-Covo 2009). One potential explanation for the excess of numts in chimpanzees is from the greater permeability of this genome to accept new integrations, as shown by the great extent of segmental duplications and high rate of structural mutation in this taxon (Ventura et al. 2011). Demographic factors might also have played a role since human populations are known to have experienced an ancient bottleneck that led to historically low levels of genetic variation (Zhao et al. 2000; Kaessmann et al. 2001; Mathews et al. 2003; Gherman et al. 2007; McEvoy et al. 2011). Finally, differences in mechanisms of mitochondrial integration or genome reorganization might also explain the apparent differences in numt prevalence across species but further evidence for the role of these different factors needs to be gathered.
Our results, also show that the relative abundance of numts from different MCR sub-domains is similar across all three hominoids studied here, which is consistent with a long history of mitochondrial migration into the nucleus prior to the divergence of the Hominoidea (i.e., >25 Ma ago), including a period of intensive colonization 40–60 Ma ago (Bensasson et al. 2003; Hazkani-Covo et al. 2003; Gherman et al. 2007). However, numts from HV1, but not from HV2/MCRF, that originated before the hominoid diversification were found to be under-represented. This contrasts with more recent HV1 numts, despite the relatively rapid divergence of this mitochondrial region, underlining the risk of their co-amplification and inadvertent incorporation into mitochondrial studies in primates.
Taxon-specific MCR numts from HV1 and CCD generally exhibit a high level of similarity to their mitochondrial counterparts. Overall, the high resemblance between mitochondrial sequences and their nuclear copies may be potentially problematic in population genetic studies and lead to misidentification of recent numts as mitochondrial sequences (Jensen-Seaman et al. 2004). In these cases, inventories of species-specific numts characterized through either BLAST surveys of existing genomic databases or cross-species PCR assays will help identify instances of numt contamination and ensure that mitochondrial sequence databases are error-free.
Our findings also revealed a recent accumulation of numt duplications in the Y chromosome of humans and chimpanzees nested within duplications of larger chromosomal segments. The concentration of numt duplications on the Y chromosome is surprising given its small size and is consistent with previous reports of an excess of human-specific numts in the Y chromosome (Ricchetti et al. 2004). The apparent accumulation of numt duplications in the Y chromosome is likely to be a product of extensive chromosomal duplications, as evidenced by the widespread distribution of transposable elements and other DNA duplications on this chromosome that together suggest a highly dynamic process of evolution (Kuroki et al. 2006; Bowden 2010; Hughes et al. 2010). It is also important to note that the high rate of duplication and other chromosomal rearrangements in the Y chromosome of great apes could be caused by additional factors such as the greater number of cell divisions in the male germ line (Erlandsson et al. 2000), reduced selective pressure in the Y chromosome, and lack of meiotic recombination in the vast majority of this chromosome (Charlesworth 1991; Foote et al. 1992; Tilford et al. 2001). Future sequencing of multiple conspecific genomes and completion of other ongoing genome projects may shed light on whether the observed concentration of recent numts in the Y chromosome is common in other primates or varies between populations and subspecies. If that is the case, then duplications of chromosomal fragments may prove useful as cytogenetic markers in future population genetic studies.
Supplementary Material
Acknowledgments
We are grateful to Dr. Dale Hedges (University of Miami) for advice on BLAST searches. We also would like to thank Drs. Mary Clancy, Charles Bell, Steve Johnson (University of New Orleans), Dr. Prescott Deininger (Tulane University), and two anonymous reviewers for comments on earlier versions of this manuscript. This study was supported by the National Institutes of Health award to NMA and MIJS (Grant No. R15 GM073682-01).
Footnotes
Electronic supplementary material The online version of this article (doi:10.1007/s00239-012-9519-y) contains supplementary material, which is available to authorized users.
Contributor Information
I. D. Soto-Calderón, Email: ivandariosoto@hotmail.com, Department of Biological Sciences, University of New Orleans, 2000 Lakeshore Drive, New Orleans, LA 70148, USA. Laboratorio de Genética Molecular (GENMOL), University of Antioquia, AA. 1226, Medellín, Colombia
E. J. Lee, Email: ejlee2@uno.edu, Department of Biological Sciences, University of New Orleans, 2000 Lakeshore Drive, New Orleans, LA 70148, USA
M. I. Jensen-Seaman, Email: seamanm@duq.edu, Department of Biological Sciences, Duquesne University, 600 Forbes Ave., Pittsburgh, PA 15282, USA
N. M. Anthony, Email: nanthony@uno.edu, Department of Biological Sciences, University of New Orleans, 2000 Lakeshore Drive, New Orleans, LA 70148, USA
References
- Altschul SF, Gish W, Miller W, Myers EW, Lipman DJ. Basic local alignment search tool. J Mol Biol. 1990;215:403–410. doi: 10.1016/S0022-2836(05)80360-2. [DOI] [PubMed] [Google Scholar]
- Anthony NM, Clifford SL, Bawe-Johnson M, Abernethy KA, Bruford MW, Wickings EJ. Distinguishing gorilla mitochondrial sequences from nuclear integrations and PCR recombinants: guidelines for their diagnosis in complex sequence databases. Mol Phylogenet Evol. 2007;43:553–566. doi: 10.1016/j.ympev.2006.09.013. [DOI] [PubMed] [Google Scholar]
- Arora N, Nater A, van Schaik CP, Willems EP, van Noordwijk MA, Goossens B, Morf N, Bastian M, Knott C, Morrogh-Bernard H, Kuze N, Kanamori T, Pamungkas J, Perwitasari-Farajallah D, Verschoor E, Warren K, Krützen M. Effects of pleistocene glaciations and rivers on the population structure of Bornean orangutans (Pongo pygmaeus) Proc Natl Acad Sci USA. 2010;107:21376–21381. doi: 10.1073/pnas.1010169107. [DOI] [PMC free article] [PubMed] [Google Scholar]
- Bensasson D, Zhang D, Hartl DL, Hewitt GM. Mitochondrial pseudogenes: evolution’s misplaced witnesses. TREE. 2001;16:314–321. doi: 10.1016/s0169-5347(01)02151-6. [DOI] [PubMed] [Google Scholar]
- Bensasson D, Feldman MW, Petrov DA. Rates of DNA duplication and mitochondrial DNA insertion in the human genome. J Mol Evol. 2003;57:343–354. doi: 10.1007/s00239-003-2485-7. [DOI] [PubMed] [Google Scholar]
- Bodenteich A, Mitchell LG, Polymeropoulos MH, Merril CR. Dinucleotide repeat in the human mitochondrial D-loop. Hum Mol Genet. 1992;1:140. doi: 10.1093/hmg/1.2.140-a. [DOI] [PubMed] [Google Scholar]
- Bowden GR. PhD thesis. University of Leicester; 2010. Gene conversion on the human Y chromosome. https://lra.le.ac.uk/handle/2381/9310. [Google Scholar]
- Brown WM, Prager EM, Wang A, Wilson AC. Mitochondrial DNA sequences of primates: tempo and mode of evolution. J Mol Evol. 1982;18:225–239. doi: 10.1007/BF01734101. [DOI] [PubMed] [Google Scholar]
- Charlesworth B. The evolution of sex chromosomes. Science. 1991;251:1030–1033. doi: 10.1126/science.1998119. [DOI] [PubMed] [Google Scholar]
- Corral M, Baffet G, Kitzis A, Paris B, Tichonicky L, Kruh J, Guguen-Guillouzo C, Defer N. DNA-sequences homologous to mitochondrial genes in nuclei from normal rat tissues and from rat hepatoma-cells. Biochem Biophys Res Commun. 1989;162:258–264. doi: 10.1016/0006-291x(89)91990-6. [DOI] [PubMed] [Google Scholar]
- Du Buy HG, Riley FL. Hybridization between the nuclear and kinetoplast DNA’s of Leishmania enriettii and between nuclear and mitochondrial DNA’s of mouse liver. Proc Natl Acad Sci USA. 1967;57:790–797. doi: 10.1073/pnas.57.3.790. [DOI] [PMC free article] [PubMed] [Google Scholar]
- Erlandsson R, Wilson JF, Pääbo S. Sex chromosomal transposable element accumulation and male-driven substitutional evolution in humans. Mol Biol Evol. 2000;17:804–812. doi: 10.1093/oxfordjournals.molbev.a026359. [DOI] [PubMed] [Google Scholar]
- Foote S, Vollrath D, Hilton A, Page DC. The human Y chromosome: overlapping DNA clones spanning the euchromatic region. Science. 1992;258:60–66. doi: 10.1126/science.1359640. [DOI] [PubMed] [Google Scholar]
- Gherman A, Chen PE, Teslovich TM, Stankiewicz P, Withers M, Kashuk CS, Chakravarti A, Lupski JR, Cutler DJ, Katsanis N. Population bottlenecks as a potential major shaping force of human genome architecture. PLoS. 2007;3(7):e119. doi: 10.1371/journal.pgen.0030119. [DOI] [PMC free article] [PubMed] [Google Scholar]
- Goodman M, Porter CA, Czelusniak J, Page SL, Schneider H, Shoshani J, et al. Toward a phylogenetic classification of primates based on DNA evidence complemented by fossil evidence. Mol Phylogenet Evol. 1998;9:585–598. doi: 10.1006/mpev.1998.0495. [DOI] [PubMed] [Google Scholar]
- Graur D, Li WH. Fundamentals of Molecular Evolution. 2. Sinauer Associates, Inc; Sunderland, MA, USA: 2000. [Google Scholar]
- Greenwood AD, Pääbo S. Nuclear insertion sequences of mitochondrial DNA predominate in hair but not in blood of elephants. Mol Ecol. 1999;8:133–137. doi: 10.1046/j.1365-294x.1999.00507.x. [DOI] [PubMed] [Google Scholar]
- Haag-Liautard C, Coffey N, Houle D, Lynch M, Charlesworth B, Keightley PD. Direct estimation of the mitochondrial DNA mutation rate in Drosophila melanogaster. PLoS Biol. 2008;6:e204. doi: 10.1371/journal.pbio.0060204. [DOI] [PMC free article] [PubMed] [Google Scholar]
- Hazkani-Covo E. Mitochondrial insertions into primate nuclear genomes suggest the use of numts as a tool for phylogeny. Mol Biol Evol. 2009;26:2175–2179. doi: 10.1093/molbev/msp131. [DOI] [PubMed] [Google Scholar]
- Hazkani-Covo E, Graur D. A comparative analysis of numt evolution in human and chimpanzee. Mol Biol Evol. 2007;24:13–18. doi: 10.1093/molbev/msl149. [DOI] [PubMed] [Google Scholar]
- Hazkani-Covo E, Sorek R, Graur D. Evolutionary dynamics of large numts in the human genome: rarity of independent insertions and abundance of post-insertion duplications. J Mol Evol. 2003;56:169–174. doi: 10.1007/s00239-002-2390-5. [DOI] [PubMed] [Google Scholar]
- Hazkani-Covo E, Zeller RM, Martin W. Molecular poltergeists: mitochondrial DNA copies (numts) in sequenced nuclear genomes. PLoS Genet. 2010;6:e1000834. doi: 10.1371/journal.pgen.1000834. [DOI] [PMC free article] [PubMed] [Google Scholar]
- Henze K, Martin W. How do mitochondrial genes get into the nucleus? Trends Genet. 2001;17:383–387. doi: 10.1016/s0168-9525(01)02312-5. [DOI] [PubMed] [Google Scholar]
- Hughes JF, Skaletsky H, Pyntikova T, Graves TA, van Daalen SKM, Minx PJ, Fulton RS, McGrath SD, Locke DP, Friedman C, Trask BJ, Mardis ER, Warren WC, Repping S, Rozen S, Wilson RK, Page DC. Chimpanzee and human Y chromosomes are remarkably divergent in structure and gene content. Nature. 2010;463:536–539. doi: 10.1038/nature08700. [DOI] [PMC free article] [PubMed] [Google Scholar]
- Ingman M, Gyllensten U. MtDB: human mitochondrial genome database, a resource for population genetics and medical sciences. Nucleic Acid Res. 2006;34:D749–D751. doi: 10.1093/nar/gkj010. [DOI] [PMC free article] [PubMed] [Google Scholar]
- Jensen-Seaman MI, Kidd KK. Mitochondrial DNA variation and biogeography of eastern gorillas. Mol Ecol. 2001;10:2241–2247. doi: 10.1046/j.0962-1083.2001.01365.x. [DOI] [PubMed] [Google Scholar]
- Jensen-Seaman MJ, Sarmiento EE, Deinard AS, Kidd KK. Nuclear integrations of mitochondrial DNA in gorillas. Am J Primatol. 2004;63:139–147. doi: 10.1002/ajp.20047. [DOI] [PubMed] [Google Scholar]
- Jensen-Seaman MI, Wildschutte JH, Soto-Calderón ID, Anthony NM. A comparative approach reveals differences in patterns of numt insertion during hominoid evolution. J Mol Evol. 2009;68:688–699. doi: 10.1007/s00239-009-9243-4. [DOI] [PMC free article] [PubMed] [Google Scholar]
- Kaessmann H, Wiebe V, Weiss G, Pääbo S. Great ape DNA sequences reveal a reduced diversity and an expansion in humans. Nature. 2001;27:155–156. doi: 10.1038/84773. [DOI] [PubMed] [Google Scholar]
- Kent WJ, Sugnet CW, Furey TS, Roskin KM, Pringle TH, Zahler AM, Haussler D. The human genome browser at UCSC. Genome Res. 2002;12:996–1006. doi: 10.1101/gr.229102. [DOI] [PMC free article] [PubMed] [Google Scholar]
- Kuroki Y, Toyoda A, Noguchi H, Taylor TD, Itoh T, Kim DS, Kim DW, Choi SH, Kim Il-C, Choi HH, Kim YS, Satta Y, Saitou N, Yamada T, Morishita S, Hattori M, Sakaki Y, Park HS, Fujiyama A. Comparative analysis of chimpanzee and human Y chromosomes unveils complex evolutionary pathway. Nature Genet. 2006;38:158–167. doi: 10.1038/ng1729. [DOI] [PubMed] [Google Scholar]
- Larkin MA, Blackshields G, Brown NP, Chenna R, McGettigan PA, McWilliam H, Valentin F, Wallace IM, Wilm A, Lopez R, Thompson JD, Gibson TJ, Higgins DG. ClustalW and ClustalX version 2. Bioinformatics. 2007;23:2947–2948. doi: 10.1093/bioinformatics/btm404. [DOI] [PubMed] [Google Scholar]
- Lascaro D, Castellana S, Gasparre G, Romeo G, Saccone C, Attimonelli M. The RHNumtS compilation: features and bioinformatics approaches to locate and quantify human NumtS. BMC Genomics. 2008;9:267. doi: 10.1186/1471-2164-9-267. [DOI] [PMC free article] [PubMed] [Google Scholar]
- Librado P, Rozas J. DnaSP v5: a software for comprehensive analysis of DNA polymorphism data. Bioinformatics. 2009;25:1451–1452. doi: 10.1093/bioinformatics/btp187. [DOI] [PubMed] [Google Scholar]
- Lopez JV, Yuhki N, Masuda R, Modi W, O’Brien SJ. Numt, a recent transfer and tandem amplification of mitochondrial DNA to the nuclear genome of the domestic cat. J Mol Evol. 1994;39:174–190. doi: 10.1007/BF00163806. [DOI] [PubMed] [Google Scholar]
- Lopez JV, Culver M, Stephens JC, Johnson WE, O’brien SJ. Rates of nuclear and cytoplasmic mitochondrial DNA sequence divergence in mammals. Mol Biol Evol. 1997;14:277–286. doi: 10.1093/oxfordjournals.molbev.a025763. [DOI] [PubMed] [Google Scholar]
- McEvoy BP, Powell JE, Goddard ME, Visscher PM. Human population dispersal “Out of Africa” estimated from linkage disequilibrium and allele frequencies of SNPs. Genome Res. 2011;21:821–829. doi: 10.1101/gr.119636.110. [DOI] [PMC free article] [PubMed] [Google Scholar]
- Mathews LM, Chi SY, Greenberg N, Ovchinnikov I, Swergold GD. Large differences between LINE-1 amplification rates in the human and chimpanzee lineages. Am J Hum Genet. 2003;72:739–748. doi: 10.1086/368275. [DOI] [PMC free article] [PubMed] [Google Scholar]
- MITOMAP. [Accessed October 2008];A human mitochondrial genome database. 2008 http://www.mitomap.org.
- Mourier T, Hansen AJ, Willerslev E, Arctander P. The human genome project reveals a continuous transfer of large mitochondrial fragments to the nucleus. Mol Biol Evol. 2001;18:1833–1837. doi: 10.1093/oxfordjournals.molbev.a003971. [DOI] [PubMed] [Google Scholar]
- Nugent JM, Palmer JD. RNA-mediated transfer of the gene coxII from the mitochondrion to the nucleus during flowering plant evolution. Cell. 1991;66:473–481. doi: 10.1016/0092-8674(81)90011-8. [DOI] [PubMed] [Google Scholar]
- Perna NT, Kocher TD. Mitochondrial DNA: molecular fossils in the nucleus. Curr Biol. 1996;6:128–129. doi: 10.1016/s0960-9822(02)00441-4. [DOI] [PubMed] [Google Scholar]
- Pesole G, Gissi C, De Chirico A, Saccone C. Nucleotide substitution rate of mammalian mitochondrial genomes. J Mol Evol. 1999;48:427–434. doi: 10.1007/pl00006487. [DOI] [PubMed] [Google Scholar]
- Ricchetti M, Tekaia F, Dujon B. Continued colonization of the human genome by mitochondrial DNA. PLoS Biol. 2004;2:1313–1324. doi: 10.1371/journal.pbio.0020273. [DOI] [PMC free article] [PubMed] [Google Scholar]
- Saccone C, Pesole G, Sbisà The main regulatory region of mammalian mitochondrial DNA: structure-function model and evolutionary pattern. J Mol Evol. 1991;33:83–91. doi: 10.1007/BF02100199. [DOI] [PubMed] [Google Scholar]
- Sbisà E, Tanzariello F, Reyes A, Pesole G, Saccone C. Mammalian mitochondrial D-loop region structural analysis: identification of new conserved sequences and their functional and evolutionary implications. Gene. 1997;205:125–140. doi: 10.1016/s0378-1119(97)00404-6. [DOI] [PubMed] [Google Scholar]
- Schmitz J, Ohme M, Zischler H. The complete mitochondrial sequence of Tarsius bancanus: evidence for an extensive nucleotide compositional plasticity of primate mitochondrial DNA. Mol Biol Evol. 2002;19:544–553. doi: 10.1093/oxfordjournals.molbev.a004110. [DOI] [PubMed] [Google Scholar]
- Schmitz J, Piskurek O, Zischler H. Forty million years of independent evolution: a mitochondrial gene and its corresponding nuclear pseudogene in primates. J Mol Evol. 2005;61:1–11. doi: 10.1007/s00239-004-0293-3. [DOI] [PubMed] [Google Scholar]
- Tamura K, Dudley J, Nei M, Kumar S. MEGA4: molecular evolutionary genetics analysis (MEGA) software version 4.0. Mol Biol Evol. 2007;24:1596–1599. doi: 10.1093/molbev/msm092. [DOI] [PubMed] [Google Scholar]
- Thomas R, Zischler H, Päävo S, Stoneking M. Novel mitochondrial DNA insertion polymorphism and its usefulness for human population studies. Hum Biol. 1996;68:847–854. [PubMed] [Google Scholar]
- Thurston MI, Field D. [Accessed October 2008];Msatfinder: detection and characterisation of microsatellites. 2005 Available from: http://www.bioinf.ceh.ac.uk/msatfinder/
- Tilford CA, Kuroda-Kawagushi T, Skaletsky H, Rozen S, Brown LG, Rosenberg M, McPherson JD, Wylie K, Sekhon M, Kucaba TA, Waterson RH, Page DC. A physical map of the human Y chromosome. Nature. 2001;409:943–945. doi: 10.1038/35057170. [DOI] [PubMed] [Google Scholar]
- Triant DT, DeWoody JA. The occurrence, detection, and avoidance of mitochondrial DNA translocations in mammalian systematics and phylogeography. J Mamm. 2007;88:908–929. [Google Scholar]
- Ventura M, Catacchio CR, Alkan C, Marques-Bonet T, Sajjadian S, Graves TA, Hormozdiari F, Navarro A, Malig M, Baker C, Lee C, Turner EH, Chen L, Kidd JM, Archidiacono N, Shendure J, Wilson RK, Eichler EE. Gorilla genome structural variation reveals evolutionary parallelisms with chimpanzee. Genome Res. 2011;21:1640–1649. doi: 10.1101/gr.124461.111. [DOI] [PMC free article] [PubMed] [Google Scholar]
- Zardoya R, Meyer A. Cloning and characterization of a microsatellite in the mitochondrial control region of the African side-necked turtle, Pelomedusa subrufa. Gene. 1998;216:149–153. doi: 10.1016/s0378-1119(98)00332-1. [DOI] [PubMed] [Google Scholar]
- Zhao Z, et al. Worldwide DNA sequence variation in a 10-kilobase noncoding region on human chromosome 22. Proc Natl Acad Sci USA. 2000;97:11354–11358. doi: 10.1073/pnas.200348197. [DOI] [PMC free article] [PubMed] [Google Scholar]
- Zischler H, Geisert H, von Haeseler A, Pääbo S. A nuclear fossil of the mitochondrial D-loop and the origin of modern humans. Nature. 1995;378:489–492. doi: 10.1038/378489a0. [DOI] [PubMed] [Google Scholar]
- Zischler H, Geisert H, Castresana J. A hominoid-specific nuclear insertion of the mitochondrial D-loop: implications for reconstructing ancestral mitochondrial sequences. Mol Biol Evol. 1998;15:463–469. doi: 10.1093/oxfordjournals.molbev.a025943. [DOI] [PubMed] [Google Scholar]
Associated Data
This section collects any data citations, data availability statements, or supplementary materials included in this article.