Abstract
PURPOSE
Quantify the effects of microbubble (MB) size, elasticity and pulsed ultrasonic parameters on in vitro sonothrombolysis (STBL: ultrasound-mediated thrombolysis) efficacy.
MATERIALS AND METHODS
Monodispersive MBs with diameters of 1 μm or 3 μm were exposed to pulsed ultrasound (1 MHz or 3 MHz) to lyse rabbit blood clots. STBL efficacy (clot mass loss) was measured as functions of MB size and concentration, ultrasonic frequency and intensity, pulse duration (PD), pulse repeat frequency (PRF) and duty factor.
RESULTS
STBL at 1 MHz was more effective using 3 μm MBs and at 3 MHz using 1 μm MBs. STBL was generally more effective when 75% or more of MBs remained intact, especially for 3 μm MBs; and improving STBL by increasing PRF from 100 Hz to 400 Hz at 3 MHz was associated with increasing 3 μm MB survival. However, 60% of 1 μm MBs were destroyed during maximal STBL at 3 MHz, indicating that considerable MB collapse may be requisite for STBL under these conditions.
CONCLUSION
The ability to control MB size and elasticity permits utilizing a wide range of ultrasound parameters (frequency, intensity, etc.) to produce desired levels of STBL. Comparable, maximal STBL efficacy was achieved at twenty-fold lower intensity with 3 μm MBs (0.1 W/cm2) than with 1 μm MBs (2.0 W/cm2); a potential safety issue for in vivo STBL. Ultrasound parameters that maximized MB survival yielded maximal STBL efficacy; except with 1 μm MBs at 3 MHz where most MBs were destroyed.
Keywords: sonothrombolysis, microbubble, ultrasound, cavitation
INTRODUCTION
Sonothrombolysis (STBL) involves using ultrasonic energy to lyse clots and thrombi. Initial pre-clinical and clinical STBL studies investigated using ultrasound alone to disrupt thrombi within occluded vessels (1, 2), including those in the heart (3, 4), brain (5-7) and other locations (8-10). Combining ultrasound with thrombolytic agents, viz. heparin, urokinase, or tissue plasminogen activator (tPA) yielded enhanced STBL (11-13). Evidence suggests that ultrasonic shear forces, microstreaming, and radiation force fracture thrombi to facilitate deeper penetration of thrombolytics (14-16).
Ultrasonic cavitation was observed during STBL (17, 18), and may be one mechanism that promotes STBL. Consequently, encapsulated microbubbles (MBs) were combined with ultrasound in vitro to provide more cavitation nuclei and produced the expected increase in STBL efficacy (19-23). Combining MBs with ultrasound also improved STBL efficacy in clinical trials (24-26).
Ultrasound-MB interactions during STBL have been investigated using frequencies from the kHz (27-29) and into the lower MHz range (20, 22, 30, 31). Intracranial hemorrhage (ICH) that occurred during clinical trials using frequencies between 100-600 kHz (32) influenced some investigators to concentrate on using low MHz frequencies for STBL; although clinical complications were also reported when using 2 MHz ultrasound (7,24,26).
MBs have been tagged with antibodies and other adducts that bind to fibrin, platelets and other components of a thrombus (23, 30, 33, 34) to increase local MB concentration near clots and thrombi to maximize STBL. MBs have been combined with tPA to further improve STBL efficacy (21, 23, 29, 31, 35) and possibly minimize the amount of tPA required for STBL to reduce bleeding and other tPA-associated clinical complications (23, 35). tPA has also been encapsulated so that localized ultrasound will induce MB cavitational activity to target tPA release at the thrombus (29) to minimize systemic complications.
Because there is strong evidence that ultrasonic cavitation is an important mechanism for STBL (1, 2, 17, 18, 20, 36, 37) it is logical to investigate the effects that MB size, shell elasticity, and other properties relevant to cavitation (38-43) have on STBL efficacy. However, most studies involved adjusting ultrasonic output parameters (center frequency, pressure/intensity, pulse repetition frequency, duty factor, and exposure duration) because most investigators used commercial MBs and thus could not adjust MB parameters.
This study investigates the effects that MB size and shell elasticity have on STBL efficacy in vitro. MB concentration and ultrasonic output parameters were tested and optimized for maximal in vitro STBL of clots produced from fresh rabbit blood using pulsed ultrasound at a center frequency of either 1 MHz or 3 MHz.
MATERIALS AND METHODS
Production of Clot from Rabbit Blood
A 270 μL aliquot of fresh rabbit blood was placed into an 18mm well on a Boerner glass slide and then covered with an 18 mm circular glass coverslip to exclude air-blood contact. The Boerner slide was placed inside a humidified 37°C incubator for 3 h. The clotted blood was then removed and placed in a 35 mm plastic culture dish containing 3-4mL of rabbit serum (room temperature) and was cut into square pieces weighing 7.5-10 mg (35).
Microbubbles
MBs were prepared by sonicating decafluorobutane gas-saturated solutions of bovine serum albumin (BSA: Sigma-Aldrich Co., St. Louis, MO: cat # A7906) and dextrose (DEX: Sigma-Aldrich Co. St. Louis, MO: cat # G7528) using a 20 kHz Fisher 500 Sonic Dismembrator (Thermo Fisher Scientific, Waltham, MA). The concentrations of BSA and DEX, and the sonication parameters, were varied to produce an abundance of MBs with the desired diameter (35, 44). Multiple, differential buoyancy, fractionation steps were used for size separation to produce uniformly sized MB preparations (44). The 1 μm diameter MBs were produced using the 1 μm MB protocol A and the 3 μm diameter MBs were produced using the 3 μm MB protocol B, as described by Borrelli et al. (44).
Microbubble Concentration
MBs were warmed to room temperature, diluted with PBS and MB concentration was measured as a function of optical density at 530 nm using standard curves established previously (44). MB concentrations were spot checked regularly with hemocytometer counts.
In Vitro Sonothrombolysis
The experimental system and protocol for in vitro STBL has been described and illustrated previously (35). Briefly, clot was weighed and suspended in a vertical, acoustically transparent Mylar tube that was pre-filled with PBS. MBs suspended in PBS flowed into the Mylar tube, from below, at a constant rate of 0.5 mL/min (2.4 cm/min linear velocity). This Mylar chamber was suspended in a tank filled with degassed water at 25°C. Pulsed or continuous wave (CW) ultrasound was delivered horizontally using a circular, flat, piezoelectric transducer located 6.5 cm from the Mylar tube’s center. The majority of ultrasound exposures were performed using a 100 Hz pulse repeat frequency (PRF) and a 2 ms pulse duration (PD).
Clots were exposed to ultrasound for 15 min, wicked dry with absorbent paper and then re-weighed. The fractional change in clot weight was used as the endpoint for reporting STBL efficacy. Experiments were performed without MBs to determine STBL with ultrasound only, and sham experiments were performed identically but without transducer activation.
Experiments were performed at 25°C to minimize the effects of tPA, plasmin, etc. trapped within prepared clots and thus accentuate the physical STBL of MBs and ultrasound.
Microbubble Collapse/Destruction
The concentration of MBs entering the STBL chamber was measured and the MB suspension that flowed passed the clot and ultrasonic field was collected to quantify changes in MB concentration that resulted from MB destruction during STBL (44). MB survival is reported as the fraction of original MBs remaining intact.
Atomic Force Microscopy (AFM) of MBs to Determine Young’s Modulus
Sample Preparation for AFM Analysis
Mica discs were treated with a 0.6% aqueous solution of 300,000 MW poly-L-Lysine, rinsed with 18 MΩ water, and were suspended atop a drop of MB suspension. The MBs rose and attached onto the mica surface via charge attraction, and following a PBS rinse the discs were placed MB side up into a PBS-filled holder to perform AFM measurements.
AFM Imaging and Nanoindentation
Topography scans and nanoindentations were performed using an Agilent 5500 AFM in Acoustic AC mode (AAC). A sharp silicon tip of radius R < 8 nm and cantilever stiffness coefficient kc of 0.2 ± 10% N/m (Arrow CONT, NanoWorld AG) was used for both imaging and nanoindentations, and all measurements were made with the MBs submerged in PBS. Topography scans were performed at a scan rate of 1 Hz and nanoindentations were performed using the ‘Indent’ module in the AFM control software. Deflection of the cantilever was calibrated by pressing the tip into the hard substrate material (mica) near the object to be indented. At each nanoindentation location, a total of eight scanner displacement-cantilever deflection curves were obtained. In each curve, indentation information was recorded until a maximum cantilever deflection of 60 nm on the MBs was reached. A topographic scan was performed after each indentation to confirm that the indented bubble did not move or burst during the indentation process.
Data Analysis
Indentation force F on the MB was determined by multiplying the cantilever deflections d by the cantilever stiffness coefficient:
| (1) |
The depth of the nanoindentation δ is determined by
| (2) |
where Z is the piezo displacement obtained from the displacement-deflection curves. To obtain the Young’s modulus of the microbubbles, the F vs. δ curves are plotted and fitted by the Hertz model for conical tips (45):
| (3) |
E is the Young’s modulus, δH is the theoretical indentation predicted by the Hertz model, and σ is the Poisson’s ratio. The Hertz model assumes no adhesion between the AFM tip and indented sample.
RESULTS
MB Concentration and STBL Efficacy
STBL efficacy was tested as a function of MB concentration to determine the concentration of 1 μm or 3 μm MBs that yielded maximal STBL. These data are available online (Online Figures 1 and 2). The optimal concentration for STBL with 1 μm MBs was 5.4×108 MB/mL and only five-fold greater than the optimal concentration of 1.1×108 MB/mL for 3 μm MBs.
Ultrasonic Intensity and STBL Efficacy
The relationships between STBL efficacy and pulsed ultrasonic intensity (100 Hz PRF and 2 ms PD) for the 1 μm and 3 μm diameter MBs are presented, respectively, in Figs. 1A and 1B, obtained using the optimized concentration of 5.4×108 MB/mL for 1 μm MBs and 1.1×108 MB/mL for 3 μm MBs. As expected, STBL efficacy was greater for each different diameter MB at the frequency closest to its natural resonant frequency.
FIGURE 1. Sonothrombolysis efficacy as a function of Ultrasonic Intensity at 1 MHz and 3 MHz (pulsed ultrasound with 100 Hz PRF, 2 ms PD, and 20% duty factor).
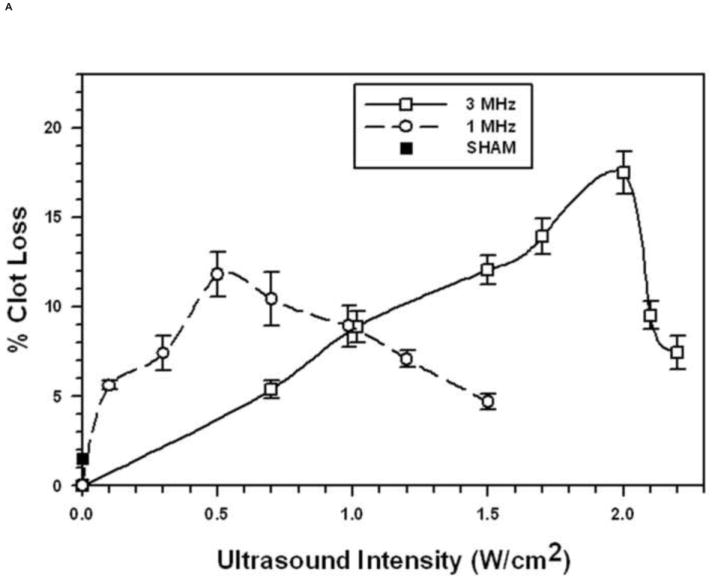
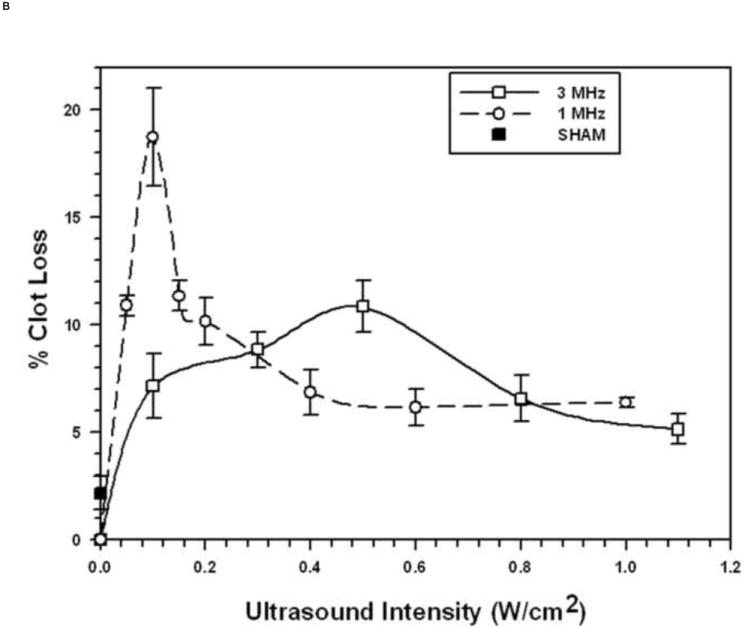
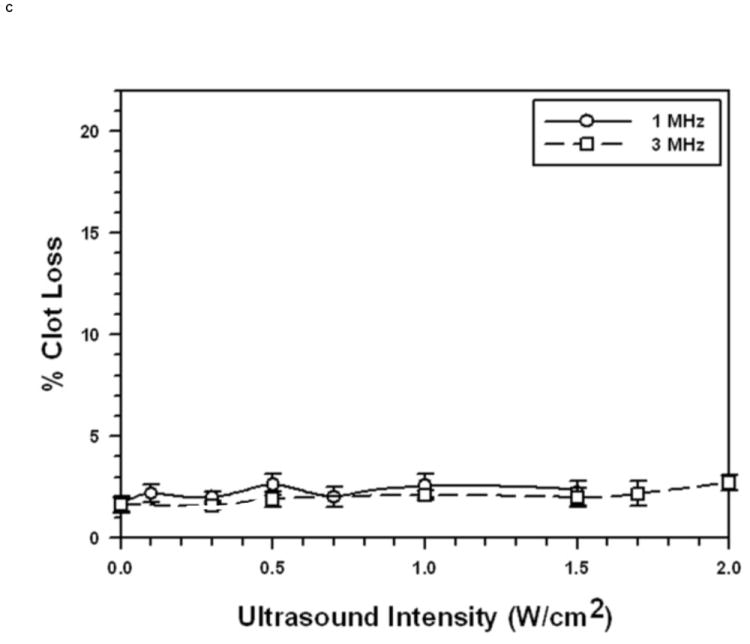
Each symbol represents the mean of a minimum of four measurements and the error bars indicate standard deviation. Data points near minima and maxima are the results of six to ten measurements to ensure accuracy.
A. With 1 μm diameter Microbubbles (5.4 × 108 MB/mL).
B: With 3 μm diameter Microbubbles (1.1 × 108 MB/mL)
C: Without Microbubbles
STBL efficacy as a function of ultrasound intensity, without MBs, is presented in Fig. 1C. These data demonstrate clearly that STBL without MBs was minimal at 25°C and that the STBL illustrated in Figs. 1A and 1B was due predominantly to MB-ultrasound interactions.
During selected experiments the tip of a 0.25 mm diameter thermocouple was inserted into the center of the clot to record temperature changes during STBL, without or with MBs. The temperature increase during STBL never exceeded 0.5°C during 15 min of STBL (Fig. 2) demonstrating that a temperature rise did not cause or influence clot loss during STBL.
FIGURE 2. Temperature Measurements during STBL with MBs and Pulsed Ultrasound (PRF 100 Hz, PD 2 ms, 20% duty factor).
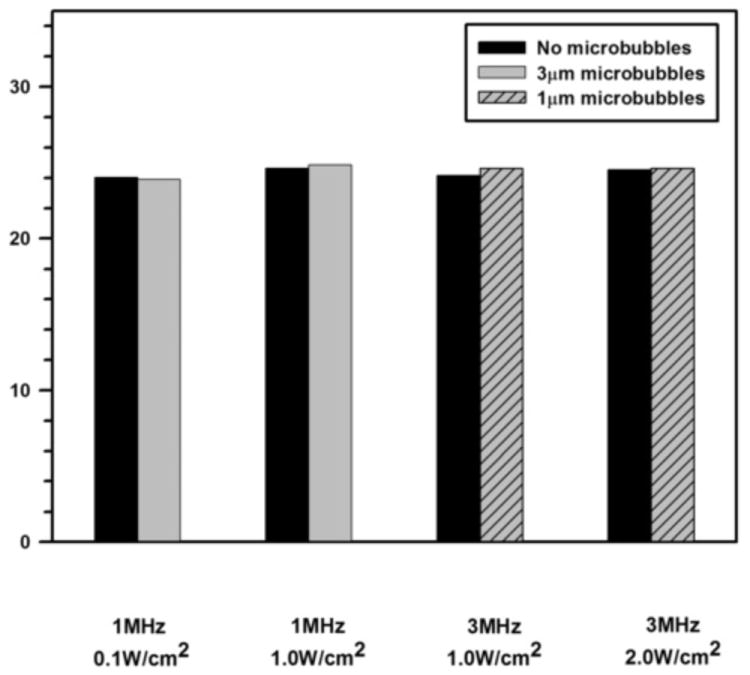
The tip of a 0.25 mm diameter thermocouple was inserted into the middle of the clot and temperature recordings were made prior to and during STBL with pulsed ultrasound (PRF 100 Hz, PD 2 ms, 20% duty factor). This was done using acoustic intensities corresponding to the maximal STBL rates achieved with the 1μm and 3μm MBs at 1 MHz and 3 MHz. The data herein show the average, steady state temperature increase (mean of three measurements) that was observed during STBL, and that this was identical with and without MBs. The temperature increase never exceeded 0.4°C, and was the same with or without MBs; even though STBL was about ten-fold higher in the latter case. Hence, the minimal ultrasound-induced temperature rise was not a contributing factor to the process of STBL.
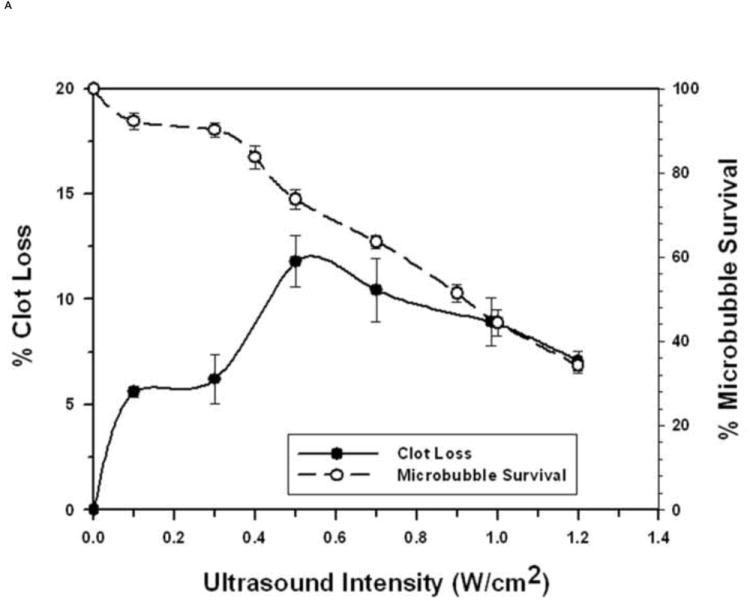
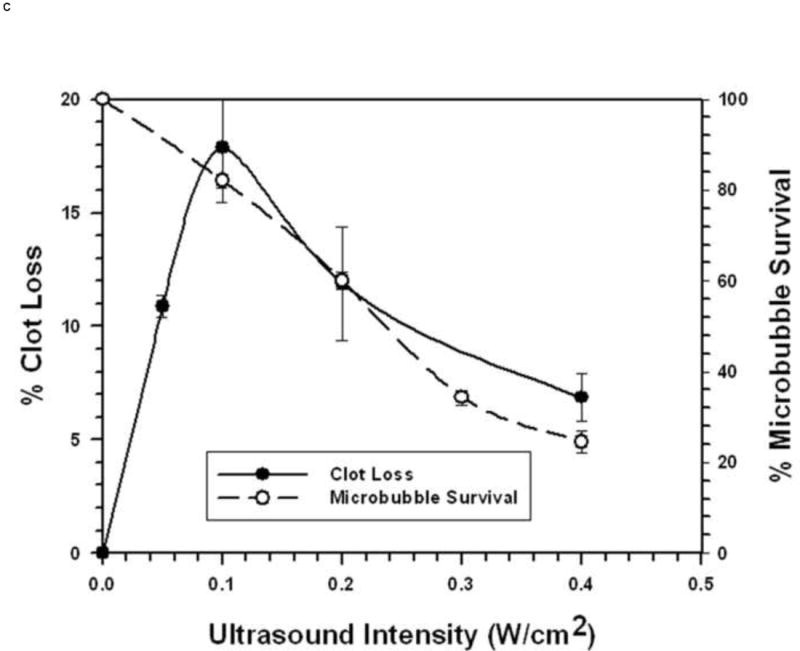
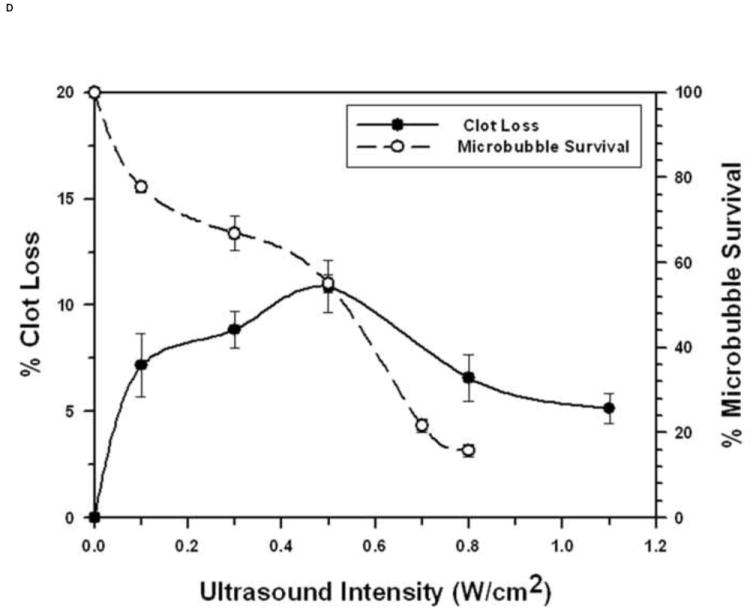
The general trend was that as ultrasonic intensity increased there was little MB destruction as STBL efficacy approached and reached maximum (Figs. 3A, 3C, and 3D). Continuing to increase intensity reduced STBL efficacy with a rapid reduction in MB survival. Thus, maximal STBL occurred at the highest ultrasonic intensity at which a majority of MBs remained intact.
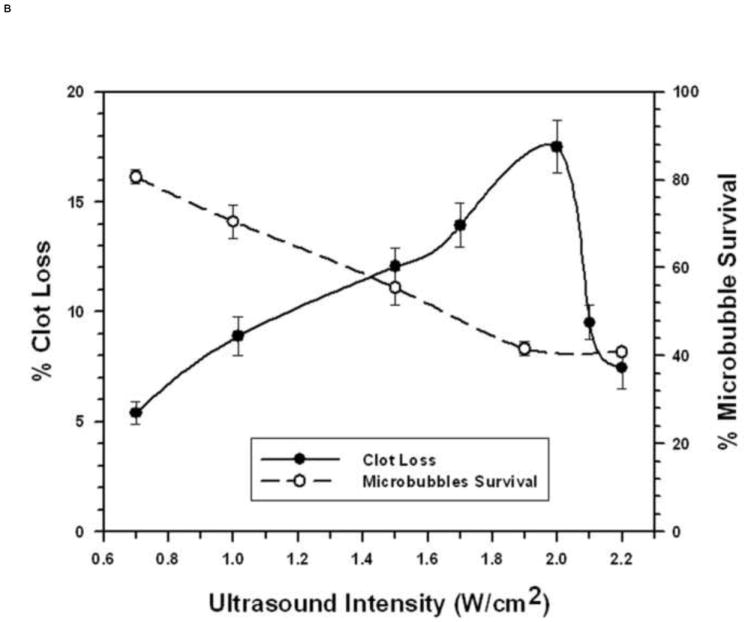
FIGURE 3. Microbubble Survival as a Function of Ultrasonic Intensity.
Each symbol represents the mean of a minimum of four measurements and the error bars indicate standard deviation.
A: With 1 μm diameter Microbubbles at 1 MHz.
B: With 1 μm diameter Microbubbles at 3 MHz.
C: With 3 μm diameter Microbubbles at 1 MHz.
D: With 3 μm diameter Microbubbles at 3 MHz.
The 1 μm diameter MBs exhibited markedly different relationships between MB survival, ultrasonic intensity, and STBL at 3 MHz. STBL did not increase significantly until an ultrasonic intensity that destroyed 25% or more of 1 μm MBs (Fig. 3B). STBL efficacy continued to increase as MB survival decreased and STBL efficacy reached a maximum at 2 W/cm2, which destroyed 60% of the MBs. MB survival then remained at 40% even though STBL efficacy decreased sharply to 30% of the maximum level as intensity was increased further.
MB Young’s Modulus and STBL
The protocol used to produce the 3 μm MBs used for the experiments illustrated in Figs. 1B, 3C and 3D (3 μm MB-B (44)) was altered to change MB shell strength and elasticity (Young’s Modulus). One new 3 μm MB (3 μm MB-A (44)) was produced by reducing the serum albumin concentration three-fold (from 5% to 1.67%) but keeping the sonication steps unchanged, while another 3 μm MB (3 μm MB-C (44)) was produced by keeping the BSA and dextrose concentrations unchanged but increasing the duration of the first sonication step from 30 sec to 40 sec and the second sonication step from 20 sec to 30 sec.
Figure 4 presents data for STBL efficacy versus ultrasonic intensity at 1 MHz for these two other 3 μm MBs superimposed on the data for the original 3 μm MB (3 μm MB-B) from Fig. 1B, with the AFM-measured Young’s modulus for each 3 μm MB indicated. The 3 μm MB-A with the reduced Young’s Modulus, was more susceptible to ultrasonic lysis at 1 MHz and exhibited a markedly lower STBL efficiency. The 3 μm MB-C was more resistant to ultrasonic lysis and exhibited a more consistent maximal STBL level over a wider intensity range; albeit with a significantly lower STBL maximum than that obtained with 3 μm MB-B. Increasing the Young’s Modulus might have increased the resonant frequency of 3μm MB-C and thus reduced STBL at 1 MHz. However, this possibility was not investigated.
FIGURE 4. Effect of Adjusting Microbubble Elasticity on Sonothrombolysis Efficacy.
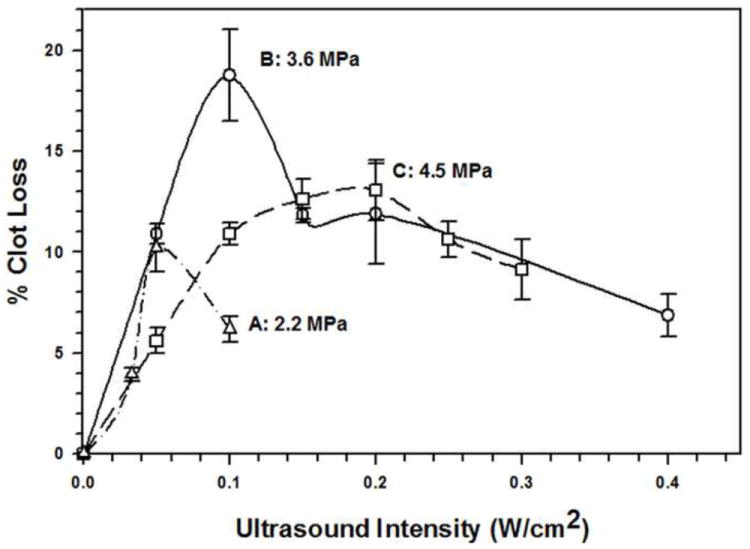
Three different 3 μm diameter microbubble preparations (preparations A, B, and C) were produced to have distinctly different values of their Young’s Modulus (as described in the text). In vitro sonothrombolysis was performed with each microbubble preparation at 1 MHz and at different ultrasonic intensities. The effect that changing the Young’s Modulus had on sonothrombolysis efficacy is evident.
Effect of Pulse Duty Factor on STBL
Ultrasonic pulse parameters were modified to determine how duty factor (PD × PRF) affected STBL efficacy. For the 1μm MBs at 1 MHz and 3 MHz, and for the 3 μm MBs at 1 MHz, maximal STBL was achieved with a duty factor of 20% and all attempts to increase duty factor produced reduced levels of STBL (see Online Figures 2A-2C). The one exception was increasing duty factor with a 400 Hz PRF with 3 μm MBs at 3 MHZ, which produced more efficient STBL for duty factors greater than 20% (Fig. 5). The fraction of surviving MBs as a function of duty factor is also indicated in Fig. 5 and shows that more MBs were preserved with a 400 Hz PRF.
FIGURE 5. Effect of changing Duty Cycle on Sonothrombolysis Efficacy for 3 μm Microbubbles at 3 MHz.
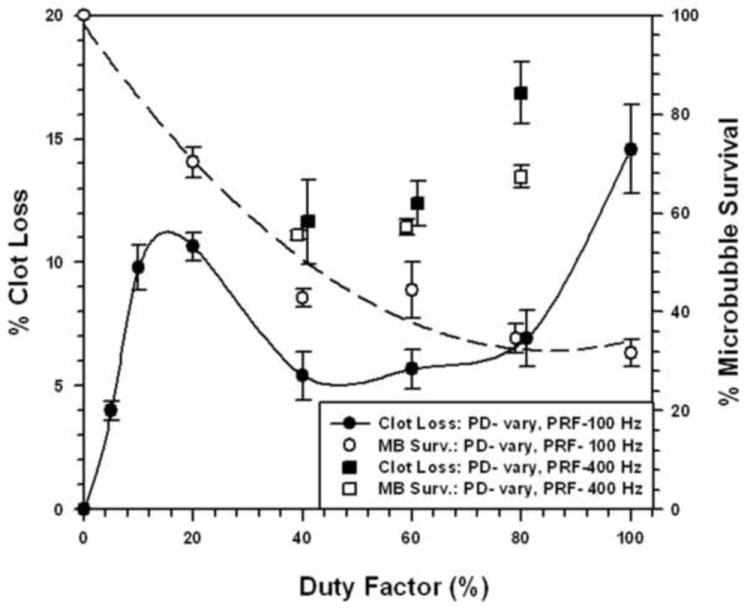
Sonothrombolysis was performed at 3 MHz, as a function of duty factor, using pulsed ultrasound with a PRF of 100 Hz or 400 Hz and an acoustic intensity of 0.5 W/cm2. Data for microbubble survival are also presented.
Each symbol represents the mean of a minimum of four measurements and the error bars indicate standard deviation. Data points near minima and maxima are the results of six to ten measurements to ensure accuracy at these critical transition regions.
DISCUSSION
This study provides quantitative data concerning how combining MBs with ultrasound improves STBL and how MB size and shell elasticity affect STBL as a function of ultrasonic frequency and intensity. As expected, the MB concentration required for maximal STBL with 1 μm and 3 μm MBs was different, with that for 1 μm MBs being 5 times greater than that for the 3 μm MBs. This was significantly less than the nine-fold difference in cross sectional area or twenty-seven-fold difference in gas volume between these MBs. The fact that these experiments involved using a cloud of MBs, with complex MB-MB interactions, certainly impacted the relationship between MB diameter and the MB concentration required for maximal STBL.
Using MBs increased STBL efficacy markedly compared to that achieved with ultrasound only, as anticipated based upon results of earlier studies (19-23, 24-26, 35). Experiments demonstrated that at least 70-80% of either 1 μm or 3 μm MBs remained intact when exposed to 1 MHz ultrasound that produced maximal STBL (Figs. 1A and 1B). As more MBs collapsed STBL efficacy decreased proportionately, indicating that intact MBs are required for maximal STBL at 1 MHz, and supports the contention by Datta et al. 2006 (36) that stable cavitation is an important mechanism for STBL. However, these results do not eliminate the possibility that collapsing MBs also contributed to maximal STBL directly via shock waves, releasing encapsulated perfluorocarbon gas that then cavitated to produce STBL (rebound cavitation; 41), or stimulating greater nonlinear responses among intact MBs.
The relationship between STBL efficacy and intact MBs is less clear at 3 MHz where maximal STBL was achieved when 55% to 60% of 3 μm MBs were destroyed during insonation that yielded maximal STBL (Fig. 3D). One possibility is that an acoustic intensity high enough to collapse approximately 40% of the MBs was required to stimulate the remaining, intact MBs sufficiently to achieve maximal STBL; i.e. approximately 60% of the MBs driven to the limits of collapse produced more STBL than a greater number of MBs driven at a lower intensity. Alternatively, the hypothesis that a combination of MBs collapsing during inertial cavitation plus intact, stably cavitating 3 μm MBs is required for maximal STBL at 3 MHz remains valid.
The relationship between intact MBs and STBL efficacy is especially complicated for 1 μm MBs at 3 MHz. Figure 3B illustrates that 1 μm MB survival decreased steadily as STBL efficacy improved with increasing ultrasonic intensity and the sharp decrease in STBL efficacy observed as intensity was increased slightly above 2 W/cm2 is not accompanied by a further decrease in MB survival. One plausible explanation is that at maximal STBL efficacy MB collapse occurred sometime shortly after the MBs flowed past the clot; thus they contributed to clot destruction but collapsed before being collected for assay. The small increase in intensity that caused the marked decrease in STBL efficacy (Fig. 1B) then caused MBs to collapse before they could contribute significantly to STBL. Visual observation showed that the MBs were not destroyed prior to reaching the clot. Unfortunately, the experimental system was incapable of determining exactly what occurred.
Figures 1A and 1B show that 3 μm MBs yielded greater STBL efficacy than 1 μm MBs at the same acoustic intensity using a 20% duty factor and 100 Hz PRF. Thus, 3 μm MBs were more efficient at transducing ultrasonic energy into STBL on a per MB basis. The 1 μm MBs were more resistant to collapse with increasing intensity at 3 MHz than the 3 μm MBs, hence they could be used to produce greater STBL at 3 MHz. However, when PRF and PD were adjusted at 3 MHz such that 3 μm MB integrity was maintained better while insonating with a higher duty factor (Fig. 5), STBL efficacy at 0.5 W/cm2 increased markedly and approached that produced with the 1μm MBs using 2.0 W/cm2.
The issue of MBs transducing ultrasound energy to STBL more efficiently is important. Pre-clinical and clinical STBL studies have encountered significant bleeding and other ultrasound-related complications. These complications can arguably be reduced by using lower intensity ultrasound, which could be accomplished using MBs that are more efficient at transducing ultrasound to STBL. Based on this study, it appears that using MBs larger than 1 μm in diameter will be better at doing this. Furthermore, the 3 μm diameter MBs produced greater STBL at 1 MHz, which can penetrate tissues further and thus requires less incident energy to yield the necessary intensity at the site where STBL is required.
Increasing the Young’s Modulus of 3 μm MBs from 2.2 MPa to 3.6 MPa increased the maximally attainable STBL by two-fold because the latter were able to be insonated with a two-fold higher intensity (0.1 W/cm2 compared to 0.05 W/cm2) before a significant fraction of MBs collapsed. However, when the Young’s Modulus was increased further to 4.5 MPa the maximally attainable STBL was 40% lower, although attainable over a wider intensity range. Increasing the Young’s Modulus from 3.6 MPa to 4.5 MPa may have stiffened the MB shell and increased its resonance frequency such that more acoustic energy was required for STBL at 1 MHz. Insonation at a higher frequency would putatively improve STBL.
The observation that increasing the PRF to 400 Hz permitted using higher duty factors to improve STBL efficacy with 3 μm MBs at 3 MHz is notable. The higher PRF may have preserved MBs because the shorter PDs reduced the duration of sustained cavitation without pause, which might have reduced MB shell mechanical fatigue to preserve MB integrity. Shorter PDs also maintain a richer ultrasonic frequency spectrum in each pulse that might enhance nonlinear MB oscillations in a manner that improves STBL. This approach to increasing STBL by adjusting duty factor and PRF needs to be explored further using other combinations of MB diameter, MB Young’s Modulus, ultrasonic intensity, and ultrasonic frequency to produce more effective STBL, and such experimentation may also impact how ultrasound and MBs are employed for other applications, e.g. sonoporation and sonophoresis.
In summary, this study illustrated that MB size and elasticity affect STBL efficacy markedly and demonstrated this with specific experiments using uniformly sized 1μm and 3 μm diameter MBs. Experiments also showed how adjusting the frequency, intensity, pulse duration and duty cycle of the actinic ultrasound affected STBL with these two different sized MBs. Thus, being able to control both MB and ultrasound parameters provides more options for optimizing MB-ultrasound interactions for STBL, sonoporation, etc. As is often the case, this study might have initiated more questions than it answered, but it hopefully helps identify which questions need to be addressed to further understand how the physical and acoustical properties of MBs affect MB-ultrasound induced STBL.
Acknowledgments
This work was supported in part by: NIH Grants R01 CA99178 (MJB), R01 HL082481 (WCC), and R37EB002641 (WDO, MLO), and by a grant from the Arkansas Biosciences Institute (MJB and ST), the major research component of the Arkansas Tobacco Settlement Proceeds Act of 2000.
Footnotes
MATERIAL IN THIS MANUSCRIPT REPORTED AT THE 2010 SIR MEETING
Publisher's Disclaimer: This is a PDF file of an unedited manuscript that has been accepted for publication. As a service to our customers we are providing this early version of the manuscript. The manuscript will undergo copyediting, typesetting, and review of the resulting proof before it is published in its final citable form. Please note that during the production process errors may be discovered which could affect the content, and all legal disclaimers that apply to the journal pertain.
References
- 1.Sobbe A, Stumpff U, Trubestein G, Figge H, Kozuschek W. Die Ultraschall-Auflossung von Thromben (Thrombolysis by ultrasound) Klin Wochenschr. 1974;52:117–121. doi: 10.1007/BF01468622. [DOI] [PubMed] [Google Scholar]
- 2.Siegel RJ, Fishbein MC, Forrester J, et al. Ultrasonic plaque ablation. A new method for recanalization of partially or totally occluded arteries. Circulation. 1988;78:1443–1448. doi: 10.1161/01.cir.78.6.1443. [DOI] [PubMed] [Google Scholar]
- 3.Kotsuka Y, Furuse A, Matsunaga H, Chikada M. Ultrasonic angioplasty for ostial stenosis of the left coronary artery. Cardiovasc Surg. 1993;1:192–194. [PubMed] [Google Scholar]
- 4.Eccleston DS, Cumpston GN, Hodge AJ, Pearne-Rowe D, Don Michael TA. Ultrasonic coronary angioplasty during coronary artery bypass grafting. Am J Cardiol. 1996;78:1172–1175. doi: 10.1016/s0002-9149(96)90076-4. [DOI] [PubMed] [Google Scholar]
- 5.Cintas P, Le Traon AP, Larrue V. High rate of recanalization of middle cerebral artery occlusion during 2-MHz transcranial color-coded Doppler continuous monitoring without thrombolytic drug. Stroke. 2002;33:626–628. doi: 10.1161/hs0202.103073. [DOI] [PubMed] [Google Scholar]
- 6.Eggers J, Koch B, Meyer K, König I, Seidel G. Effect of ultrasound on thrombolysis of middle cerebral artery occlusion. Ann Neurol. 2003;53:797–800. doi: 10.1002/ana.10590. [DOI] [PubMed] [Google Scholar]
- 7.Alexandrov AV, Demchuk AM, Burgin WS, Robinson DJ, Grotta JC. Ultrasound-enhanced thrombolysis for acute ischemic stroke: phase I. Findings of the CLOTBUST trial. J Neuroimaging. 2004;14:113–117. [PubMed] [Google Scholar]
- 8.Drobinski G, Brisset D, Philippe F, et al. Effects of ultrasound energy on total peripheral artery occlusions: initial angiographic and angioscopic results. J Interv Cardiol. 1993;6:157–163. doi: 10.1111/j.1540-8183.1993.tb00848.x. [DOI] [PubMed] [Google Scholar]
- 9.Kuo WT, Gould MK, Louie JD, Rosenberg JK, Sze DY, Hofmann LV. Catheter-directed therapy for the treatment of massive pulmonary embolism: Systematic review and meta-analysis of modern techniques. J Vasc Interv Radiol. 2009;20:1431–1440. doi: 10.1016/j.jvir.2009.08.002. [DOI] [PubMed] [Google Scholar]
- 10.Larsson J, Carlson J, Olsson SB. Ultrasound enhanced thrombolysis in experimental retinal vein occlusion in the rabbit. Br J Ophthalmol. 1998;82:1438–1440. doi: 10.1136/bjo.82.12.1438. [DOI] [PMC free article] [PubMed] [Google Scholar]
- 11.Luo H, Steffen W, Cercek B, Arunasalam S, Maurer G, Siegel RJ. Enhancement of thrombolysis by external ultrasound. Am Heart J. 1993;125:1564–1569. doi: 10.1016/0002-8703(93)90741-q. [DOI] [PubMed] [Google Scholar]
- 12.Frenkel V, Oberoi J, Stone MJ, et al. Pulsed high-intensity focused ultrasound enhances thrombolysis in an in vitro model. Radiology. 2006;239:86–93. doi: 10.1148/radiol.2391042181. [DOI] [PMC free article] [PubMed] [Google Scholar]
- 13.Holland CK, Vaidyaa SS, Datta S. Coussios CC, and Shawa GJ Ultrasound-enhanced tissue plasminogen activator thrombolysis in an in vitro porcine clot model. Thromb Res. 2008;121:663–673. doi: 10.1016/j.thromres.2007.07.006. [DOI] [PMC free article] [PubMed] [Google Scholar]
- 14.Diamond SL, Anand S. Inner clot diffusion and permeation during fibrinolysis. Biophys J. 1993;65:2622–2643. doi: 10.1016/S0006-3495(93)81314-6. [DOI] [PMC free article] [PubMed] [Google Scholar]
- 15.Francis CW, Blinc A, Lee S, Cox C. Ultrasound accelerates transport of recombinant tissue plasminogen activator into clots. Ultrasound Med Biol. 1995;21:419–424. doi: 10.1016/0301-5629(94)00119-x. [DOI] [PubMed] [Google Scholar]
- 16.Sakharov DV, Hekkenberg RT, Rijken DC. Acceleration of fibrinolysis by high-frequency ultrasound: The contribution of acoustic streaming and temperature rise. Thromb Res. 2000;100:333–340. doi: 10.1016/s0049-3848(00)00319-4. [DOI] [PubMed] [Google Scholar]
- 17.Rosenschein U, Yakubov SJ, Guberinich D, et al. Shock-wave thrombus ablation, a new method for noninvasive mechanical thrombolysis. Am J Cardiol. 1992;70:1358–1361. doi: 10.1016/0002-9149(92)90775-t. [DOI] [PubMed] [Google Scholar]
- 18.Makin IR. Everbach EC Measurement of pressure and assessment of cavitation for a 22.5-kHz intra-arterial angioplasty device. J Acoust Soc Am. 1996;100:1855–1864. doi: 10.1121/1.416005. [DOI] [PubMed] [Google Scholar]
- 19.Tachibana K, Tachibana S. Albumin microbubble echo-contrast material as an enhancer for ultrasound accelerated thrombolysis. Circulation. 1995;92:1148–1150. doi: 10.1161/01.cir.92.5.1148. [DOI] [PubMed] [Google Scholar]
- 20.Porter TR, LeVeen RF, Fox R, Kricsfeld A, Xie F. Thrombolytic enhancement with perfluorocarbon-exposed sonicated dextrose albumin MBs. Am Heart J. 1996;132:964–968. doi: 10.1016/s0002-8703(96)90006-x. [DOI] [PubMed] [Google Scholar]
- 21.Mizushige K, Kondo I, Ohmori K, Hirao K, Matsuo H. Enhancement of ultrasound-accelerated thrombolysis by echo contrast agents: dependence on microbubble structure. Ultrasound Med Biol. 1999;25:1431–1437. doi: 10.1016/s0301-5629(99)00095-2. [DOI] [PubMed] [Google Scholar]
- 22.Culp WC, Porter TR, Xie F, et al. Microbubble potentiated ultrasound as a method of declotting thrombosed dialysis grafts: experimental study in dogs. Vasc Interv Radiol. 2001;11:351–358. doi: 10.1007/s00270-001-0052-4. [DOI] [PubMed] [Google Scholar]
- 23.Culp WC, Flores R, Brown AT, Lowery JD, et al. Successful Microbubble Sonothrombolysis Without Tissue-Type Plasminogen Activator in a Rabbit Model of Acute Ischemic Stroke. Stroke. 2011;42:2280–2285. doi: 10.1161/STROKEAHA.110.607150. [DOI] [PMC free article] [PubMed] [Google Scholar]
- 24.Molina CA, Ribo M, Rubiera M, et al. Microbubble administration accelerates clot lysis during continuous 2-MHz ultrasound monitoring in stroke patients treated with intravenous tissue plasminogen activator. Stroke. 2006;37:425–4299. doi: 10.1161/01.STR.0000199064.94588.39. [DOI] [PubMed] [Google Scholar]
- 25.Slikkerveer J, Dijkmans PA, Sieswerda GT, et al. Ultrasound enhanced prehospital thrombolysis using microbubbles infusion in patients with acute ST elevation myocardial infarction: rationale and design of the Sonolysis study. Trials. 2008;9:72. doi: 10.1186/1745-6215-9-72. [DOI] [PMC free article] [PubMed] [Google Scholar]
- 26.Molina CA, Barreto AD, Tsivgoulis G, et al. Transcranial ultrasound in clinical sonothrombolysis (TUCSON) trial. Ann Neurol. 2009;66:28–38. doi: 10.1002/ana.21723. [DOI] [PubMed] [Google Scholar]
- 27.Wu Y, Unger EC, McCreery TP, et al. Binding and lysing of blood clots using MRX-408. Invest Radiol. 1998;33:880–805. doi: 10.1097/00004424-199812000-00006. [DOI] [PubMed] [Google Scholar]
- 28.Wang B, Wang L, Zhou XB, Liu YM, Wang M, Qin H, Wang CB, Liu J, Yu XJ, Zang WJ. Thrombolysis effect of a novel targeted microbubble with low-frequency ultrasound in vivo. Thromb Haemost. 2008;100:356–361. [PubMed] [Google Scholar]
- 29.Shaw GJ, Meunier JM, Huang SL, Lindsell CJ, McPherson DD, Holland CK. Ultrasound-enhanced thrombolysis with tPA-loaded echogenic liposomes. Thromb Res. 2009;124:306–310. doi: 10.1016/j.thromres.2009.01.008. [DOI] [PMC free article] [PubMed] [Google Scholar]
- 30.Alonso A, Dempfle CE, Della Martina A, et al. In vivo clot lysis of human thrombus with intravenous abciximab immunobubbles and ultrasound. Thromb Res. 2009;124:70–74. doi: 10.1016/j.thromres.2008.11.019. [DOI] [PubMed] [Google Scholar]
- 31.Ribo M, Molina CA, Alvarez B, Rubiera M, Alvarez-Sabin J, Matas MJ. Intra-arterial Administration of Microbubbles and Continuous 2-MHz Ultrasound Insonation to Enhance Intra-arterial Thrombolysis. Neuroimaging. 2010;20:224–227. doi: 10.1111/j.1552-6569.2008.00357.x. [DOI] [PubMed] [Google Scholar]
- 32.Daffertshofer M, Gass A, Ringleb P, et al. Transcranial low-frequency ultrasound-mediated thrombolysis in brain ischemia: increased risk of hemorrhage with combined ultrasound and tissue plasminogen activator: results of a phase II clinical trial. Stroke. 2005;36:1441–1446. doi: 10.1161/01.STR.0000170707.86793.1a. [DOI] [PubMed] [Google Scholar]
- 33.Culp WC, Porter TR, Lowery J, Xie F, Roberson PK, Marky L. Intracranial clot lysis with intravenous microbubbles and transcranial ultrasound in swine. Stroke. 2004;35:2407–2411. doi: 10.1161/01.STR.0000140890.86779.79. [DOI] [PubMed] [Google Scholar]
- 34.Marsh JN, Senpan A, Hu G, Scott MJ, Gaffney PJ, Wickline SA, Lanza GM. Fibrin-targeted perfluorocarbon nanoparticles for targeted thrombolysis. Nanomedicine (Lond) 2007;2:533–543. doi: 10.2217/17435889.2.4.533. [DOI] [PubMed] [Google Scholar]
- 35.Brown AT, Flores R, Hamilton E, Roberson P, Borrelli MJ, Culp WC. Microbubbles Improve Sonothrombolysis in vitro and Decrease Hemorrhage in vivo in a Rabbit Stroke Model. Invest Radiol. 2010;46:202–207. doi: 10.1097/RLI.0b013e318200757a. [DOI] [PMC free article] [PubMed] [Google Scholar]
- 36.Datta S, Coussios CC, McAdory LE, et al. Correlation of cavitation with ultrasound enhancement of thrombolysis. Ultrasound Med Biol. 2006;32:1257–1267. doi: 10.1016/j.ultrasmedbio.2006.04.008. [DOI] [PMC free article] [PubMed] [Google Scholar]
- 37.Prokop AF, Soltani A, Roy RA. Cavitational mechanisms in ultrasound-accelerated fibrinolysis. Ultrasound Med Biol. 2007;33:924–933. doi: 10.1016/j.ultrasmedbio.2006.11.022. [DOI] [PubMed] [Google Scholar]
- 38.Church CC. Prediction of rectified diffusion during nonlinear bubble pulsations at biomedical frequencies. J Acoust Soc Am. 1988;83:2210–2217. doi: 10.1121/1.396349. [DOI] [PubMed] [Google Scholar]
- 39.Holland CK, Apfel RE. An improved theory for the prediction of microcavitation thresholds. IEEE Trans Ultrason Ferroelectr Freq Control. 1989;36:204–208. doi: 10.1109/58.19152. [DOI] [PubMed] [Google Scholar]
- 40.Khismatullin DB. Resonance frequency of Microbubbles: effect of viscosity. J Acoust Soc Am. 2004;116:1463–1473. doi: 10.1121/1.1778835. [DOI] [PubMed] [Google Scholar]
- 41.Ammi AY, Cleveland RO, Mamou J, Wang GI, Bridal SL, O’Brien WD., Jr Ultrasonic contrast agent shell rupture detected by inertial cavitation and rebound signals. IEEE Trans Ultrason Ferroelectr Freq Control. 2006;53:126–136. doi: 10.1109/tuffc.2006.1588398. [DOI] [PMC free article] [PubMed] [Google Scholar]
- 42.Doinikov AA, Haac JF, Dayton PA. Modeling of nonlinear viscous stress in encapsulating shells of lipid-coated contrast agent Microbubbles. Ultrasonics. 2009;49:269–275. doi: 10.1016/j.ultras.2008.09.007. [DOI] [PMC free article] [PubMed] [Google Scholar]
- 43.King DA, Malloy MJ, Roberts AC, Haak A, Yoder CC, O’Brien WD., Jr Determination of postexcitation thresholds for single ultrasound contrast agentmicrobubbles using double passive cavitation detection. J Acoust Soc Am. 2010;127:3449–3455. doi: 10.1121/1.3373405. [DOI] [PMC free article] [PubMed] [Google Scholar]
- 44.Borrelli MJ, O’Brien WD, Jr, Bernock LJ, et al. Production of uniformly sized serum albumin and dextrose microbubbles. Ultrasonics Sonochemistry. 2012;19 doi: 10.1016/j.ultsonch.2011.05.010. in press. [DOI] [PMC free article] [PubMed] [Google Scholar]
- 45.Sen S, Shyamsundar Subramanian S, Discher DE. Indentation and Adhesive Probing of a Cell Membrane with AFM: Theoretical Model and Experiments. Biophys J. 2005;89:3203–3213. doi: 10.1529/biophysj.105.063826. [DOI] [PMC free article] [PubMed] [Google Scholar]


