Abstract
Biosynthesis of the tryptophan tryptophylquinone (TTQ) cofactor activates the enzyme methylamine dehydrogenase. The diheme enzyme MauG catalyzes O-atom insertion and cross-linking of two Trp residues to complete TTQ synthesis. Solution optical and Mössbauer spectroscopic studies have indicated that the reactive form of MauG during turnover is an unusual bisFe(IV) intermediate, which has been formulated as a His-ligated ferryl heme [Fe(IV)=O] (heme A), and an Fe(IV) heme with an atypical His/Tyr ligation (heme B). In this study, Fe K-edge X-ray absorption spectroscopy and extended X-ray absorption fine structure studies have been combined with density functional theory (DFT) and time-dependent DFT methods to solve the geometric and electronic structures of each heme site in the MauG bisFe(IV) redox state. The ferryl heme site (heme A) is compared with the well-characterized compound I intermediate of cytochrome c peroxidase. Heme B is unprecedented in biology, and is shown to have a six-coordinate, S = 1 environment, with a short (1.85-Å) Fe–O(Tyr) bond. Experimentally calibrated DFT calculations are used to reveal a strong covalent interaction between the Fe and the O(Tyr) ligand of heme B in the high-valence form. A large change in the Fe–O(Tyr) bond distance on going from Fe(II) (2.02 Å) to Fe(III) (1.89 Å) to Fe(IV) (1.85 Å) signifies increasing localization of spin density on the tyrosinate ligand upon sequential oxidation of heme B to Fe(IV). As such, O(Tyr) plays an active role in attaining and stabilizing the MauG bisFe(IV) redox state.
Keywords: MauG, Fe K-edge X-ray absorption spectroscopy, High-valence Fe, Density functional theory, Heme
Introduction
MauG [1] is a c-type diheme enzyme responsible for completing the posttranslational synthesis of the tryptophan tryptophylquinone (TTQ) [2] cofactor of methylamine dehydrogenase (MADH) in Paracoccus denitrificans [3]. TTQ biosynthesis involves O-atom insertion into the indole ring of an already monohydroxylated Trp residue (MADH β-subunit Trp57), oxidation of the resultant quinol to the active quinone form, and covalent linking of this residue to another Trp residue (MADH β-subunit Trp108) [4–6]. Reaction of diferrous MauG with O2, or diferric MauG with 1 equiv of H2O2, produces the potent oxidant required for TTQ synthesis [1]. MauG is a periplasmic enzyme, and it is unknown whether the physiological substrate is O2, which requires reducing equivalents that are scarce in the oxidizing periplasm, or H2O2, whose periplasmic levels are unknown [although cytochrome c peroxidase (CCP) is present in the periplasm suggestive of some H2O2 being present]. Mössbauer spectroscopy showed that MauG forms a high-valence Fe(IV)=O/Fe(IV) diheme species [7]. However, detailed geometric and electronic structures of this unique oxidant have not been determined. An X-ray crystal structure of the resting ferric MauG in complex with the precursor MADH substrate, preMADH [8], revealed a five-coordinate c-type heme with axial N(His) coordination (referred to herein as heme A) and an open coordination site at which O2 and H2O2 could potentially bind. The second heme site was shown to be a unique six-coordinate c-type heme with His/Tyr axial coordination (referred to herein as heme B) [8]. The importance of the unusual Tyr ligand was demonstrated through mutation to a His, which formed a His/His ligated heme that could neither support a bisFe(IV) redox state nor catalyze TTQ formation [9]. The crystal structure also revealed a large separation between the MauG hemes and the site of cofactor formation in preMADH (Fig. 1). Upon addition of H2O2 to the crystals, TTQ was generated, demonstrating that this was the structure of the catalytically competent complex [8]. Redox titration studies have shown that the diheme center acts as a single redox unit with both hemes changing oxidation state simultaneously during interconversion between the Fe(II)/Fe(III) [10] and Fe(III)/Fe(IV) [7] states. This large redox cofactor is able to stabilize the bisFe(IV) at remarkable levels, with spontaneous decay occurring over several minutes [7, 11]. This is in stark contrast to all other hydroxylating heme enzymes, where the equivalent high-valence oxidant is fleeting and difficult to observe [12]. Indeed, a sufficient yield for full spectroscopic analysis was only recently accomplished for the long-established compound I intermediate of cytochromes P450 [13]. In the absence of productive catalytic chemistry, the instability of these high-valence species can lead to deleterious oxidative damage of cellular components. To avoid this, many of these enzymes have an ordered kinetic mechanism, in which the potent oxidant is not generated until the organic substrate has bound close to the heme, keeping unintended oxidative damage at acceptable levels [14]. In contrast, MauG exhibits random-order kinetics [11].
Fig. 1.
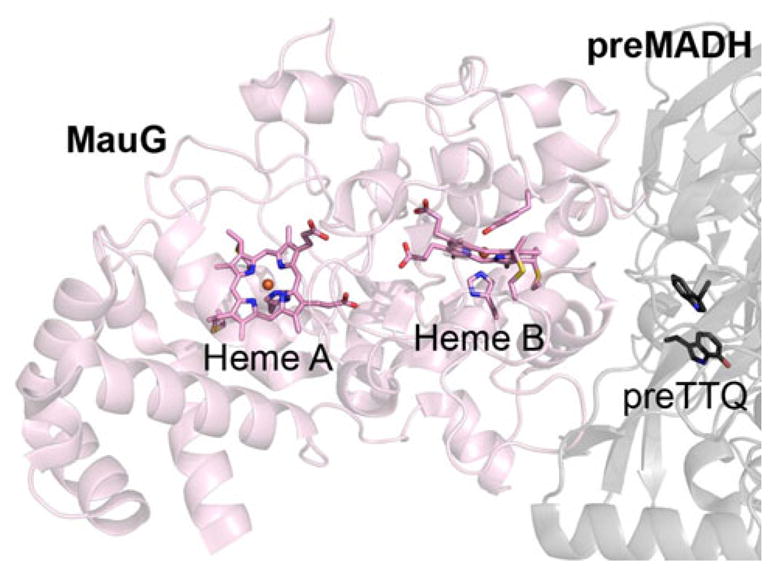
Spatial arrangement of the hemes and substrate precursor tryptophan tryptophylquinone (preTTQ) site in the crystal structure of MauG/precursor methylamine dehydrogenase (preMADH). MauG (pink) and preMADH (gray) chains are shown as a cartoon, with the hemes and preTTQ site of one half of the 2:1 MauG–preMADH complex in stick representation
Fe K-edge X-ray absorption spectroscopy (XAS) and the extended X-ray absorption fine structure (EXAFS) have emerged as important spectroscopic techniques for the study of high-valence Fe sites within enzyme catalytic intermediates [15–17]. In this study, a complete geometric structure determination and electronic structure description of the MauG bisFe(IV) redox state have been undertaken, using a combination of Fe K-edge XAS and EXAFS coupled with density functional theory (DFT) and time-dependent DFT (TD-DFT) calculations. Fe K-edge XAS and EXAFS data of the well-understood compound I of CCP (CCP-I) [18] are used to calibrate the ferryl heme A component of the MauG bisFe(IV). With use of the experimental data, theoretical studies are directed towards understanding the electronic structure of the unique Fe(IV) heme B site. These data show that the heme B site undergoes significant structural change [in the Fe–O(Tyr) bond] upon sequential oxidation of the diferrous species to a diferric species and then bisFe(IV). Thus, the heme B Tyr is shown to be an active participant in the remarkable stability of the bisFe(IV) redox state of this unusual diheme cofactor.
Materials and methods
MauG sample preparation
Diferrous MauG was prepared by stirring diferric MauG with a tenfold molar excess of sodium dithionite in an anaerobic glove box for approximately 30 min. UV/vis spectroscopy showed that conversion to diferrous MauG was complete. The diferrous MauG sample was loaded into XAS cells, which were minimally exposed to air during flash cooling. The final concentration for the two samples was 2.0 mM diferrous MauG and 2.1 mM diferric MauG, in 50 mM potassium phosphate pH 7.5 with 25 % glycerol. Samples for XAS evaluation of the time course of Fe(IV)=O/Fe(IV) MauG formation (and decay) were prepared in a cold room maintained at 277 K. An aliquot of a 0.1 M H2O2 solution in water (11 or 12 μL) was placed in an XAS cell with 37-μm X-ray-transparent Lucite tape windows. Concentrated diferric MauG (68 μL of 1.5 or 1.65 mM stock in 50 mM potassium phosphate pH 7.5, with 5 % glycerol) was added and the reaction sample was mixed by aspiration in the syringe. The reaction time was manually controlled, with flash cooling of the samples in liquid nitrogen. The final reaction volumes contained initially either 1.4 mM MauG with 15.0 mM H2O2 (i.e., 10.7-fold excess) and 4.3 % glycerol or 1.3 mM MauG with 13.9 mM H2O2 (i.e., 10.8-fold excess) and 4.3 % glycerol. CCP-I was prepared as described previously [18].
Fe K-edge XAS
The Fe K-edge X-ray absorption spectra of MauG [diferrous, diferric, and Fe(IV)=O/Fe(IV)] and CCP-I samples were obtained at the Stanford Synchrotron Radiation Lightsource on the unfocussed 20-pole 2-T wiggler side-station beam line 7–3 under standard ring conditions of 3 GeV and approximately 200 mA. A Si(220) double-crystal monochromator was used for energy selection. A Rh-coated harmonic rejection mirror was used to reject the components of higher harmonics. During data collection, the samples were maintained at a constant temperature of approximately 10 K using an Oxford Instruments CF 1208 liquid helium cryostat. Fluorescence mode was used to measure data to k = 17 Å−1 using a 30-element Ge solid-state detector windowed on the Fe Kα signal. Internal energy calibration was accomplished by simultaneous measurement of the absorption of an Fe foil placed between two ionization chambers situated after the sample. The first inflection point of the foil spectrum was assigned to 7,111.2 eV. The oxidized samples (ferric and high-valence samples of both MauG and CCP) were monitored for potential signs of photoreduction, and rapid photoreduction was observed in the diferric form of MauG and high-valence forms of MauG and CCP. To eliminate the effects of photoreduction, the monochromator was detuned by 20 %, and data were collected from several different spots on the sample, of which only the first scan of each spot was used in the analysis. The data represented here are eight-scan, 11-scan, and nine-scan averages for diferrous MauG, diferric MauG, and CCP-I, respectively. For the time course measurements, four-scan to eight-scan average spectra were collected. The data were processed by fitting a second-order polynomial to the pre-edge region and subtracting this background from the entire spectrum. A four-region spline of orders 2, 3, 3, and 3 was used to model the smoothly decaying postedge region. The data were normalized by subtracting the cubic spline (PySpline) [19], and by fitting a polynomial of order zero to the postedge, then dividing the entire spectrum by this constant (KaleidaGraph).
Least-squares fits were performed using the EDG_FIT program [20] to quantify the intensity and energy of the pre-edge feature. The pre-edge features were modeled using 1:1 Lorentzian–Gaussian pseudo-Voigt functions. The rising-edge background was modeled using a pseudo-Voigt function, which mimics the white line associated with the edge transition. Additional pseudo-Voigt peaks were also used to mimic shoulders on the rising edge. The data were fit over several different energy regions. The least-squares error and a comparison of the second derivatives of the data and fit were used to determine the goodness of fit. The standard deviations in energy and intensity over all successful fits were used to quantify errors in these parameters.
Kinetic modeling of the bisFe(IV) MauG yield
The rate equation is , where is the rate of decrease in the diferric MauG concentration, [H2O2] is the initial concentration of H2O2, which is treated as a constant under pseudo-first-order kinetics and folded into k. [MauG0] is the initial concentration of diferric MauG, k is the rate constant and t is time. We attempted the pseudo-first-order fit up to 60 s in two ways. First, we used the starting concentration of 0.0014 M for [MauG0] and performed four fits assuming 70, 80, 90 and 100 % conversion at 60 s. Second, we assumed a 100 % conversion at 60 s and used [MauG0] as a fitted parameter.
FEFF modeling
Theoretical EXAFS signals χ(k) were calculated using FEFF (Macintosh version 8.0) [21–24] and models based on the crystal structures of CCP-I and diferric MauG [8, 18]. Initial models were fit to the data using EXAF-SPAK [20]. The theoretical models were refined on the basis of the initial fits, and a new set of theoretical χ(k) were calculated, using the preliminary structural parameters obtained from the initial fits and FEFF. The data were refit using the new parameters. The structural parameters varied during the fitting process were the bond distance (R) and the bond variance (σ2), which is related to the Debye–Waller factor that results from thermal motion and static disorder. The nonstructural parameter E0 (the energy at which k = 0) was also allowed to vary, but was restricted to a common value for every component within a given fit. Coordination numbers were systematically varied in the course of the fit, but were fixed within a given fit.
In the case of MauG, fits were performed with theoretical parameters from both the heme A site and the heme B site. In the case of the heme B fits, the first-shell paths calculated from the heme A model were also included in the available list of paths to mimic contributions from the heme A site. Theoretical EXAFS signals χ(k) were also calculated using the DFT-optimized structure and fits to the MauG and CCP data sets. No changes in the final fit bond distances were observed, and insignificant changes were observed in the Debye–Waller-factor-related bond variance σ2 for the different paths.
Density functional theory
Gradient-corrected, spin-unrestricted, broken-symmetry, density functional calculations were performed using the ORCA (2.7.0) package [25, 26] on two eight-CPU Linux clusters. The Becke88 [27, 28] exchange and Perdew86 [29] correlation nonlocal functionals were employed. The coordinates obtained from the crystal structure of diferric MauG [8] (Protein Data Bank code 3L4M) were modified to generate the starting models for the Fe(II), Fe(III), and high-valence Fe(IV)=O species at the heme A site, and the Fe(II), Fe(III), and Fe(IV) species at the heme B site. The porphyrins in both heme A and heme B were truncated and modeled by octamethylporphyrin groups. The axial His ligand was truncated to 4-methylimidazole, and the axial deprotonated Tyr was truncated to 4-methylphenolate (4MP). The core properties basis set CP(PPP) [25, 30] (as implemented in ORCA) was used on the Fe, and the Ahlrichs all-electron triple-ζ TZVP basis set [31, 32] was used on all other atoms. The use of the CP(PPP) basis set in TD-DFT calculations has been shown to work well for metal centers [33, 34]. DFT calculations were also performed by systematically varying the functional, basis set, and dielectric constant, but this variation made no significant difference to the results presented here. Löwdin spin densities were obtained for the Fe(IV) heme A and Fe(IV) heme B sites using the hybrid functional B3LYP for comparison with the pure BP86 functional (Table S1). The pure functional (BP86) was chosen because it predicted the geometric structure of the Fe(IV) heme A site with the highest accuracy. A tight convergence criterion was selected. A conductor-like screening model was used, with water as solvent, in all calculations. Population analyses were performed by means of Mulliken population analysis. Wave functions were visualized and orbital contour plots were generated in Molden [35]. The compositions of molecular orbitals and overlap populations between molecular fragments were calculated using QMForge [36].
TD-DFT calculations were performed with the electronic structure program ORCA to calculate the energies and intensities of the Fe K-pre-edge transitions [33, 34, 37]. The tight convergence criterion was imposed on all calculations. The calculated energies and intensities were Gaussian-broadened with half widths of 1.5 eV to account for core–hole lifetime and instrument resolution. The calculated pre-edge energy positions were downshifted by 181.1 eV. This is generally the case, as DFT does not describe core potentials accurately, leading to core levels from TD-DFT calculations being too high in energy relative to the valence levels [34].
Results
Geometric and electronic structures of diferrous and diferric MauG
Fe K-edge XAS
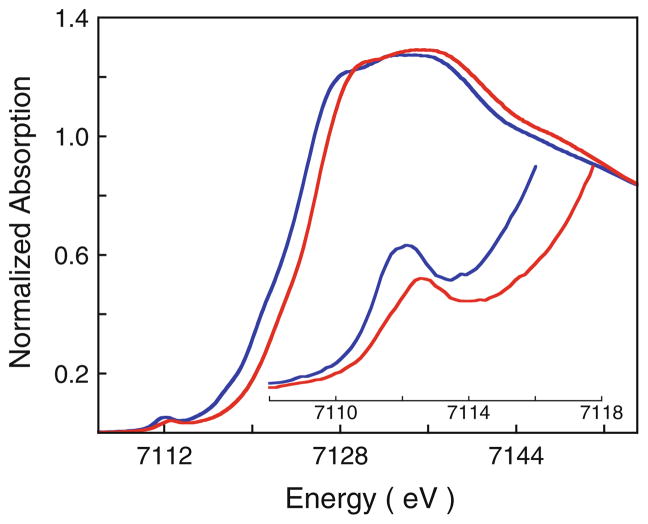
Figure 2 shows the normalized Fe K-edge XAS data for diferrous and diferric MauG. Both spectra have a weak low-energy transition before the rising edge, which is assigned to the electric-dipole-forbidden, quadrupole-allowed 1s → 3d transition [38–40]. The intensity and energy position of this weak 1s → 3d transition is known to be modulated by the oxidation state, bond strength, and spin state of the Fe center [40–42]. The pre-edge energy position does not change directly with changes in the effective nuclear charge Zeff, since the relative change in core versus valence orbital screening is significantly smaller than changes in the energies of valence levels due to bonding. However, bonding changes due to changes in Zeff play an important role to the pre-edge energy position, and this way, the effect of oxidation state is observed. This is directly observed in the similarity in the metal K- and L-edge energy shifts upon oxidation/reduction [41]. The intensity-weighted average energy of diferrous MauG occurs at 7,112.1 eV, and indicates the average energy position of the two heme sites (heme A and heme B). The pre-edge feature for diferric MauG is shifted to higher energy by 0.5 eV and occurs at 7,112.6 eV. EPR data have demonstrated that one of the c-type heme centers in MauG is low spin, with the other high spin, in both the diferrous state and the diferric state [1]. Since the spin states do not change upon oxidation, the shift in the pre-edge energy position of 0.5 eV indicates a relative increase in ligand field strength in diferric MauG compared with the diferrous enzyme.
Fig. 2.
The normalized Fe K-edge X-ray absorption spectrum of diferrous (blue curve) and diferric (red curve) MauG. The inset shows the expanded pre-edge region
The weak Fe K-pre-edge transition is followed by the intense electric-dipole-allowed rising edge, which is predominantly due to 1s → 4p + continuum transitions. The rising edge for diferrous MauG occurs at 7,121.9 eV, and is shifted to higher energy by 1.8 eV in diferric MauG, occurring at 7,123.7 eV (as measured by the intensity at half maximum). This increase in the rising-edge energy position reflects the increase in Zeff of the absorbing Fe site, and is consistent with the oxidation of both heme sites on going from diferrous to diferric MauG.
Fe K-edge EXAFS of diferrous and diferric MauG
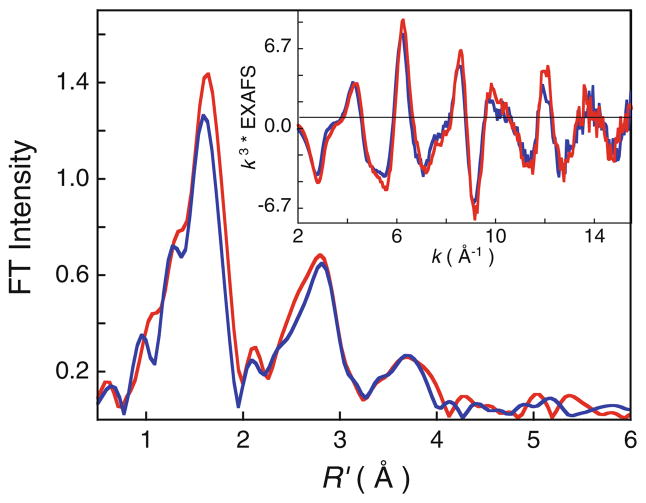
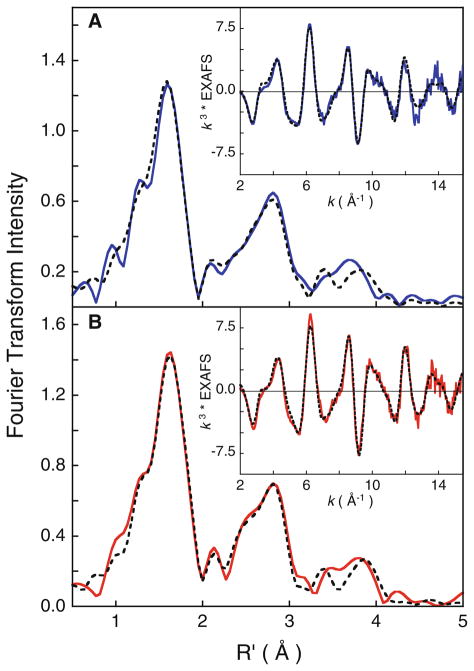
Figure 3 shows the non-phase-shift-corrected Fourier transform spectra for diferrous and diferric MauG, and the corresponding EXAFS data, which reflect the typical multiple-scattering beat pattern of heme [43]. FEFF fits were performed on the data over k = 2–15.5 Å−1, and the first-shell parameter space was explored with different total coordination numbers and split-shell fits in order to minimize the fit factor F (Table S2). The second-shell and third-shell single- and multiple-scattering components were kept constant for the first-shell parameter space search. The best fit for the diferrous MauG data is obtained with a first-shell composed of 4.5 Fe–N/O components at approximately 2.00 Å1 Attempts to fit the data with higher first-shell coordination numbers consistently resulted in worse fit factors, and changes in the split-first-shell fits were not significant, being well within the resolution determined by the fit range. The 4.5 Fe–N/O coordination is lower than expected, and indicates either a difference in the number of ligands for the two hemes or a spread of Fe–N/O first-shell ligands, both of which will lower the average coordination number. The best fit to the diferric MauG data was obtained with a short 0.5 Fe–N/O coordination at 1.89 Å and five Fe–N/O at 2 Å. The second and third shells were fit with single- and multiple-scattering components, but were kept constant for the first-shell parameter space test. The final best fits for both data sets are presented in Table 1 and Fig. 4. The fit results presented in Table 1 indicate two things: (1) the average coordination of the diferric MauG is greater than for diferrous MauG, and (2) a short Fe–O/N at 1.89 Å is present in diferric MauG,2 which is potentially absent/longer in diferrous MauG.
Fig. 3.
Non-phase-shift-corrected Fourier transform (FT) data for diferrous MauG (blue curve) and diferric MauG (red curve). The inset shows the corresponding extended X-ray absorption fine structure (EXAFS) data
Table 1.
Full extended X-ray absorption fine structure (EXAFS) least-squares fitting results for diferrous and diferric MauG
| Coordination | R (Å)a | σ2 (Å2)b |
|---|---|---|
| Diferrous MauG | ||
| 4.5 Fe–N/O | 2.00 | 290 |
| 8 Fe–C | 2.97 | 328 |
| 8 Fe–C/N | 3.03 | /328c |
| 8 Fe–C/N | 3.18 | /328c |
| 4 Fe–N | 3.38 | 275 |
| 8 Fe–C/N | 4.04 | 664 |
| 16 Fe–C/N–N/C | 4.31 | /664c |
| Diferric MauG | ||
| 0.5 Fe–N/O | 1.89 | 269 |
| 5 Fe–N/O | 2.00 | 202 |
| 8 Fe–C | 2.89 | 252 |
| 8 Fe–C | 3.04 | /252c |
| 8 Fe–C | 3.24 | /252c |
| 4 Fe–N | 3.37 | 309 |
| 8 Fe–C/N | 4.28 | 262 |
| 16 Fe–C/N–N/C | 4.33 | /262c |
Error (F) is given by Σ[(χobsd − χcalcd)2k6]/Σ[(χobsd)2k6] (diferrous MauG F = 0.39, E0 = 3.23, diferric MauG: F = 0.39, E0 = −1.86)
The estimated standard deviations for the distances are on the order of ±0.02 Å
The σ2 values are multiplied by 105
The slash before a parameter indicates that it is linked to the same parameter as its parent single-scattering path
Fig. 4.
Non-phase-shift-corrected Fourier transform data and fits for diferrous and diferric MauG: A diferrous MauG (blue curve data, broken curve fit); B diferric MauG (red curve data, broken curve fit). The insets show the corresponding EXAFS regions
Density functional theory
To evaluate the geometric structure obtained from the Fe K-edge EXAFS data analysis, gradient-corrected spin-unrestricted DFT calculations were performed on individual models of the heme A and heme B sites generated from the crystal structure coordinates of MauG in complex with preMADH [8]. Calculations were performed on the high-spin S = 2 Fe(II) and S = 5/2 Fe(III) forms of heme A, and low-spin S = 0 Fe(II) and S = 1/2 Fe(III) forms of heme B (see Figs. S1 and S2 for optimized structures). The heme A and heme B Fe(II) calculations resulted in a first shell with five Fe–Navg at 2.08 Å and six Fe–O/Navg at 2.00 Å, respectively (Fe–Navg is the average Fe–N distance). From an EXAFS perspective, this approximately 0.08- Å difference between the two sites is significant, and leads to damping of the first-shell wave, explaining why only 4.5 Fe–O/N first-shell contributions are required to obtain a good EXAFS fit (Table 1). The average bond distance obtained from DFT (approximately 2.04 Å) is slightly longer than experimentally observed (2.00 Å). The ferric heme A has a calculated first shell with five Fe–Navg at 2.07 Å, and the ferric heme B first shell is composed of one Fe–O at 1.89 Å and five Fe–Navg at 2.01 Å. This model would result in an EXAFS signal with 0.5 Fe–O at 1.89 Å and five Fe–N at 2.04 Å. This is in reasonable agreement with the experimental EXAFS data (Table 1).
Formation of the high-valence MauG intermediate from diferric MauG
Fe K-edge XAS
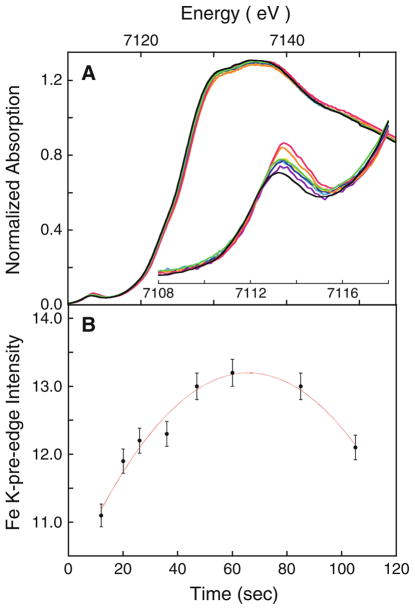
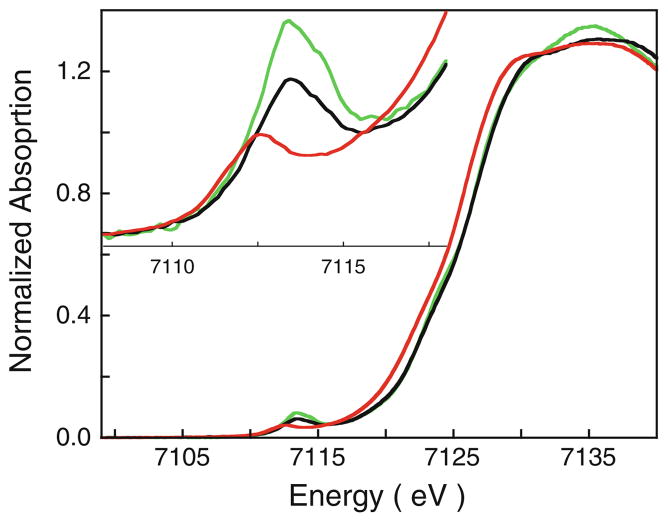
Preparation of the bisFe(IV) MauG intermediate at maximal yield under conditions necessary for XAS data collection was achieved through reaction of diferric MauG with tenfold excess H2O2 at 277 K for 60 s (Fig. 5). Both the pre-edge intensity and the rising-edge energy position reach a maximum at a reaction time of 60 s, and then decrease with longer reaction times. Upon oxidation of diferric MauG, the rising-edge half maximum shifts to higher energy by approximately 0.9 eV (to 7,124.6 eV), clearly reflecting an increase in oxidation state of the Fe center. The pre-edge energy position increases by approximately 0.8 eV (from 7,112.6 to 7,113.4 eV), reflecting an increase in ligand field strength, and is accompanied by an approximately 81 % increase in intensity. The shifts up in the rising edge and pre-edge energy positions are indicative of formation of the high-valence bisFe(IV) intermediate. The significant increase in the pre-edge intensity is consistent with the presence of a short Fe(IV)=O bond [17, 44].
Fig. 5.
A normalized Fe K-edge X-ray absorption spectroscopy (XAS) data for diferric MauG treated with H2O2 and flash-frozen at different time intervals (purple curve 12 s, light-blue curve 20 s, yellow curve 26 s, blue curve 36 s, orange curve 47 s, pink curve 60 s, green curve 85 s, black curve 105 s).The inset shows the expanded pre-edge region. B change in the Fe K-pre-edge integrated area with time of exposure. The bisFe(IV) MauG sample frozen at 60 s was used in the detailed XAS studies
As a reference for the Fe(IV)=O site in bisFe(IV) MauG, Fe K-edge XAS and EXAFS data were measured on CCP-I. The geometric and electronic structures of CCP-I have been well characterized by optical and X-ray spectroscopies, and recently by high-resolution single-crystal X-ray diffraction [18, 45–49]. The active site of CCP-I contains an S = 1 (heme)Fe(IV)=O/Tyr·+ (Tyr cation radical) center, with a short Fe=O bond of 1.69 Å. One of the heme sites (heme A) in bisFe(IV) MauG is, therefore, similar to CCP-I. This has also been demonstrated by Mössbauer studies which show that the bisFe(IV) MauG species has two distinct hemes with δ1 = 0.06 mm/s, ΔEQ1 = 1.70 mm/s, and δ2 = 0.17, ΔEQ2 = 2.54 mm/s [7]. The isomer shifts, δ, indicate that both hemes are in the Fe(IV) state. The quadrupole splitting, ΔEQ, and comparative analysis with model complexes were used to identify a ferryl heme at one site, and a unique six-coordinate Fe(IV) electronic structure at the other.
A comparison of the Fe K-edge XAS data of CCP-I and the bisFe(IV) MauG sample shows that the two rising-edge energies are very similar—rising-edge half maxima for CCP-I and bisFe(IV) MauG occur at 7,124.5 and 7,124.6 eV, respectively (Fig. 6). This confirms that both Fe sites in the bisFe(IV) MauG sample are predominantly in the oxidized Fe(IV) state and thus are obtained at high yield: the presence of a significant amount of unconverted or decayed Fe(III) would either shift the rising edge to lower energies or result in shoulders on the rising edge.
Fig. 6.
The normalized Fe K-edge XAS spectrum of diferric MauG (red curve), bisFe(IV) MauG (black curve), and compound I of cytochrome c peroxidase (CCP-I; green curve). The inset shows the expanded pre-edge region
Quantitative estimate of bisFe(IV) MauG in the XAS sample
The Fe K near-edge and EXAFS data, in conjugation with the DFT calculations, indicate that the sample frozen at 60 s following H2O2 treatment of diferric MauG contains a significant amount of bisFe(IV) MauG. However, since the EXAFS data are insensitive to approximately 15 % contamination of other Fe species, a more quantitative method is used here, based on a combination of kinetics, Fe K-pre-edge intensities, and TD-DFT calculations.
A pseudo-first-order kinetic analysis was performed for the rate of formation of bisFe(IV) MauG. The expression for the rate of decrease of the concentration of diferric MauG is [MauG]0ekt ([MauG]0 is the initial concentration of MauG, k is the pseudo-first-order rate constant). The starting value for [MauG]0 is known (1.4 mM). To estimate the value of concentration of MauG at every time point, the conversion of diferric MauG to bisFe(IV) MauG at 60 s was set to four values between 70 and 100 %. For each of these four values, the concentration of MauG was calculated at the different time points and a pseudo-first-order fit was performed. The four fit curves are presented in Fig. S3, panel A and clearly show that the best fit is achieved only when 100 % conversion is considered at 60 s. This indicates near-complete conversion at 60 s. If 100 % conversion is considered and the starting value of [MauG]0 is allowed to float, the final fitted [MauG]0 is 1.38 mM, which is in good agreement with the actual [MauG]0 of 1.3–1.4 mM (Fig. S3, panel B). If there was any significant decay reaction at 60 s, the trace would consist of two exponentials (forward and decay), and the floated coefficient would not be in good agreement with the actual value.
The Fe K-pre-edge transition is an electric-dipole-forbidden and quadrupole-allowed transition, typically approximately 100 times weaker than the dipole-allowed 1s → 4p transition to higher energy that forms part of the rising edge. The pre-edge feature can gain intensity via metal 3d–4p mixing, due to distortion of the site from centrosymmetry. In a detailed semiquantitative study, Westre et al. [40] have shown that the pre-edge feature of Fe complexes with centrosymmetry (Oh and D4h systems) have an area of approximately 4 U, which corresponds to quadrupole-only character. Deviations from centrosymmetry (e.g., for Td or C4v systems) can result in significantly higher intensities. Intensities as high as approximately 45 U have been observed in Fe(IV)=O systems, and even higher intensities have been observed in Fe(IV)≡N systems (approximately 94 U) [37]. In these systems, the short Fe–ligand bond allows significant amounts of Fe 3d–4p mixing. This increase in intensity can be exploited to estimate the quantitative conversion of diferric MauG to the bisFe(IV) redox state.
Fe K-pre-edge data for CCP-I and bisFe(IV) MauG show that the pre-edge peak occurs at 7,113.4 eV for both species (Fig. 6), and is shifted to higher energy by approximately 0.7 eV relative to diferric MauG. In contrast, the intensity of the pre-edge feature is significantly diminished in bisFe(IV) MauG relative to CCP-I. Quantitation of the intensity under the Fe K pre-edge (using pseudo-Voigt peak fitting) shows that the pre-edge areas in diferric MauG, bisFe(IV) MauG, and CCP-I are 7.3, 13.2, and 19.2 U, respectively (Fig. S4).
The decrease in the pre-edge intensity of bisFe(IV) MauG relative to CCP-I is due to the presence of two heme sites, heme A and heme B, which contribute differently to the pre-edge. Heme A forms a high-valence Fe(IV)=O, a species that has been well studied using Fe K-edge XAS [17, 44, 50–52], whereas Fe 1s → 3d TD-DFT calculations have been shown to give good agreement with experimental energies and intensities in bioinorganic Fe model complexes [34, 37]. These spectroscopic and theoretical studies reveal that the short Fe(IV)=O bond leads to a strong C4v distortion along the z-axis, allowing Fe 4pz mixing into the 3dz2 orbital, and a corresponding significant increase in the pre-edge intensity. It has also been amply demonstrated that the pre-edge intensity has an inverse correlation with the metal–oxo bond distance [37, 52]. On the basis of the EXAFS data in this study, the short Fe=O bond distance in CCP-I is identical to that in bisFe(IV) MauG. Since both are six-coordinate species with axial N(His) ligation and similar Fe–N bond distances, they are expected to have very similar Fe K-pre-edge intensities, making CCP-I an ideal reference for the heme A site.
In contrast, no reference is available for the unique six-coordinate heme B of MauG in the Fe(IV) redox state. EXAFS data and DFT calculations presented here indicate that heme B is distorted from the Oh limit to a C4v structure, with the Fe–O(Tyr) distance approximately 0.14 Å shorter than the Fe–N(His) distance. This distortion from centrosymmetry will increase the Fe K-pre-edge intensity from the quadrupole limit of approximately 4 U. Depending on the severity of distortion, an Oh complex can have pre-edge intensity close to but lower than that of five-coordinate C4v complexes (based on published databases) [40–42]. Since diferric MauG contains both a distorted Oh site and a C4v site, their average intensity is higher than that of a pure distorted Oh complex, i.e., heme B site in bis-Fe(IV) MauG. Thus, in the absence of a suitable reference, the Fe K-pre-edge intensity of diferric MauG is used as an upper-limit reference for heme B. The average of the two intensities (diferric MauG and CCP-I) gives the upper limit expected for a pure bisFe(IV) MauG sample. Since the average value (13.3 U) is very close to that experimentally observed for the bisFe(IV) MauG sample, near complete conversion of diferric MauG to bisFe(IV) MauG is indicated.
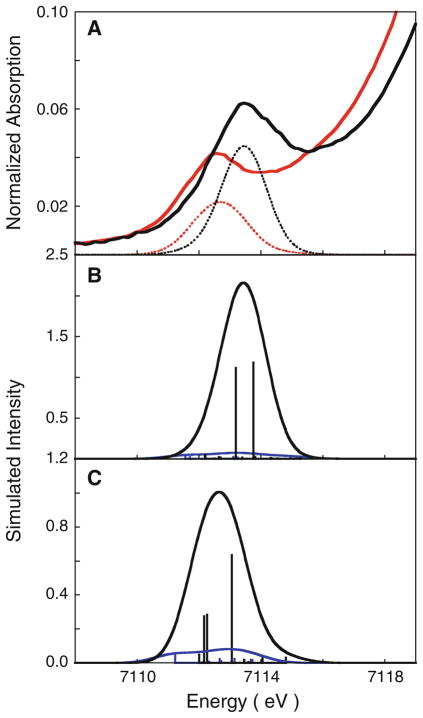
To support this estimation, TD-DFT was used to calculate the Fe 1s → 3d transition for both Fe sites in diferric and bisFe(IV) MauG. The calculated pre-edge spectra show good agreement with the experimental data, in terms of both relative energy position and intensities (Fig. 7, Table 2). This indicates that the theoretically calculated electronic structures reproduce the MauG hemes’ redox states with high fidelity. As expected for a six-coordinate site, the simulations reveal that the intensity contribution of the heme B site is significantly less than that of the heme A site in both diferric MauG (11 % of total intensity) and bisFe(IV) MauG (6 % of total intensity) (Figs. 7, panel C, 8, panel B, respectively). This indicates that the intensities of the pre-edges for both diferric and bisFe(IV) MauG have dominant contributions from the heme A site, and only minor contributions from heme B. To allow a meaningful comparison of experimental and calculated intensities, the TD-DFT intensity of CCP-I was set to that obtained from experiment (19.2), and the values for diferric and bisFe(IV) MauG were linearly scaled. The resulting intensities of heme A, heme B, and bisFe(IV) MauG (average of heme A and heme B sites) are 19.2, 1.3, and 10.3, respectively. These calculated numbers show that the predicted pre-edge intensity for bisFe(IV) MauG is actually lower than the experimental value. Accounting for the experimental error of 3 % in determining pre-edge intensities, we find that the calculated values are in excellent agreement with experiment.
Fig. 7.
A a comparison of the time-dependent density functional theory (DFT) simulated (dotted line) and experimental (solid line) spectra for diferric MauG (red curve) and bisFe(IV) MauG (black curve). Individual contributions from the heme A (black curve) and heme B (blue curve) sites for B bisFe(IV) MauG and C diferric MauG
Table 2.
Experimental and time-dependent density functional theory (TD-DFT) simulated Fe K-pre-edge energies and intensities
| Experimental
|
Simulated
|
Intensity
|
||||
|---|---|---|---|---|---|---|
| Energy (eV) | Intensitya | Energy (eV)b | Intensityc | Heme Ac | Heme Bc | |
| Diferric MauG | 7,112.6 | 7.3 | 7,112.7 | 5.7 | 10.3 | 1.2 |
| BisFe(IV) MauG | 7,113.4 | 13.2 | 7,113.4 | 10.3 | 19.2 | 1.3 |
| CCP-I | 7,113.4 | 19.2 | 7,113.4 | 19.2 | ||
TD-DFT calculations performed with ORCA
CCP-I compound I of cytochrome c peroxidase
Three percent error in experimental intensity estimation from normalization and pseudo-Voigt fitting
A constant energy shift of 181 eV was applied to the simulated energies
The simulated intensity of the Fe(IV)=O heme A site was normalized to the experimental value of CCP-I. All calculated intensities were scaled on this basis
Thus, a combination of Fe K-rising-edge energy position, pre-edge intensity and energy position, and TD-DFT calculations on both heme A and heme B sites shows that the H2O2-treated MauG sample frozen at 60 s is consistent with almost complete conversion of diferric MauG to bis-Fe(IV) MauG.
Fe K-edge EXAFS
The non-phase-shift-corrected Fourier transform spectra and the EXAFS regions for CCP-I and bisFe(IV) MauG were simulated using FEFF (Fig. 8). The first shell of CCP-I was fit with one short Fe–O contribution at 1.69 Å and five longer Fe–N/O contributions at 1.99 Å (Table S3). The second and third shells were fit with single- and multiple-scattering contributions from the porphyrin ring. The EXAFS fit is consistent with previously published EXAFS data and a recently published high-resolution crystal structure [18, 45].
Fig. 8.
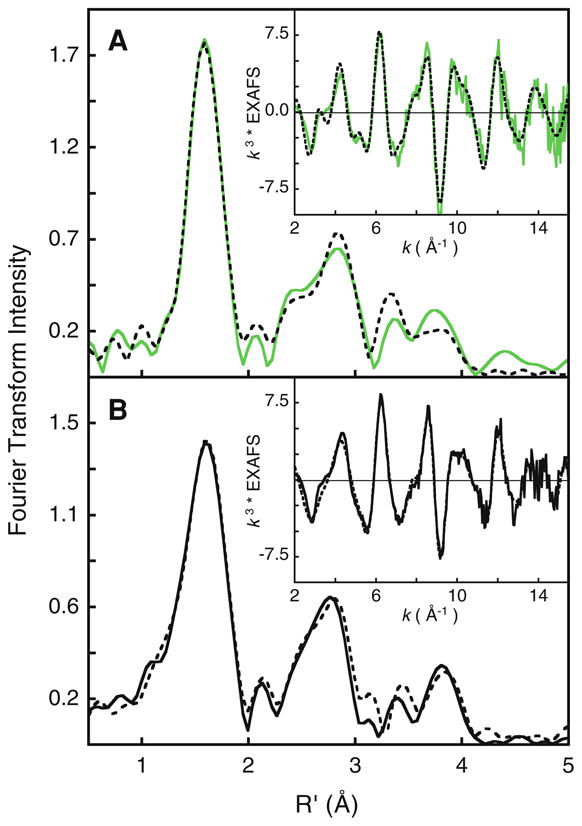
Non-phase-shift-corrected Fourier transform data and fits for A CCP-I (green curve data, broken curve fit) and B bisFe(IV) MauG sample (continuous curve, data), broken curve fit). The insets show the corresponding EXAFS regions
To obtain a good fit to the bisFe(IV) MauG EXAFS data, variable and half-integer coordination numbers were considered in addition to split-first-shell coordination (a similar data fitting protocol was employed for the diferrous and diferric MauG EXAFS data). The fits with the lowest F values are presented in Table 3 and Fig. 8, panel B. The first shell can be reasonably simulated using a single shell with 4.5 Fe–O/N contributions at 2.0 Å. However, a significant improvement is observed with a split-first-shell fit and inclusion of a half-integer Fe–O component at 1.69 Å. In this split-first-shell fit, the second shell is best fit with five Fe–N/O at 2.0 Å. The short Fe–O component accounts for the Fe(IV)=O at the heme A site, and is very similar to the short Fe(IV)=O distances observed in compound I species.
Table 3.
First-shell EXAFS least-squares fitting results for bisFe(IV) MauG
| First-shell optimization
|
Final fit
|
|||||||||
|---|---|---|---|---|---|---|---|---|---|---|
| Na | R (Å)b | σ2 (Å2)c | E0 | Fd | Na | R (Å)b | σ2 (Å2)c | E0 | Fd | |
| Fit 1 | 5e | 2.00 | 370 | 8.6 | 0.72 | 0.5 | 1.69 | 268 | 7.64 | 0.55 |
| – | – | – | 0.5 | 1.86 | 116 | |||||
| Fit 2 | 4.5 | 2.00 | 338 | 9.1 | 0.63 | 5 | 2.00 | 307 | ||
| – | – | – | 8 | 2.89 | 287 | |||||
| Fit 3 | 0.5 | 1.70 | 760 | 8.2 | 0.57 | 8 | 3.04 | /287f | ||
| 5 | 1.99 | 370 | 8 | 3.15 | /287f | |||||
| Fit 4 | 0.5 | 1.70 | 1,340 | 8.8 | 0.56 | 4 | 3.41 | 323 | ||
| 4.5 | 1.99 | 320 | 8 | 4.10 | 377 | |||||
| Fit 5 | 0.5 | 1.69 | 268 | 7.64 | 0.55 | 16 | 4.33 | /377f | ||
| 0.5 | 1.86 | 116 | ||||||||
| 5 | 2.00 | 307 | ||||||||
Coordination number
The estimated standard deviations for the distances are on the order of ± 0.02 Å
The σ2 values are multiplied by 105
Error (F) is given by Σ[(χobsd − χcalcd)2k6]/Σ[(χobsd)2k6]
Higher coordination numbers resulted in significantly worse fits
The slash before a parameter indicates that it is linked to the same parameter as its parent single-scattering path
As shown earlier, EXAFS data and DFT calculations of diferric MauG reveal a short Fe–O(Tyr) at the heme B site. This bond distance is expected to change (likely become shorter) upon oxidation of the ferric heme B to the Fe(IV) state. Guided by the presence of a short Fe–O(Tyr) at the heme B site in diferric MauG, split three shell fits were performed on bisFe(IV) MauG. The second short Fe–O distance was optimized to 1.86 Å. Note that, although the inclusion of this component leads to only a small improvement in the error value (F), the σ2 values of all three first shell paths lead to more realistic values for short Fe–O/N paths (Table 3). In addition, all the paths in the first shell are within the bond distance resolution dictated by the k range (π/2Δk ~ 0.12 Å).3 Thus, the final best-fit data for bisFe(IV) MauG indicate the presence of 0.5 Fe(IV)=O at 1.69 Å, 0.5 Fe–O(Tyr) at 1.86 Å, and five Fe–N at 2.0 Å.
Density functional theory
The geometric structure of bisFe(IV) MauG determined by Fe K-edge EXAFS was complemented with DFT calculations (Fig. 9). Models of S = 1 Fe(IV)=O heme A and S = 0, 1, and 2 heme B were generated from the crystal structure coordinates of resting state MauG in complex with preMADH. For the heme A site, the first shell is composed of a short Fe(IV)=O bond at 1.67 Å, an Fe–N(heme) at an average distance of 2.02 Å and an Fe–N(His) at 2.18 Å. For the heme B site, geometry optimizations performed for all three possible spin states (S = 0, 1 and 2) indicate that S = 1 is the lowest energy state, with the next lowest energy state, S = 0, 4.66 kcal/mol higher in energy. Thus, the S = 1 species was used in the calculations for heme B. The first shell is optimal with a short Fe–O(Tyr) at 1.85 Å, an Fe–N(heme) at an average distance of 2.00 Å, and an Fe–N(His) at 2.00 Å.
Fig. 9.
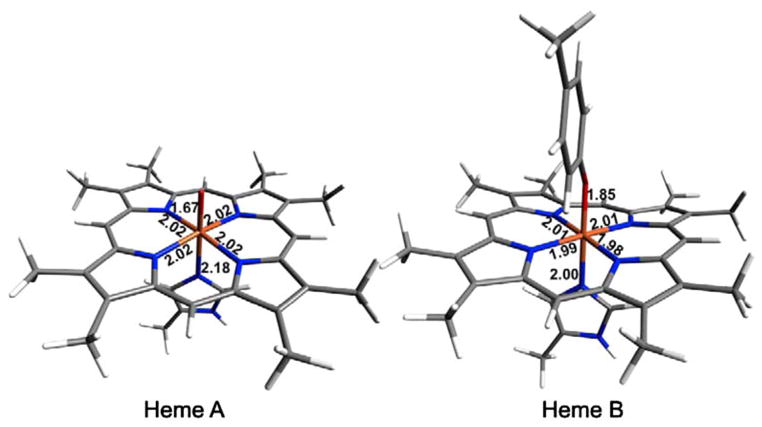
DFT geometry optimized structures of the two heme sites in bisFe(IV) MauG
The average EXAFS signal based on the DFT calculations would result in 0.5 Fe=O at 1.67 Å, 0.5 Fe–O(Tyr) at 1.85 Å, and five Fe–N at 2.03 Å. Thus, the theoretical bond distances are in good agreement with the best fit to the experimental EXAFS data, which are 0.5 Fe=O at 1.69 Å, 0.5 Fe–O(Tyr) at 1.86 Å, and five Fe–N at 2.0 Å (Table 3). Finally, since Fe(IV)=O heme A forms a ferryl species similar to that in CCP-I, the theoretical calculations on the heme A site are, as expected, also in good agreement with the EXAFS data for CCP-I (Table S3).
Electronic structure of bisFe(IV) MauG
This study has shown that the heme A active site and CCP-I have very similar geometric structures, and that the heme A site is consistent with a six-coordinate (heme)Fe(IV)=O complex with a transaxial Fe–N(His) ligand. The ground state energy level diagram, with orbital contour plot and Löwdin compositions, is shown in Fig. S5. The βLUMO (where “LUMO” is “lowest unoccupied molecular orbital”) is a degenerate set of π* orbitals composed of Fe 3dxz and 3dyz antibonding to O 2px and 2py orbitals, respectively. At higher energy is the 3dx2−y2 orbital, which is nonbonding with respect to the oxo group, but has σ overlap with the pyrrole N atoms of the porphyrin ring. The highest-energy 3d orbital is the 3dz2 orbital, which forms a strong σ antibonding interaction with the O 2pz orbital. The short Fe–O bond (1.69 Å) and the strong σ interaction with the O 2pz orbital lead to its destabilization relative to the Fe 3dx2−y2 orbital. This description is in good agreement with previously published theoretical descriptions of CCP-I (i.e., with a Tyr radical rather than a porphyrin cation radical) [53].
Quantitative generation of the Fe(IV) heme B XAS spectra was achieved by subtracting the heme A component (modeled by CCP-I) from bisFe(IV) MauG (Fig. S6). The rising-edge energy position for this unique six-coordinate Fe(IV) species is 7,124.7 eV, and is characteristic of Fe(IV) species. The modest increase in the rising-edge energy position relative to CCP-I (approximately 0.2 eV) is expected, since the Fe center in Fe(IV) heme B has a greater positive charge compared with that of Fe(IV)=O heme A. To shed further light on the electronic structure of Fe(IV) heme B, DFT-calculated Mulliken population analysis was performed on a simplified model of heme B (Fig. 10). In the stablest S = 1 description of Fe(IV) MauG, there are two α and four β 3d vacancies. The βLUMO and βLUMO+1 are closely spaced. The βLUMO (175) is predominantly on the Fe, with 68.4 % Fe dxy and 5.2 % O(Tyr), whereas the βLUMO+1 (176) has 42.4 % 3dyz and 47.1 % O(Tyr). The contribution of the O(Tyr) in this orbital is even higher than that of Fe 3dyz, indicating very strong overlap and charge donation from the tyrosinate moiety into the Fe site. A close look at the contour in Fig. 10 shows that there is no contribution of the porphyrin ring or the transaxial His in 175, indicating that this valence hole is localized over the Fe–O(Tyr) moiety, with dominant hole character on the Tyr ligand. To higher energy is the βLUMO+2 (180), which is composed of 63.1 % Fe 3dz2 in pseudo-σ and σ overlap with the Tyr O (11.7 %) and His N (12.0 %), respectively. The βLUMO+3 is composed of 64.3 % Fe 3dx2−y2 in strong σ overlap with the heme ring pyrrole N groups (35.4 %). This strong σ overlap leads to the destabilization of the Fe 3dx2−y2 orbital relative to other 3d orbitals. The αLUMO and αLUMO+1 are spin-up counterparts of βLUMO+2 and βLUMO+3, and have similar compositions (Fig. 10).
Fig. 10.
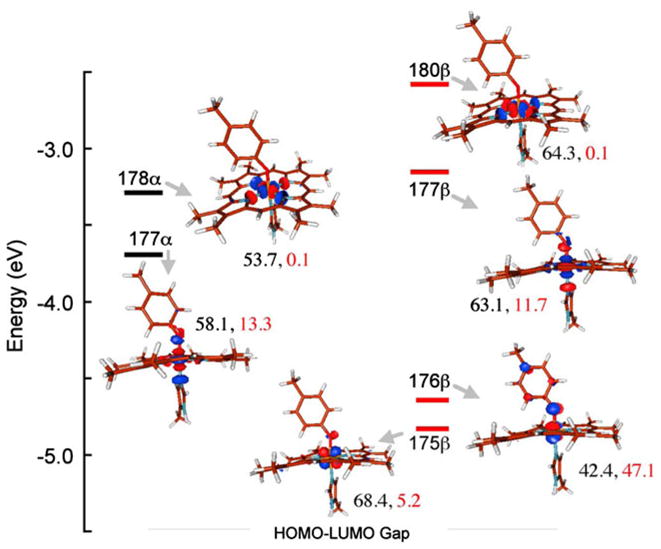
Valence energy level diagram obtained from geometry-optimized DFT calculations on the Fe(IV) S = 1 heme B. Contour plots were generated in Molden. The Fe (3d) and deprotonate Tyr contributions to the total Mulliken populations are shown next to each contour in black and red, respectively. HOMO highest occupied molecular orbital, LUMO lowest unoccupied molecular orbital
In summary, experiment and theory describe the Fe(IV) heme B species as a unique S = 1, six-coordinate species with His–Tyr axial coordination, and a short Fe–O(Tyr) bond distance at 1.87 Å. Mulliken population analyses show that one of the LUMOs has a strong Fe–O(Tyr) covalent interaction with the hole predominantly on the Tyr ligand.
Discussion
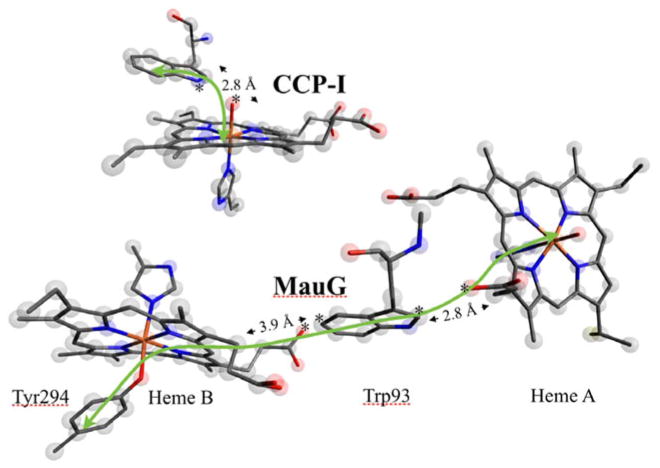
MauG is a unique diheme enzyme, and uses both hemes to complete TTQ synthesis. The catalytic oxidant of MauG is a bisFe(IV) species. A Mössbauer study established that the bisFe(IV) site contains an Fe(IV)=O and a six-coordinate Fe(IV) species; however, full electronic and geometric structure descriptions of this species have been elusive. The detailed Fe K-edge XAS and EXAFS investigation presented here bridges this gap via a combination of experimental data with DFT and TD-DFT methods, and by comparison with experimental data obtained from the well-studied CCP-I. Heme A of the bisFe(IV) state of MauG could be thought analogous to CCP-I, if one considers that the second Fe(IV) heme has the same effect as the Tyr radical. Alternatively, it could be considered similar to compound II without a radical in close proximity [54]. In fact it is neither, as hemes A and B compose a diheme system in which the properties of each heme affect those of the other. The heme A Fe(IV)=O is described as a six-coordinate, S = 1 species with a short Fe(IV)=O bond distance of 1.69 Å and a transaxial His ligand. In the high-valence oxidant compound I of many heme oxidases and oxygenases, an Fe(IV)=O species is accompanied by a porphyrin or amino acid radical species, giving an oxidant formally equivalent to Fe(V). In contrast, MauG stores the second oxidizing equivalent on heme B, which is oxidized to a unique six-coordinate Fe(IV) site (Fig. 11). The similarity between the (heme)Fe(IV)=O in CCP-I and the high-valence heme A site in MauG is demonstrated by the similarity in the Fe K-pre-edge energy positions and estimated intensities of the two sites. The structural parity between the two sites is demonstrated by the similarity in the first-shell bond distances obtained from Fe K-edge EXAFS analysis.
Fig. 11.
A comparison of the Fe(V)-equivalent intermediates in CCP-I and bisFe(IV) MauG. The second electron equivalent is on a Trp residue in CCP-I, whereas it is delocalized onto Tyr294. The green arrows point to the π pathway (heme A–Trp93–heme B–Tyr294) for electron transfer. The closest distances (the atoms between which the distances were measured have been marked with an asterisk) from the Trp rings to the heme centers are shown
In contrast, Fe(IV) heme B is an unprecedented species in biology that is shown to be a six-coordinate, S = 1 species with a short Fe–O(Tyr) bond distance and a covalent Fe–O(Tyr) bonding interaction. Experiment and theory show an interesting trend in the first-shell bond distances of heme B in the three different oxidation states; Fe(II), Fe(III), and Fe(IV). Whereas the Fe–N(heme) distances show almost no change across the series, a dramatic variation is observed in the Fe–O(Tyr) bond distance, which changes from 2.02 to 1.89 to 1.85 Å as the Fe is oxidized (Table 4). This significant shortening suggests that the effect of sequential oxidation is strongly localized to the Fe–O(Tyr) moiety. A relative energy level diagram corroborates this, as does comparison of the Mulliken spin populations of the frontier orbitals of heme B in the three sequential oxidation states and 4MP (used here as a deprotonated Tyr mimic) (Fig. 12, Table 4). The βHOMO (where “HOMO” is highest occupied molecular orbital”) and βHOMO-1 of 4MP are the occupied out-of-plane and inplane π frontier orbitals that participate in bonding with the Fe of heme B. In the ferrous state, the βHOMO and βHOMO-1 of 4MP overlap with the filled 3dxz and 3dyz orbitals of the Fe(II) in forming the βHOMO and βHOMO-1 of S = 1 ferrous heme B. The 3dz2 orbital has a pseudo-σ overlap with a hybrid tyrosinate orbital containing both in-plane and out-of-plane π character (βHOMO and βHOMO-1).
Table 4.
Select density functional theory parameters for MauG heme B
| Distance from Fe (Å)
|
Löwdin spin densitya
|
|||||
|---|---|---|---|---|---|---|
| Nporb | OTyr | NHis | Fe | Tyr | Por | |
| Fe(II) | 2.00 | 2.02 | 1.99 | 0 | 0 | 0 |
| Fe(III) | 2.01 | 1.89 | 2.02 | 0.92 | 0.11 | −0.08 |
| Fe(IV) | 2.00 | 1.85 | 1.99 | 1.34 | 0.50 | 0.01 |
| Valence Mulliken population analysisc (Fe, Tyr)
|
||||
|---|---|---|---|---|
| dxz | dyz | dz2 | dx2−y2 | |
| Fe(II) | – | – | 71.2, 9.7 | 58.7, 1.4 |
| – | – | 71.2, 9.7 | 58.7, 1.4 | |
| Fe(III) | – | – | 60.7, 18.0 | 63.8, 0.1 |
| – | 63.3, 13.0 | 63.6, 17.5 | 67.7, 0.2 | |
| Fe(IV) | – | – | 58.1, 13.3 | 53.7, 0.1 |
| 68.4, 5.2 | 42.4, 47.1 | 63.1, 11.7 | 64.3, 0.1 | |
Por octamethylporphyrin
The Löwdin spin density of NHis does not vary significantly and has been omitted
Average of equatorial Fe–Npor distances
For each oxidation state the α and β values are given in the first row and the second row, respectively
Fig. 12.
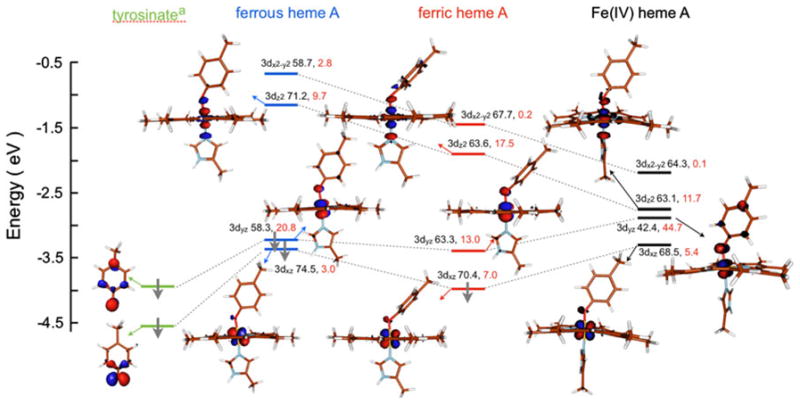
DFT-calculated valence β-spin energy-level diagram. Meth-ylphenolate was used as a deprotonated Tyr mimic. Contour plots were generated with Molden. Gray arrows indicate a spin-down electron. The dotted gray lines indicate the contribution of the two deprotonated Tyr ψHOMO in the valence levels of heme A in different oxidation states. The Fe (3d) and deprotonated Tyr contributions to the total Mulliken spin populations are shown next to each level in black and red, respectively. The highest-energy 3dx2−y2 orbital contour has been omitted for clarity. The valence α-spin counterparts of the 3dx2−y2 and 3dz2 orbitals are similar in composition to their β-spin counterparts
One-electron oxidation of ferrous heme B leads to shortening of the Fe–O(Tyr) bond, and removal of an electron from βHOMO, which becomes the βLUMO in ferric heme B. This orbital has 63.3 % Fe 3dyz contribution and a small contribution from the tyrosinate, indicating that the hole is predominantly metal-based. Upon going from ferric to Fe(IV) heme B, the Fe–O(Tyr) bond becomes even shorter (1.89–1.85 Å), and the βHOMO of ferric heme B, composed of Fe 3dxz and the in-plane βHOMO-1 of 4MP, loses an electron and becomes the βLUMO. This oxidation leads to strong charge donation from the βHOMO of the tyrosinate into the βLUMO+1 of Fe(IV) heme B. This charge flow from the tyrosinate to the Fe center leads to a significant decrease of Fe character in the 3dyz valence orbital, and counters the build up of positive charge on the Fe center (due to the hole created in the 3dxz orbital). No significant change is observed in the contribution of the porphyrin or N(His) ligand. This means that upon oxidation of ferric heme B to Fe(IV), the hole is dominantly associated with the Fe–tyrosinate moiety. To further test this theory, Löwdin spin densities were calculated for each oxidation state of heme B. Upon going from ferrous to ferric heme B, the spin densities at Fe and Tyr increase from 0 to 0.9 and from 0 to 0.1, respectively, indicating that the oxidation is largely Fe-based, with a small amount of delocalization into the O(Tyr) ligand. On going from ferric to Fe(IV) heme B, the spin densities at Fe and Tyr increase from 0.9 to 1.3 and from 0.1 to 0.5, respectively, indicating an almost equal increase in spin density at the Fe and Tyr moieties. This supports the hypothesis that the Tyr ligand may be noninnocent in the oxidation of heme B from the ferric to the Fe(IV) state, and stabilizes the high-valence species by hole delocalization into its low-lying π-type orbitals. DFT calculations were also performed using the B3LYP functional to test if the spin polarization on the Fe and O(Tyr) was reproduced using a hybrid functional [a pure functional was otherwise used in this study, since it has been shown to reproduce better the experimental spectra and gives a more accurate geometry for the Fe(IV) site in heme A and CCP-I]. The calculations show that the spin density increases on the O(Tyr) (to 0.83 from 0.53 using BP86) and decreases on the Fe (to 1.18 from 1.32 using BP86) and on the heme (to 0.0 from 0.1 using BP86). This increase could be due to redistribution of the covalent delocalization between the Fe and heme and the Fe and O(Tyr) leading to changes in spin distribution. Nonetheless the hybrid functional also indicates spin density on the O(Tyr), indicating hole character and its noninnocent role in the formation of Fe(IV) heme B.
This idea of charge delocalization into the Tyr moiety is supported by a recent theoretical study by Ling et al. [55], who calculated the unusual Mössbauer parameters of the MauG bisFe(IV) redox state. They found that the calculated ΔEQ and δFe were in good agreement with experimental data for both heme A and heme B. However, the spin density on the heme B Fe was much lower than expected for an S = 1 species, which is consistent with the Fe–Tyr charge delocalization indicated by this study. Note that the covalent Fe(IV)–O(Tyr) with strong delocalization into the O(Tyr) ligand description that is relevant here is distinct from an Fe(III)–O(Tyr)· description. First, the XAS data clearly show that the Fe at heme B is in the Fe(IV) state, and second, DFT calculations show a strong covalent interaction between Fe and O(Tyr), indicating charge delocalization over the Fe–O(Tyr) residue. In the case of a true Fe(III)–O(Tyr)· system, the Fe–O bond would be weaker relative to the Fe(III)–O(Tyr) bond (i.e., ferric heme B) and the covalent interaction would be limited. We recently demonstrated the functional importance of the Tyr (Tyr294) residue by studying the catalytic properties of the Y294H mutant, in which the ligated Tyr has been replaced by a ligated His [9]. Results show that although Y294H can bind to preMADH and participate in interprotein electron transfer, it is unable to catalyze TTQ biosynthesis. In the mutant, a compound I like intermediate is formed at heme A, instead of the bisFe(IV) species. This highlights the importance of the heme B site in the catalytic formation of TTQ. Since heme B is closer to the preTTQ site in pre-MADH, the bisFe(IV) state shortens the distance for long-range electron transfer from the preMADH site (Fig. 1). The EXAFS data presented here experimentally demonstrate the active role Tyr has in the formation of the Fe(IV) at the six-coordinate heme B site. As shown by DFT calculations, the stability of the Fe(IV) is critically dependent on spin delocalization over the Fe–O(Tyr) moiety, which counters unstable charge build up on the Fe center. His would not be expected to support such facile electron delocalization, and consequently a bisHis Fe(IV) heme species is unstable, explaining why the Y294H MauG does not form a bisFe(IV) redox state following addition of H2O2, but instead forms a compound I like species.
Supplementary Material
Acknowledgments
Portions of this research were performed at the Stanford Synchrotron Radiation Lightsource (SSRL), a Directorate of SLAC National Accelerator Laboratory and an Office of Science User Facility operated for the US Department of Energy Office of Science by Stanford University. The SSRL Structural Molecular Biology Program is supported by the Department of Energy Office of Biological and Environmental Research, and by the National Institutes of Health, the National Institute of General Medical Sciences (including P41GM103393), and the National Center for Research Resources (P41RR001209). C.M.W., V.L.D., and T.L.P were supported by the National Institutes of Health grants GM66569, GM41574, and GM42614, respectively.
Abbreviations
- CCP
Cytochrome c peroxidase
- CCP-I
Compound I of cytochrome c peroxidase
- DFT
Density functional theory
- EXAFS
Extended X-ray absorption fine structure
- HOMO
Highest occupied molecular orbital
- LUMO
Lowest unoccupied molecular orbital
- MADH
Methylamine dehydrogenase
- 4MP
4-Methylphenolate
- TD-DFT
Time-dependent density functional theory
- TTQ
Tryptophan tryptophylquinone
- XAS
X-ray absorption spectroscopy
Footnotes
A first shell with four Fe–N/O components has a slightly better F value, but the 4.5 Fe–N/O fit is more consistent with the crystal structure.
This short distance is consistent with Fe–O distances (1.83–1.94 Å) obtained from a small-molecule database on related species.
Resolution is the separation at which two different metal–ligand paths can be distinguished.
Electronic supplementary material The online version of this article (doi:10.1007/s00775-012-0939-3) contains supplementary material, which is available to authorized users.
Contributor Information
Lyndal M. R. Jensen, Department of Biochemistry, Molecular Biology and Biophysics, University of Minnesota, Minneapolis, MN 55455, USA
Yergalem T. Meharenna, Departments of Molecular Biology and Biochemistry, Chemistry, and Pharmaceutical Sciences, University of California, Irvine, CA 92697, USA
Victor L. Davidson, Burnett School of Biomedical Sciences, College of Medicine, University of Central Florida, Orlando, FL 32827, USA
Thomas L. Poulos, Departments of Molecular Biology and Biochemistry, Chemistry, and Pharmaceutical Sciences, University of California, Irvine, CA 92697, USA
Britt Hedman, Stanford Synchrotron Radiation Lightsource, SLAC National Accelerator Laboratory, Menlo Park, CA 94025, USA.
Carrie M. Wilmot, Email: wilmo004@umn.edu, Department of Biochemistry, Molecular Biology and Biophysics, University of Minnesota, Minneapolis, MN 55455, USA.
Ritimukta Sarangi, Email: ritis@slac.stanford.edu, Stanford Synchrotron Radiation Lightsource, SLAC National Accelerator Laboratory, Menlo Park, CA 94025, USA.
References
- 1.Wang Y, Graichen ME, Liu A, Pearson AR, Wilmot CM, Davidson VL. Biochemistry. 2003;42:7318–7325. doi: 10.1021/bi034243q. [DOI] [PubMed] [Google Scholar]
- 2.McIntire WS, Wemmer DE, Chistoserdov A, Lidstrom ME. Science. 1991;252:817–824. doi: 10.1126/science.2028257. [DOI] [PubMed] [Google Scholar]
- 3.Davidson VL. Biochim Biophys Acta. 2003;1647:230–233. doi: 10.1016/s1570-9639(03)00056-6. [DOI] [PubMed] [Google Scholar]
- 4.Li X, Jones LH, Pearson AR, Wilmot CM, Davidson VL. Biochemistry. 2006;45:13276–13283. doi: 10.1021/bi061497d. [DOI] [PubMed] [Google Scholar]
- 5.Pearson AR, De La Mora-Rey T, Graichen ME, Wang Y, Jones LH, Marimanikkupam S, Agger SA, Grimsrud PA, Davidson VL, Wilmot CM. Biochemistry. 2004;43:5494–5502. doi: 10.1021/bi049863l. [DOI] [PubMed] [Google Scholar]
- 6.Wang Y, Li X, Jones LH, Pearson AR, Wilmot CM, Davidson VL. J Am Chem Soc. 2005;127:8258–8259. doi: 10.1021/ja051734k. [DOI] [PubMed] [Google Scholar]
- 7.Li X, Fu R, Lee S, Krebs C, Davidson VL, Liu A. Proc Natl Acad Sci USA. 2008;105:8597–8600. doi: 10.1073/pnas.0801643105. [DOI] [PMC free article] [PubMed] [Google Scholar]
- 8.Jensen LMR, Sanishvili R, Davidson VL, Wilmot CM. Science. 2010;327:1392–1394. doi: 10.1126/science.1182492. [DOI] [PMC free article] [PubMed] [Google Scholar]
- 9.Abu Tarboush N, Jensen LMR, Feng ML, Tachikawa H, Wilmot CM, Davidson VL. Biochemistry. 2010;49:9783–9791. doi: 10.1021/bi101254p. [DOI] [PMC free article] [PubMed] [Google Scholar]
- 10.Li X, Feng M, Wang Y, Tachikawa H, Davidson VL. Biochemistry. 2006;45:821–828. doi: 10.1021/bi052000n. [DOI] [PMC free article] [PubMed] [Google Scholar]
- 11.Lee S, Shin S, Li X, Davidson V. Biochemistry. 2009;48(11):2442–2447. doi: 10.1021/bi802166c. [DOI] [PMC free article] [PubMed] [Google Scholar]
- 12.Makris TM, von Koenig K, Schlichting I, Sligar SG. J Inorg Biochem. 2006;100:507–518. doi: 10.1016/j.jinorgbio.2006.01.025. [DOI] [PubMed] [Google Scholar]
- 13.Rittle J, Green MT. Science. 2010;330:933–937. doi: 10.1126/science.1193478. [DOI] [PubMed] [Google Scholar]
- 14.Poulos TL, Raag R. FASEB J. 1992;6:674–679. doi: 10.1096/fasebj.6.2.1537455. [DOI] [PubMed] [Google Scholar]
- 15.Riggs-Gelasco PJ, Price JC, Guyer RB, Brehm JH, Barr EW, Bollinger JM, Krebs C. J Am Chem Soc. 2004;126:8108–8109. doi: 10.1021/ja048255q. [DOI] [PubMed] [Google Scholar]
- 16.Shu LJ, Nesheim JC, Kauffmann K, Munck E, Lipscomb JD, Que L. Science. 1997;275:515–518. doi: 10.1126/science.275.5299.515. [DOI] [PubMed] [Google Scholar]
- 17.Stone KL, Behan RK, Green MT. Proc Natl Acad Sci USA. 2005;102:16563–16565. doi: 10.1073/pnas.0507069102. [DOI] [PMC free article] [PubMed] [Google Scholar]
- 18.Meharenna YT, Doukov T, Li H, Soltis SM, Poulos TL. Biochemistry. 2010;49:2984–2986. doi: 10.1021/bi100238r. [DOI] [PMC free article] [PubMed] [Google Scholar]
- 19.Tenderholt A. PySpline. 2005 http://pyspline.sourceforge.net/
- 20.George GN. EDG_FIT. 2000. [Google Scholar]
- 21.de Leon JM, Rehr JJ, Zabinsky SI, Albers RC. Phys Rev B. 1991;44:4146–4156. doi: 10.1103/physrevb.44.4146. [DOI] [PubMed] [Google Scholar]
- 22.Rehr JJ, Albers RC. Rev Mod Phys. 2000;72:621–654. [Google Scholar]
- 23.Rehr JJ, Deleon JM, Zabinsky SI, Albers RC. J Am Chem Soc. 1991;113:5135–5140. [Google Scholar]
- 24.Zabinsky SI, Rehr JJ, Ankudinov A, Albers RC, Eller MJ. Phys Rev B. 1995;52:2995–3009. doi: 10.1103/physrevb.52.2995. [DOI] [PubMed] [Google Scholar]
- 25.Neese F. ORCA, version 2.6.35. 2008. [Google Scholar]
- 26.Neese F, Olbrich G. Chem Phys Lett. 2002;362:170–178. [Google Scholar]
- 27.Becke AD. Phys Rev A. 1988;38:3098–3100. doi: 10.1103/physreva.38.3098. [DOI] [PubMed] [Google Scholar]
- 28.Becke AD. J Chem Phys. 1993;98:5648–5652. [Google Scholar]
- 29.Perdew JP. Phys Rev B. 1986;33:8822–8824. doi: 10.1103/physrevb.33.8822. [DOI] [PubMed] [Google Scholar]
- 30.Sinnecker S, Slep LD, Bill E, Neese F. Inorg Chem. 2005;44:2245–2254. doi: 10.1021/ic048609e. [DOI] [PubMed] [Google Scholar]
- 31.Schafer A, Horn H, Ahlrichs R. J Chem Phys. 1992;97:2571–2577. [Google Scholar]
- 32.Schafer A, Huber C, Ahlrichs R. J Chem Phys. 1994;100:5829–5835. [Google Scholar]
- 33.George SD, Neese F. Inorg Chem. 2010;49:1849–1853. doi: 10.1021/ic902202s. [DOI] [PubMed] [Google Scholar]
- 34.George SD, Petrenko T, Neese F. J Phys Chem A. 2008;112:12936–12943. doi: 10.1021/jp803174m. [DOI] [PubMed] [Google Scholar]
- 35.Schaftenaar G, Noordik JH. J Comput Aided Mol Des. 2000;14:123–134. doi: 10.1023/a:1008193805436. [DOI] [PubMed] [Google Scholar]
- 36.Tenderholt A. QMForge. 2005 http://qmforge.sourceforge.net/
- 37.Chandrasekaran P, Stieber SCE, Collins TJ, Que L, Neese F, DeBeer S. Dalton Trans. 2011;40:11070–11079. doi: 10.1039/c1dt11331c. [DOI] [PMC free article] [PubMed] [Google Scholar]
- 38.Hahn JE, Scott RA, Hodgson KO, Doniach S, Desjardins SR, Solomon EI. Chem Phys Lett. 1982;88:595–598. [Google Scholar]
- 39.Shulman RG, Yafet Y, Eisenberger P, Blumberg WE. Proc Natl Acad Sci USA. 1976;73:1384–1388. doi: 10.1073/pnas.73.5.1384. [DOI] [PMC free article] [PubMed] [Google Scholar]
- 40.Westre TE, Kennepohl P, DeWitt JG, Hedman B, Hodgson KO, Solomon EI. J Am Chem Soc. 1997;119:6297–6314. [Google Scholar]
- 41.Randall CR, Shu LJ, Chiou YM, Hagen KS, Ito M, Kitajima N, Lachicotte RJ, Zang Y, Que L. Inorg Chem. 1995;34:1036–1039. [Google Scholar]
- 42.Roe AL, Schneider DJ, Mayer RJ, Pyrz JW, Widom J, Que L. J Am Chem Soc. 1984;106:1676–1681. [Google Scholar]
- 43.Anderson LA, Dawson JH. Struct Bonding. 1990;74:1–40. [Google Scholar]
- 44.Cho J, Jeon S, Wilson SA, Liu LV, Kang EA, Braymer JJ, Lim MH, Hedman B, Hodgson KO, Valentine JS, Solomon EI, Nam W. Nature. 2011;478:502–505. doi: 10.1038/nature10535. [DOI] [PMC free article] [PubMed] [Google Scholar]
- 45.Chance M, Powers L, Poulos T, Chance B. Biochemistry. 1986;25:1266–1270. doi: 10.1021/bi00354a011. [DOI] [PubMed] [Google Scholar]
- 46.Goodin DB, Mcree DE. Biochemistry. 1993;32:3313–3324. [PubMed] [Google Scholar]
- 47.Houseman ALP, Doan PE, Goodin DB, Hoffman BM. Biochemistry. 1993;32:4430–4443. doi: 10.1021/bi00067a036. [DOI] [PubMed] [Google Scholar]
- 48.Pfister TD, Gengenbach AJ, Syn S, Lu Y. Biochemistry. 2001;40:14942–14951. doi: 10.1021/bi011400h. [DOI] [PubMed] [Google Scholar]
- 49.Sivaraja M, Goodin DB, Smith M, Hoffman BM. Science. 1989;245:738–740. doi: 10.1126/science.2549632. [DOI] [PubMed] [Google Scholar]
- 50.England J, Martinho M, Farquhar ER, Frisch JR, Bominaar EL, Munck E, Que L. Angew Chem Int Ed. 2009;48:3622–3626. doi: 10.1002/anie.200900863. [DOI] [PMC free article] [PubMed] [Google Scholar]
- 51.Fujimori DG, Barr EW, Matthews ML, Koch GM, Yonce JR, Walsh CT, Bollinger JM, Krebs C, Riggs-Gelasco PJ. J Am Chem Soc. 2007;129:13408–13409. doi: 10.1021/ja076454e. [DOI] [PubMed] [Google Scholar]
- 52.Jackson TA, Rohde JU, Seo MS, Sastri CV, DeHont R, Stubna A, Ohta T, Kitagawa T, Munck E, Nam W, Que L. J Am Chem Soc. 2008;130:12394–12407. doi: 10.1021/ja8022576. [DOI] [PMC free article] [PubMed] [Google Scholar]
- 53.Hersleth HP, Ryde U, Rydberg P, Gorbitz CH, Andersson KK. J Inorg Biochem. 2006;100:460–476. doi: 10.1016/j.jinorgbio.2006.01.018. [DOI] [PubMed] [Google Scholar]
- 54.Gumiero A, Metcalfe CL, Pearson AR, Raven EL, Moody PC. J Biol Chem. 2011;286:1260–1268. doi: 10.1074/jbc.M110.183483. [DOI] [PMC free article] [PubMed] [Google Scholar]
- 55.Ling Y, Davidson VL, Zhang Y. J Phys Chem Lett. 2010;1:2936–2939. doi: 10.1021/jz101159x. [DOI] [PMC free article] [PubMed] [Google Scholar]
Associated Data
This section collects any data citations, data availability statements, or supplementary materials included in this article.


