

INTRODUCTION
Spontaneous intracerebral hemorrhage (ICH) is the most fatal form of stroke, with one-month morality rates often exceeding 40% and rates of death or severe disability exceeding 75%.1,2 Nearly twenty years ago, the first observational studies demonstrated that hematoma volume on presentation was among the most potent predictors of survival and functional outcome.3 Subsequent studies identified the frequent occurrence of hematoma expansion after the initial CT scan.4 Occurring in up to 40% of patients, this expansion further contributes to poor outcome.5,6 These observations have made the arrest of expansion the most common target for acute clinical trials in ICH.7-9
Thus far, the specific targeting of hematoma expansion in clinical trials has yet to yield improvement in clinical outcome. This may be due to difficulty in identifying those individuals most likely to benefit from the intervention, those who will suffer hematoma expansion. Risk factors for expansion include early presentation, baseline hematoma volume, and warfarin use.4,10,11 Even among patients presenting within 3 hours, however, expansion severe enough to cause clinical deterioration occurs in no more than 40%.4,6-8 The CT Angiography (CTA) ‘spot sign’ has emerged in recent years as a potent predictor of hematoma expansion, and a potential tool in guiding therapies in both research and clinical care.
CT ANGIOGRAPHY SPOT SIGN
Definition
First described in 199912, the CTA spot sign has evolved in its definition from the broader concept of contrast extravasation, comprising ‘high-density material’ or ‘contrast leakage within the hematoma’12-14, to encompass ‘foci of enhancement within the hematoma’ on CTA source images15. While definitions of the spot sign used in individual studies continue to vary, all are variations on this standard (Table 1). In 2009 a spot sign score was developed, incorporating the number, maximum attenuation (in Hounsfield units), and maximum dimension of spot sign(s) (Figure).19 Currently, the term ‘contrast extravasation’ is reserved for the presence of contrast within the hematoma on post-contrast CT.16,17 This terminology can be confusing because the spot sign is thought to represent contrast extravasation (contrast ‘leakage’ from the vessels into the hematoma), whereas the neuroimaging definition of contrast extravasation is used to describe the presence of contrast on a post-contrast CT. In this review we use the term ‘spot sign’ when referring to CTA source images and ‘contrast extravasation’ when discussing post-contrast CTs.
Table 1. Study definitions CT angiography contrast extravasation and spot sign.
| Study | Year | Spot sign definition | |
|---|---|---|---|
| Contrast extravasation |
Becker et al.12 | 1999 | Visualization of high-density contrast within the clot or ventricular system. |
| Murai et al.13 | 1999 | Leakage of contrast medium seen as a high-density area on helical CT images. | |
| Goldstein et al.14 | 2007 | The presence of high-density material within the hematoma. | |
| Ederies et al.16 | 2009 | The presence of contrast puddling within the hematoma on the post-contrast CT. | |
| Hallevi et al.17 | 2010 | A hyperdensity (relative to the hematoma) within the hematoma on the post-contrast CT. | |
| Spot sign | Wada et al.15 | 2007 | Foci of enhancement within the hematoma on CTA source images. |
| Kim et al.18 | 2008 | High-attenuation contrast material within the hematoma. | |
| Delgado Almandoz et al.19,20 |
2009 and 2010 |
(1) ≥1 focus of contrast pooling within the ICH; (2) with an attenuation ≥120 Hounsfield units (HU); (3) discontinuous from normal or abnormal vasculature adjacent to the ICH; and (4) of any size and morphology. |
|
| Thompson et al.21 | 2009 | Spot-like and/or serpiginous foci of enhancement, within the margin of a parenchymal hematoma without connection to outside vessels, greater than 1.5 mm, and a Hounsfield unit density at least double that of background hematoma density. |
|
| Ederies et al.16 | 2009 | Based on Wada et al. (2007) | |
| Hallevi et al.17 | 2010 | A hyperdense spot within the hematoma that was unrelated to a blood vessel. | |
| Wang et al.22 | 2011 | Based on Wada et al. (2007) | |
| Li et al.23 | 2011 | Based on Delgado Almandoz et al. (2009 and 2010) | |
| Demchuk et al.24 | 2012 | One or more foci of contrast enhancement within an acute primary parenchymal haematoma visible on the source images of CTA (similar to Wada et al. [2007]). |
Figure. Examples of different spot sign scores.
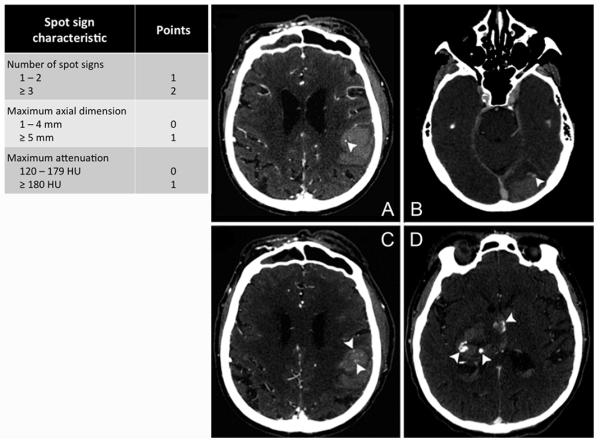
CT angiography of acute intracerebral hemorrhage representing different spot sign scores. (A) One spot sign with a maximal attenuation of 168 Hounsfield units (spot sign score 1). (B) Single spot sign with a maximal attenuation of 131 Hounsfield units and a diameter of 5 millimeter (spot sign score 2). (C) Multiple spot signs of which one with a maximal attenuation of 186 Hounsfield units (spot sign score 3). (D) Multiple spot signs with maximal attenuations of >200 Hounsfield units and two spots with a maximal diameter of >5 millimeter (spot sign score 4).
Imaging Acquisition
The identification of spot signs is dependent on technical imaging parameters of the CTA and may vary across institutions since CTAs are performed to visualize the cerebral vasculature. Delayed images collected after the initial study has been completed (normally obtained between approximately 40 seconds and 3 minutes after contrast injection), can yield spot signs not visualized on the initial CTA.19,20 Studies have shown that contrast extravasation on post-contrast CT also increases the sensitivity of the spot sign in predicting hematoma expansion.16,17 However, both delayed CTAs and post-contrast CTs are not routinely obtained at many institutions. Other parameters of the CTA technique also influence the detection and sensitivity of the spot sign; including the concentration of the contrast agent used and the speed of individual CT scanners. Technical refinement and standardization of CTA acquisition protocols may therefore be critical to further improve the accuracy of the spot sign.
Frequency
Variations in technique and the differences in definition probably account for the range of spot sign frequencies reported in the literature. The broader definition of contrast extravasation is associated with a higher frequency of 42% (139 out of 329 pooled patients; range from 18 to 59%), compared to 24% (426 out of 1802 pooled patients; range from 18 to 41%) for the stricter spot sign definition (Tables 2 - 4). Another factor with substantial impact on the frequency with which the spot sign is observed is the time elapsed between symptom onset and CTA. As the time from symptom onset to initial CTA increases, the frequency of spot sign appearance decreases.12,18-20 Since only a few studies have examined the frequency of the spot sign in ICH patients whose initial CTA is performed beyond 6 hours of symptom onset, further research is warranted on the accuracy of the spot sign in this extended time window.
Table 2. CT angiography contrast extravasation and hematoma expansion.
| Primary outcome | Hematoma expansion | |||
|---|---|---|---|---|
| Authors (year) |
Murai et al. (1999)13 * |
Goldstein et al. (2007)14 * |
Ederies et al. (2009)16 ** |
Hallevi et al. (2010)17 ** |
| Study design | Prospective | Retrospective | Retrospective | Prospective |
| Number of patients | 24 | 104 | 61 | 27 |
|
Number of patients with contrast extravasation (%) |
5 (21) | 58 (56) | 11 (18) | 13 (59) |
| Time window | <12 hours from symptom onset |
All patients | <6 hours from symptom onset |
<4 hours from symptom onset |
|
Hematoma expansion definition |
>15 mL increase from baseline ICH volume |
>33% increase from baseline ICH volume |
> 30% or >6 mL increase from baseline ICH volume |
>20% increase from baseline ICH volume |
| Expansion (%) | 3 (14) | 14 (14) | 18 (30) | 16 (57) |
|
Point estimate multivariate analysis (95% CI) |
n/a | OR 18 (2.1 - 162) |
n/a | OR 77 (4 – 1476) |
| Sensitivity | 1.00 | 0.93 | 0.94 | 1.00 |
| Specificity | 0.90 | 0.50 | 0.79 | 1.00 |
| PPV | 0.60 | 0.22 | 0.65 | 1.00 |
| NPV | 1.00 | 0.98 | 0.97 | 1.00 |
| Accuracy | 0.92 | 0.56 | 0.84 | 1.00 |
These two studies examined contrast extravasation, so accuracy measures refer solely to contrast extravasation.
For these two studies, accuracy refers to presence either of a spot sign on CTA source images or any contrast extravasation on post-contrast CT images.
ICH = intracerebral hemorrhage; 95% CI = 95% confidence interval; n/a = not available; OR = odds ratio; PPV = positive predictive value; NPV = negative predictive value
Table 4. CT angiography spot sign and clinical outcome.
| Primary outcome | Clinical outcome and mortality | ||||||
|---|---|---|---|---|---|---|---|
| Authors (year) |
Becker et al. (1999)12 * |
Goldstein et al. (2007)14 * |
Wada et al. (2007)15 |
Kim et al. (2008)18 |
Delgado
Almandoz et al. (2010) 20 |
Li et al.
(2011) 23 |
Demchuk
(2012) 24 |
| Study design | Retrospective | Retrospective | Prospective | Retrospective | Retrospective | Prospective | Prospective |
| Number of patients | 113 | 104 | 39 | 56 | 573 | 139 | 211 |
|
Number of spot positive patients (%) |
52 (46) | 58 (56) | 13 (33) | 10 (18) | 133 (23) | 30 (22) | 53 (25) |
| Time window | All patients | All patients | <3 hours from symptom onset |
All patients | All patients | <6 hours from symptom onset |
<6 hours from symptom onset |
|
Functional outcome measure |
In-hospital mortality |
In-hospital mortality |
In-hospital mortality and 3-month mRS |
30-day mortality |
In-hospital mortality and 3-month mRS |
3-month poor outcome |
3-month mortality and 3-month mRS |
| Overall mortality (%) | 43 (38) | 26 (25) | 7 (28) | 16 (29) | 180 (31) | 72 (52) | 54 (26) |
|
Point estimate multivariate analysis (95% CI) |
OR 5.2 (1.60 - 17.1) |
n/a | n/a | OR 4.7 (1.3 - 16.9) |
OR 1.5 (1.2 - 1.9) OR 1.6 (1.1 - 2.1) |
OR 10.5 (3.2 - 34.7) |
HR 2.4 (1.4 - 4.0) mRS 5 vs. 3 |
| Sensitivity | 0.77 | 0.73 | 0.43 | 0.50 | 0.41 | 0.36 | 0.43 |
| Specificity | 0.73 | 0.50 | 0.69 | 0.83 | 0.85 | 0.94 | 0.81 |
| PPV | 0.63 | 0.33 | 0.23 | 0.53 | 0.56 | 0.87 | 0.43 |
| NPV | 0.84 | 0.85 | 0.85 | 0.80 | 0.76 | 0.58 | 0.80 |
| Accuracy | 0.74 | 0.56 | 0.64 | 0.73 | 0.71 | 0.64 | 0.71 |
Studies used a definition of contrast extravasation instead of spot sign.
mRS = modified Rankin Scale; 95% CI = 95% confidence interval; OR = odds ratio; n/a = not available; HR = hazard ratio; PPV = positive predictive value; NPV = negative predictive value
Pathophysiology
Although generally assumed to reflect continued bleeding from a ruptured vessel or vessels, very little is known of biological underpinnings of the spot sign. One study showed the spot sign to be associated with faster rates of contrast leakage measured as perfusion CT derived permeability, emphasizing the theory of continued bleeding.25 In addition, warfarin exposure has been associated with both the presence of a spot sign19,20,26, as well as the number of spot signs on CTA15. The association of the apolipoprotein E (APOE) ε2 allele with hematoma expansion and the spot sign in patients with ICH in the lobar brain regions26,27 suggests a model of cascading small vessel injury following ICH as first described by Fisher.28 In this model, expansion of the initial hematoma is caused by the rupture of small adjacent vessels surrounding the hematoma.27
Risk Factors
Several (clinical) risk factors for the spot sign have been identified. In addition to early presentation, anticoagulation, and APOE ε2 - large baseline hematoma volume, low GCS score upon presentation, mean arterial blood pressure of >120 mm Hg, and the presence of intraventricular hemorrhage have been associated with risk of spot sign.12,14,19,20
CLINICAL APPLICATIONS
Hematoma Expansion
Multiple retrospective single-center cohort studies have confirmed that contrast extravasation and the spot sign are potent, independent predictors of hematoma expansion (Tables 2 and 3). In addition, a single study has shown that a higher spot sign score is associated with risk of subsequent hematoma expansion.19 Of note, definitions of hematoma expansion vary across studies, but different definitions have all been robustly associated with poor outcome.6 Recently, the multi-center prospective PREDICT study confirmed these findings and showed a strong association (RR 2.3 [95% CI 1.6 – 3.1]) between spot sign and development of hematoma expansion of >6 mL or >33% from baseline ICH volume.24 Most studies have been restricted to patients receiving their CTA within 6 hours of symptom onset. However, in studies that included patients whose initial CTAs were performed substantially later in the course of their ICH, the spot sign remained an independent predictor of hematoma expansion, even after adjusting for time from symptom onset to CTA.14,19,20
Table 3. CT angiography spot sign and hematoma expansion.
| Primary outcome | Hematoma expansion | ||||||
|---|---|---|---|---|---|---|---|
| Authors (year) |
Wada et al. (2007)15 |
Delgado Almandoz et al. (2009)19 |
Ederies et al. (2009)16 |
Hallevi et al. (2010)17 |
Wang et al. (2011)22 |
Li et al. (2011)23 |
Demchuk
(2012) 24 |
| Study design | Prospective | Retrospective | Retrospective | Prospective | Retrospective | Prospective | Prospective |
| Number of patients | 39 | 367 | 61 | 27 | 312 | 139 | 228 |
|
Number of spot positive patients (%) |
13 (33) | 71 (19) | 21 (34) | 11 (41) | 76 (24) | 30 (22) | 61 (27) |
| Time window | <3 hours from symptom onset |
All patients | <6 hours from symptom onset |
<4 hours from symptom onset |
<3 hours from symptom onset |
<6 hours from symptom onset |
<6 hours from symptom onset |
|
Hematoma expansion definition |
>30% or > 6 mL increase from baseline ICH volume |
>30% or >6 mL increase from baseline ICH volume |
> 30% or >6 mL increase from baseline ICH volume |
>20% increase from baseline ICH volume |
>30% or > 6 mL increase from baseline ICH volume |
>33% or >12.5 mL increase from baseline ICH volume |
>33% or >6 mL increase from baseline ICH volume |
| Expansion (%) | 11 (28) | 56 (15) | 18 (30) | 16 (57) | 77 (25) | 32 (23) | 73 (32) |
|
Point estimate multivariate analysis (95% CI) |
LR 8.5 (2.9 - 25) |
OR 92 (37 - 227) |
n/a | OR 77 (4 – 1476) |
n/a | n/a | RR 2.3 (1.6 - 3.1) |
| Sensitivity | 0.91 | 0.88 | 0.78 | 0.73 | 0.78 | 0.72 | 0.51 |
| Specificity | 0.89 | 0.93 | 0.84 | 1.00 | 0.93 | 0.94 | 0.85 |
| PPV | 0.77 | 0.69 | 0.67 | 1.00 | 0.79 | 0.79 | 0.61 |
| NPV | 0.96 | 0.98 | 0.90 | 0.75 | 0.93 | 0.92 | 0.78 |
| Accuracy | 0.90 | 0.92 | 0.82 | 0.85 | 0.89 | 0.89 | 0.74 |
ICH = intracerebral hemorrhage; 95% CI = 95% confidence interval; LR = likelihood ratio; OR = odds ratio; n/a = not available; RR = relative risk; PPV = positive predictive value; NPV = negative predictive value
Functional Outcome and Mortality
Several studies have examined the value of the spot sign as a predictor of functional outcome and short- and long-term mortality (Table 4). All studies show a robust association of the CTA spot sign with both functional outcome and mortality. Similarly, the spot sign score has shown to be associated with both in-hospital mortality and poor clinical outcome at 3 months.20 In the PREDICT study the 3-month morality Hazard ratio was 2.4 (95% CI 1.4 – 4.0) for spot sign positive patients compared to spot sign negative patients.24
Secondary ICH
Secondary causes of ICH (e.g. aneurysms, trauma, brain tumors) are generally excluded from spot sign studies, because of presumed differences in pathophysiology and the relatively frequent need for surgical treatment. Such secondary causes can mimic a spot sign, and vascular and non-vascular mimics are frequent and can impair its accuracy.29 However, one study showed the spot sign also to be predictive of functional outcome in secondary ICH.30 An association with hematoma expansion in secondary ICH could not be assessed because nearly two-thirds of patients did not have a follow-up CT available due to early endovascular or surgical intervention.30
Clinical Implications and Ongoing Trials
The search for effective treatments that improve outcomes in patients with ICH continues to be challenging. The arrest of hematoma expansion continues to be a target for reducing final ICH volume and improving clinical outcome.5,6 Selection of patients at highest risk for expansion has therefore been a strategy in recent clinical trials searching to improve outcomes.7-9 Early presentation (within 4 to 6 hours) has been used in these trials as a surrogate for hematoma expansion, but even of the patients presenting ultra-early only 40% suffer from significant hematoma expansion.4 Therefore, more than half of enrolled patients may be exposed to an intervention without an opportunity to benefit.
This challenge provides a potential role for the spot sign as a selection tool. With the spot sign as strong predictor of hematoma expansion, it may be possible to identify ICH patients who are most likely to have poor outcomes and treat them aggressively. Ongoing clinical trials including STOP-IT (ClinicalTrials.gov #NCT00810888) and SPOTLIGHT (ClinicalTrials.gov #NCT01359202) are using the spot sign to select patients for treatment with recombinant factor VIIa (rFVIIa). Aggressive blood pressure lowering, as currently tested in non-selected patients by INTERACT231 and ATACH-II32, may also be guided by spot sign status. The ancillary study of ATACH-II, the SCORE-IT (Spot Sign Score in Restricting ICH Growth, National Institutes of Health – National Institute of Neurological Disorders and Stroke [NIH – NINDS] R01NS073344) study, is currently testing the hypothesis that patients with the highest spot sign scores benefit most from aggressive anti-hypertensive treatment.
Challenges and Future Directions
Although the CTA spot sign represents a substantial advance for the prediction of hematoma expansion in ICH, several important challenges remain. First, the relatively low sensitivity of the current definition of the spot sign. In PREDICT only 37 out of 73 patients (51%) with hematoma expansion demonstrated a spot sign, highlighting that a substantial number of patients will expand despite the absence of a spot sign.24 Thus, because the spot sign negative group was nearly three times the size of the spot sign positive group, the absolute number of expanders either with or without a spot sign is roughly the same. Therefore, a study selecting its patient population based on the spot sign would leave the same number of expanders untreated (36 versus 37 in PREDICT). Technical refinement of the CTA spot sign may increase the sensitivity of the spot sign in order to capture more patients destined to expand and thus reduce the number of potentially treatable patients excluded from any trial.
Second, a potential benefit found in one of the ongoing trials using the spot sign as selection tool, will only be generalizable to those who can undergo CTA. Although CTA does not appear to increase risk of nephropathy following ICH33, it has yet to be routinely applied in acute ICH other than for the purpose of identifying secondary causes of ICH.34
Third, all past and current studies only include patients in the first hours after symptom onset. So a considerable number of patients are left untreated, based solely on their presentation time. While early presenters are certainly at higher individual risk for hematoma expansion, the spot sign is an independent predictor of hematoma expansion when adjusting for presentation time.14,19,20 This may allow the inclusion of patients within a broader time frame and should therefore be considered in future trials.
Future directions include phase II and III clinical trails to evaluate the spot sign as a selection tool for aggressive medical management and technical refinement of the spot sign to increase sensitivity. An unexplored field includes the possibility of patient selection for surgical treatment. No data is currently available on the re-bleeding rate in surgically treated spot sign positive patients. If the spot sign represents extensive small vessel damage, the risk of re-bleeding may be heightened and a spot sign should then preclude patients from undergoing surgical evacuation.
Despite the shortcomings of the spot sign, and biomarkers in general35, its consistent association with hematoma expansion provides us with a robust radiographic marker of hematoma expansion. Therefore, phase III, randomized clinical trials are the only way to assess clinical effectiveness of patient selection by spot sign status. A potentially beneficial outcome from such a study can at least be seen as the first step in the long-awaited direction of treatment success in intracerebral hemorrhage.
Acknowledgments
Sources of Funding
All funding entities had no involvement in study design, data collection, analysis, and interpretation, writing of the manuscript and in the decision to submit for publication. The project described was supported by Grant Numbers R01NS073344, R01NS059727, 5K23NS059774 from the NIH – NINDS and American Heart Association Grant Number 0755984T. Dr. Brouwers was supported by the NIH – NINDS SPOTRIAS fellowship grant P50NS051343. The content is solely the responsibility of the authors and does not necessarily represent the official views of the NIH or the NINDS.
Footnotes
Conflicts of Interest
H.B. Brouwers, None; J.N. Goldstein, Research Grant NIH – NINDS, Consultant/advisory board CSL Behring; J.M. Romero, Imaging Committee DIAS trial/advisory board Lundbeck pharmaceuticals; J. Rosand, Research Grants NIH.
This is a PDF file of an unedited manuscript that has been accepted for publication. As a service to our customers we are providing this early version of the manuscript. The manuscript will undergo copyediting, typesetting, and review of the resulting proof before it is published in its final citable form. Please note that during the production process errors may be discovered which could affect the content, and all legal disclaimers that apply to the journal pertain.
REFERENCES
- (1).Qureshi AI, Mendelow AD, Hanley DF. Intracerebral haemorrhage. Lancet. 2009;373:1632–1644. doi: 10.1016/S0140-6736(09)60371-8. [DOI] [PMC free article] [PubMed] [Google Scholar]
- (2).van Asch CJ, Luitse MJ, Rinkel GJ, van der Tweel I, Algra A, Klijn CJ. Incidence, case fatality, and functional outcome of intracerebral haemorrhage over time, according to age, sex, and ethnic origin: a systematic review and meta-analysis. Lancet Neurol. 2010;9:167–176. doi: 10.1016/S1474-4422(09)70340-0. [DOI] [PubMed] [Google Scholar]
- (3).Broderick JP, Brott TG, Duldner JE, Tomsick T, Huster G. Volume of intracerebral hemorrhage. A powerful and easy-to-use predictor of 30-day mortality. Stroke. 1993;24:987–993. doi: 10.1161/01.str.24.7.987. [DOI] [PubMed] [Google Scholar]
- (4).Brott T, Broderick J, Kothari R, Barsan W, Tomsick T, Sauerbeck L, et al. Early hemorrhage growth in patients with intracerebral hemorrhage. Stroke. 1997;28:1–5. doi: 10.1161/01.str.28.1.1. [DOI] [PubMed] [Google Scholar]
- (5).Davis SM, Broderick J, Hennerici M, Brun NC, Diringer MN, Mayer SA, et al. Hematoma growth is a determinant of mortality and poor outcome after intracerebral hemorrhage. Neurology. 2006;66:1175–1181. doi: 10.1212/01.wnl.0000208408.98482.99. [DOI] [PubMed] [Google Scholar]
- (6).Dowlatshahi D, Demchuk AM, Flaherty ML, Ali M, Lyden PL, Smith EE, et al. Defining hematoma expansion in intracerebral hemorrhage: relationship with patient outcomes. Neurology. 2011;76:1238–1244. doi: 10.1212/WNL.0b013e3182143317. [DOI] [PMC free article] [PubMed] [Google Scholar]
- (7).Mayer SA, Brun NC, Begtrup K, Broderick J, Davis S, Diringer MN, et al. Efficacy and safety of recombinant activated factor VII for acute intracerebral hemorrhage. N Engl J Med. 2008;358:2127–2137. doi: 10.1056/NEJMoa0707534. [DOI] [PubMed] [Google Scholar]
- (8).Anderson CS, Huang Y, Wang JG, Arima H, Neal B, Peng B, et al. Intensive blood pressure reduction in acute cerebral haemorrhage trial (INTERACT): a randomised pilot trial. Lancet Neurol. 2008;7:391–399. doi: 10.1016/S1474-4422(08)70069-3. [DOI] [PubMed] [Google Scholar]
- (9).Antihypertensive Treatment of Acute Cerebral Hemorrhage (ATACH) investigators Antihypertensive treatment of acute cerebral hemorrhage. Crit Care Med. 2010;38:637–648. doi: 10.1097/CCM.0b013e3181b9e1a5. [DOI] [PMC free article] [PubMed] [Google Scholar]
- (10).Broderick JP, Diringer MN, Hill MD, Brun NC, Mayer SA, Steiner T, et al. Determinants of intracerebral hemorrhage growth: an exploratory analysis. Stroke. 2007;38:1072–1075. doi: 10.1161/01.STR.0000258078.35316.30. [DOI] [PubMed] [Google Scholar]
- (11).Flibotte JJ, Hagan N, O’Donnell J, Greenberg SM, Rosand J. Warfarin, hematoma expansion, and outcome of intracerebral hemorrhage. Neurology. 2004;63:1059–1064. doi: 10.1212/01.wnl.0000138428.40673.83. [DOI] [PubMed] [Google Scholar]
- (12).Becker KJ, Baxter AB, Bybee HM, Tirschwell DL, Abouelsaad T, Cohen WA. Extravasation of radiographic contrast is an independent predictor of death in primary intracerebral hemorrhage. Stroke. 1999;30:2025–2032. doi: 10.1161/01.str.30.10.2025. [DOI] [PubMed] [Google Scholar]
- (13).Murai Y, Takagi R, Ikeda Y, Yamamoto Y, Teramoto A. Three-dimensional computerized tomography angiography in patients with hyperacute intracerebral hemorrhage. J Neurosurg. 1999;91:424–431. doi: 10.3171/jns.1999.91.3.0424. [DOI] [PubMed] [Google Scholar]
- (14).Goldstein JN, Fazen LE, Snider R, Schwab K, Greenberg SM, Smith EE, et al. Contrast extravasation on CT angiography predicts hematoma expansion in intracerebral hemorrhage. Neurology. 2007;68:889–894. doi: 10.1212/01.wnl.0000257087.22852.21. [DOI] [PubMed] [Google Scholar]
- (15).Wada R, Aviv RI, Fox AJ, Sahlas DJ, Gladstone DJ, Tomlinson G, et al. CT angiography “spot sign” predicts hematoma expansion in acute intracerebral hemorrhage. Stroke. 2007;38:1257–1262. doi: 10.1161/01.STR.0000259633.59404.f3. [DOI] [PubMed] [Google Scholar]
- (16).Ederies A, Demchuk A, Chia T, Gladstone DJ, Dowlatshahi D, Bendavit G, et al. Postcontrast CT extravasation is associated with hematoma expansion in CTA spot negative patients. Stroke. 2009;40:1672–1676. doi: 10.1161/STROKEAHA.108.541201. [DOI] [PubMed] [Google Scholar]
- (17).Hallevi H, Abraham AT, Barreto AD, Grotta JC, Savitz SI. The spot sign in intracerebral hemorrhage: the importance of looking for contrast extravasation. Cerebrovasc Dis. 2010;29:217–220. doi: 10.1159/000267842. [DOI] [PubMed] [Google Scholar]
- (18).Kim J, Smith A, Hemphill JC, 3rd, Smith WS, Lu Y, Dillon WP, et al. Contrast extravasation on CT predicts mortality in primary intracerebral hemorrhage. AJNR Am J Neuroradiol. 2008;29:520–525. doi: 10.3174/ajnr.A0859. [DOI] [PMC free article] [PubMed] [Google Scholar]
- (19).Delgado Almandoz JE, Yoo AJ, Stone MJ, Schaefer PW, Goldstein JN, Rosand J, et al. Systematic characterization of the computed tomography angiography spot sign in primary intracerebral hemorrhage identifies patients at highest risk for hematoma expansion: the spot sign score. Stroke. 2009;40:2994–3000. doi: 10.1161/STROKEAHA.109.554667. [DOI] [PMC free article] [PubMed] [Google Scholar]
- (20).Delgado Almandoz JE, Yoo AJ, Stone MJ, Schaefer PW, Oleinik A, Brouwers HB, et al. The spot sign score in primary intracerebral hemorrhage identifies patients at highest risk of in-hospital mortality and poor outcome among survivors. Stroke. 2010;41:54–60. doi: 10.1161/STROKEAHA.109.565382. [DOI] [PMC free article] [PubMed] [Google Scholar]
- (21).Thompson AL, Kosior JC, Gladstone DJ, Hopyan JJ, Symons SP, Romero F, et al. Defining the CT angiography ‘spot sign’ in primary intracerebral hemorrhage. Can J Neurol Sci. 2009;36:456–461. doi: 10.1017/s0317167100007782. [DOI] [PubMed] [Google Scholar]
- (22).Wang YH, Fan JY, Luo GD, Lin T, Xie DX, Ji FY, et al. Hematoma volume affects the accuracy of computed tomographic angiography ‘spot sign’ in predicting hematoma expansion after acute intracerebral hemorrhage. Eur Neurol. 2011;65:150–155. doi: 10.1159/000324153. [DOI] [PubMed] [Google Scholar]
- (23).Li N, Wang Y, Wang W, Ma L, Xue J, Weissenborn K, et al. Contrast extravasation on computed tomography angiography predicts clinical outcome in primary intracerebral hemorrhage: a prospective study of 139 cases. Stroke. 2011;42:3441–3446. doi: 10.1161/STROKEAHA.111.623405. [DOI] [PubMed] [Google Scholar]
- (24).Demchuk AM, Dowlatshahi D, Rodriguez-Luna D, Molina CA, Blas YS, Dzialowski I, et al. Prediction of haematoma growth and outcome in patients with intracerebral haemorrhage using the CT-angiography spot sign (PREDICT): a prospective observational study. Lancet Neurol. 2012;11:307–314. doi: 10.1016/S1474-4422(12)70038-8. [DOI] [PubMed] [Google Scholar]
- (25).d’Esterre CD, Chia TL, Jairath A, Lee TY, Symons SP, Aviv RI. Early rate of contrast extravasation in patients with intracerebral hemorrhage. AJNR Am J Neuroradiol. 2011;32:1879–1884. doi: 10.3174/ajnr.A2669. [DOI] [PMC free article] [PubMed] [Google Scholar]
- (26).Brouwers HB, Biffi A, McNamara KA, Ayres AM, Valant V, Schwab K, et al. APOE Genotype Is Associated With CT Angiography Spot Sign In Lobar Intracerebral Hemorrhage. Stroke. 2012 May 23; doi: 10.1161/STROKEAHA.112.659094. Epub ahead of print. [DOI] [PMC free article] [PubMed] [Google Scholar]
- (27).Brouwers HB, Biffi A, Ayres AM, Schwab K, Cortellini L, Romero JM, et al. APOE Genotype Predicts Hematoma Expansion in Lobar Intracerebral Hemorrhage. Stroke. 2012;43:1490–1495. doi: 10.1161/STROKEAHA.111.643262. [DOI] [PMC free article] [PubMed] [Google Scholar]
- (28).Fisher CM. Pathological observations in hypertensive cerebral hemorrhage. J Neuropathol Exp Neurol. 1971;30:536–550. doi: 10.1097/00005072-197107000-00015. [DOI] [PubMed] [Google Scholar]
- (29).Gazzola S, Aviv RI, Gladstone DJ, Mallia G, Li V, Fox AJ, et al. Vascular and nonvascular mimics of the CT angiography “spot sign” in patients with secondary intracerebral hemorrhage. Stroke. 2008;39:1177–1183. doi: 10.1161/STROKEAHA.107.499442. [DOI] [PubMed] [Google Scholar]
- (30).Delgado Almandoz JE, Kelly HR, Schaefer PW, Brouwers HB, Yoo AJ, Stone MJ, et al. CT angiography spot sign predicts in-hospital mortality in patients with secondary intracerebral hemorrhage. J Neurointerv Surg. 2011 Oct 15; doi: 10.1136/neurintsurg-2011-010061. Epub ahead of print. [DOI] [PMC free article] [PubMed] [Google Scholar]
- (31).Delcourt C, Huang Y, Wang J, Heeley E, Lindley R, Stapf C, et al. The second (main) phase of an open, randomised, multicentre study to investigate the effectiveness of an intensive blood pressure reduction in acute cerebral haemorrhage trial (INTERACT2) Int J Stroke. 2010;5:110–116. doi: 10.1111/j.1747-4949.2010.00415.x. [DOI] [PubMed] [Google Scholar]
- (32).Qureshi AI, Palesch YY. Antihypertensive Treatment of Acute Cerebral Hemorrhage (ATACH) II: design, methods, and rationale. Neurocrit Care. 2011;15:559–576. doi: 10.1007/s12028-011-9538-3. [DOI] [PMC free article] [PubMed] [Google Scholar]
- (33).Oleinik A, Romero JM, Schwab K, Lev MH, Jhawar N, Delgado Almandoz JE, et al. CT angiography for intracerebral hemorrhage does not increase risk of acute nephropathy. Stroke. 2009;40:2393–2397. doi: 10.1161/STROKEAHA.108.546127. [DOI] [PMC free article] [PubMed] [Google Scholar]
- (34).Delgado Almandoz JE, Romero JM. Advanced CT imaging in the evaluation of hemorrhagic stroke. Neuroimaging Clin N Am. 2011;21:197–213. ix. doi: 10.1016/j.nic.2011.01.001. [DOI] [PubMed] [Google Scholar]
- (35).Wardlaw JM. Prediction of haematoma expansion with the CTA spot sign: a useful biomarker? Lancet Neurol. 2012;11:294–295. doi: 10.1016/S1474-4422(12)70045-5. [DOI] [PubMed] [Google Scholar]