Abstract
Most of the currently treated HIV-1 protease (HIV-PR) inhibitors have been prone to suffer from the mutations associated drug resistance. Therefore, it is necessary to search for potent alternatives against the drug resistance. In the current study we have tested the single-walled carbon nanotube (SWCNT) as an inhibitor in wild type (WT) as well as in three primary mutants (I50VPR, V82APR and I84VPR) of the HIV-1-PR through docking the SWCNT in the active site region, and then performed all-atom MD simulations for the complexes. The conformational dynamics of HIV-PR with a 20 ns trajectory reveals that the SWCNT can effectively bind to the HIV-1-PR active site and regulate the flap dynamics such as maintaining the flap-flap closed. To gain an insight into the binding affinity, we also performed the MM-PBSA based binding free energy calculations for the four HIV-PR/SWCNT complexes. It was observed that, although the binding between the SWCNT and the HIV-PR decreases due to the mutations, the SWCNTs bind to the HIV-PRs 3–5 folds stronger than the most potent HIV-1-PR inhibitor, TMC114. Remarkably, the significant interactions with binding energy higher than 1 kcal/mol focus on the flap and active regions, which favors closing flap-flap and deactivating the active residues of the HIV-PR. The flap dynamics and binding strength information for HIV-PR and SWCNTs can help design SWCNT-based HIV-1-PR inhibitors.
Keywords: Single Walled Carbon NanoTube (SWCNT), Molecular dynamics, Binding energy, MM-PBSA, HIV-1 protease inhibitor, Flap dynamics
1. Introduction
HIV-1 protease (HIV-1-PR), an indispensable enzyme for human immunodeficiency virus (HIV) replication, is an important target for drug design strategies to combat acquired immune deficiency syndrome (AIDS). HIV-1-PR acts at the late stage of infection by cleaving the Gag and Gag–Pol polyproteins to yield mature infectious virions. Inactivation of this enzyme produces immature, noninfectious virions and hence chunks further HIV infection. Keeping that in mind, several drugs have been developed against AIDS. Up to date, the Food and Drug Administration (FDA) has approved eleven protease inhibitors for the treatment of AIDS. However, unfortunately, resistance to these approved drugs has been built up quickly due to the associated mutations in the protease leading to reduced binding affinities between inhibitors and the protease. Therefore, it is necessary to search for some other alternatives with minimal cytotoxicity and potent against the drug resistance with novel mechanisms of action.
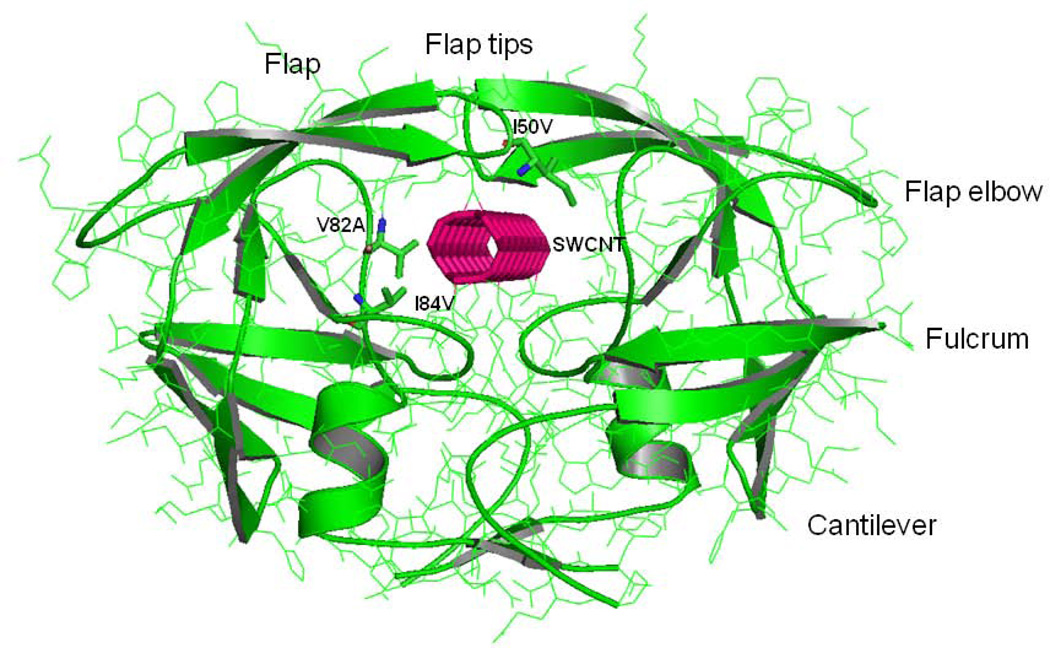
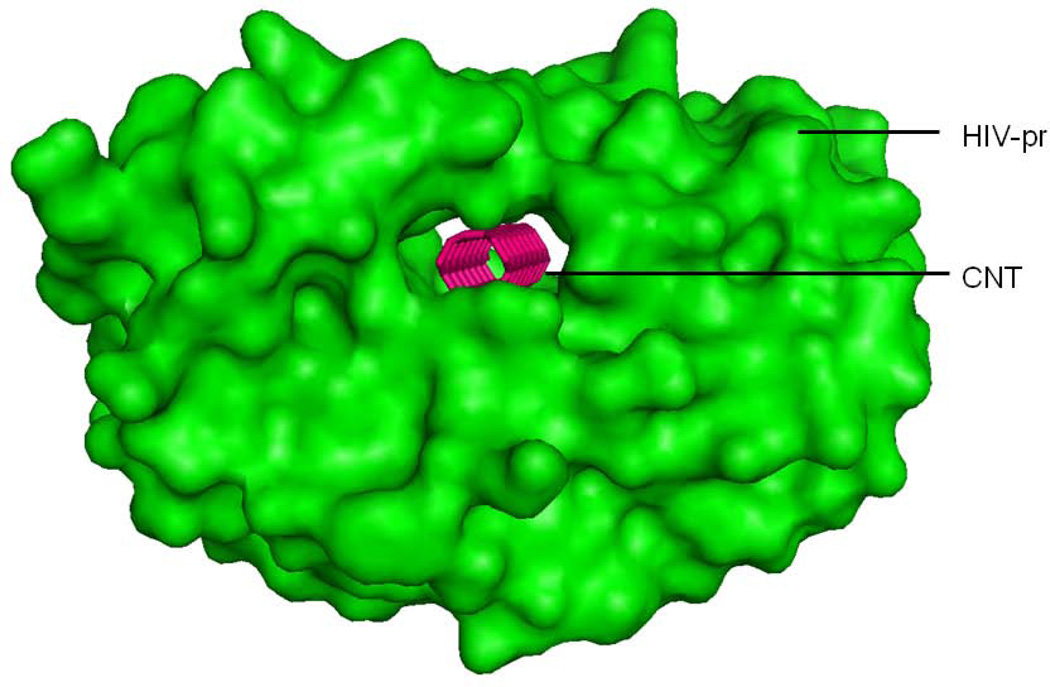
HIV-1-PR is a C2-symmetric homodimer of 99 residues in each chain. The residues of HIV-1-PR are numbered as 1–99 and 1’–99’ for chains A and B, respectively. The active site region of the protein is formed by the dimerization of the two monomers and is covered by two glycine rich, antiparallel β-hairpins flaps. The volume of the active site and the accession of ligand to the active site are controlled by the dynamics of the two flaps.[1–2] As a member of the aspartic protease family, the protein contains the catalytic triad including the residues Asp25-Thr26-Gly27 in both chains, where the functional Asp residues (Asp25 and Asp25’) are located at the dimer interface. The residue index for different regions of HIV-1-PR are shown in brackets, flap (43–58 and 43’–58’), flap elbow (35–42 and 35’–42’), fulcrum (11–22 and 11’–22’), cantilever (59–75 and 59’–75’), and active site regions (23–30, 78–82 and 23’–30’, 78’–82’) for chains A and B as represented in Figure 1. Surface view of HIV-1-PR with the single-walled carbon nanotube (SWCNT) bound inside the active site cavity is shown in Figure 2. The docked (3,3) SWCNT has a length of 18.5Å and a diameter of 4Å accommodating well in the active site cavity of the HIV-PR.
Figure 1.
Configuration of the HIV-PR/SWCNT complex. The HIV-PR is shown in green ribbons for both the chain-A and chain-B. The sites of mutation for Ile50, Val82 and Ile84 are indicated by stick representation. SWCNT is bound in the active site and is labeled, which is represented by solid pink line. Important regions of the HIV-PR like flap, flap elbow, fulcrum and cantilever are also labeled.
Figure 2.
Representation of the docked SWCNT inside the HIV-PR active site interior in surface view.
Nanomaterials have several advantages over many conventionally used peptidic or non-peptidic HIV-1-PR inhibitors. Nanomaterials do not react easily with other chemical compounds, which makes it stable enough as compared to the peptidic HIV-1-PR inhibitors.[3] C60 and carbon nanotube (CNT) tend to retain their geometrical properties and shape making it rigid structure, which helps them in firm interaction with other non-polar biochemical motifs.[4] The investigation of the inhibition effects of fullerenes has been performed through both computational and experimental means. For example, fullerene C60-derivatives have been found experimentally to be potent inhibitors with an inhibition constant Ki of ~100 nM.[4–6] Using molecular dynamics simulations and free energy calculations, Zhu et al. observed the ability of fullerene-based compounds to desolvate the cavity region that leads to a strong hydrophobic interaction between the C60 moiety and active site residues.[7] Zhu et al. therefore suggested that fullerene-based derivatives could be used as effective HIV-1-PR inhibitors. Moreover, the interactions of SWCNTs with human serum proteins lead to a competitive binding with different adsorption capacity and packing modes. Cellular cytotoxicity assays, with human acute monocytic leukemia cell line and human umbilical vein endothelial cells, expose that the competitive bindings of blood proteins on the SWCNT surface can greatly change their cellular interaction pathways and result in much reduced cytotoxicity for the protein-coated SWCNTs.[8] Furthermore from the virus inactivation assays of Schinazi et al., it has been found that fullerene based inhibitors are non-cytotoxic in human CEM, Peripheral Blood Mononuclear (PBM), H9 and Vero cells with a concentration up to ~100 µM.[9] Fullerene based compounds have also inhibitory effects on a variety of enzymes like glutathione reductase,[10] microsomal cytochrome P450-dependent mono-oxygenase and NADPH-cytochrome P450 reductase,[11] carbonic anhydrase,[12] M-MuLV reverse transcriptase,[13] DNA polymerase,[14] nitric oxide synthase,[15–16] glycosidase,[17] and lysozyme.[18] Based on the previously published studies and the current discussions, nanomaterial-based ligands may be used as efficient HIV-1-PR inhibitors with a great advantage compared to the conventional peptidic or non-peptidic HIV-1-PR inhibitors.
Nanomaterials such as fullerenes and CNT have also been tested as HIV-1-PR inhibitors in silico.[3, 19–20] However, their studies were limited to wild type (WT) HIV-1-PR. In general, only the mutant HIV-1-PRs lead to drug resistance in all types of inhibitors. Thus, the more important is to investigate the flap dynamics and binding mechanism of CNT with mutant HIV-1-PRs. In the present study, we have tested the SWCNTs as inhibitors in WT as well as in three primary mutants (I50VPR, V82APR and I84VPR) of HIV-1-PR by docking the SWCNT in the active site region, and then performed all-atom molecular dynamics (MD) simulations for the complexes. The conformational dynamics of HIV-1-PR were investigated with a 20 ns trajectory, revealing that SWCNT can bind to the HIV-PR active site and regulate the flap dynamics behavior. To gain an insight into the binding affinities, we also performed the binding free energy calculations for the four different HIV-1-PR/SWCNT complexes. Binding affinity calculations showed that the SWCNTs can bind to HIV-1-PR several folds higher than the current HIV-1-PR inhibitors, e.g., the most recent drug TMC114. With careful observations from the MD simulation results and the binding properties of SWCNT to the HIV-1-PR variants, the present study can offer SWCNTs as HIV-1-PR inhibitors with vast potential for applications against drug resistance.
2. Computational Methods
2.1. Modeling CNT-protease complex through docking
The crystal structures of the wild-type and mutant HIV-1-PR bound to TMC-114 were obtained from the Protein Date Bank (PDB). The PDB entries are: 1T3R [21] for the wild type (WT), 2F8G [22] for the I50VPR, 2QD7 [23] for the V82APR, and 2NNP [24] for the I84VPR mutants. The structure of the apo (un-liganded) HIV-1-PR was obtained by deleting the TMC-114 from the active site region of the protease. A (3, 3) SWCNT with a diameter of 4.0 Å and a length of 18.5 Å was selected as a candidate for the inhibitor. The docking algorithm was then used to locate the optimal configuration of the SWCNT inside the active site of HIV-1-PR. The parameters for carbon atoms of the SWCNT were taken from type CA for aromatic carbon atoms in the ff99SB force field. The SWCNT was initially positioned in the HIV-1-PR active site. Using docking in the PATCHDOCK program,[25] the optimal orientation of the ligand inside the active cavitycould be located by searching for the highest score, which was produced by calculating the non-bonded terms of the molecular mechanic (MM) force field.
2.2. System Setups
Due to the importance of the protonation of Asp25/Asp25′ in the HIV-1-PR, the monoprotonated HIV-1-PR was considered, and a proton is added to the oxygen atom of OD2 in Asp25 in chain B.[26–27] Charges of SWCNT were calculated using the restrained electrostatic potential (RESP) procedure [28] at the Hartee-Fock/6-31G* after minimizing the molecule at the AM1 semi-empirical level.[29] All missing hydrogen atoms were added using the LEaP module. The ff99SB [30] force field was used with TIP3P[31] model for water molecules. The system was solvated with the TIP3P waters in the periodic box of size 89.2 × 84.8 × 96.3 Å3 containing more than 10,000 water molecules. A cutoff of 10 Å was used along the three axes to discard water molecules beyond the cutoff from the solute molecule. An appropriate number of Cl− counter ions were added to neutralize the system. A default cutoff of 8.0 Å was used for Lennard-Jones interactions, and the long-range electrostatic interactions were calculated with the particle mesh ewald (PME) method.[32] Constant temperature and pressure conditions in the simulation were achieved by coupling the system to a Berendsen's thermostat and barostat.[33] The SHAKE[34] algorithm was used to constrain all bonds involving hydrogens.
2.3. Molecular dynamics simulations
Structures were optimized through Sybyl before the minimization to remove any bad contacts in the structure. The system was then minimized in four phases. In the first phase, the system was minimized giving restraints (30kcal/mol/Å2) to all heavy atoms of the protein and ligand for 10000 steps with subsequent second phase minimization of the all backbone atoms and C-alpha atoms, respectively, for 10000 steps each. The system was then heated to 300K with a gap of 50K over 10 ps with a 1 fs time step. The protein atoms were restrained with force constant of 30 kcal/mol/Å2, and the SWCNT was allowed to move freely without any restraint applied. In subsequent minimization of the third phase, the force constant was reduced by 10 kcal/mol/Å2 in each step to reach the unrestrained structure in three stages of 10000 steps each. The whole system was finally minimized again for 10000 steps keeping all atoms free at the NVT ensemble. The system was equilibrated at the NVT ensemble for 100ps and then switched to the NPT ensemble for equilibrating without any restraints for another 120 ps. The convergence of energies, temperature, pressure and global RMSD was used to verify the stability of the systems. All the HIV-1-PR/SWCNT complexed trajectories were run for 20 ns. The time step for MD production run was 1 fs. All the simulations were performed with AMBER 11 package [35] at the Pittsburgh Supercomputing Center on SGI Altix Cobalt system at NCSA, requesting sixteen 8-core nodes, and on local Dell HPCC linux cluster.
2.4. MM-PBSA calculations
The binding free energies of the SWCNT to the protease were calculated using the MM-PBSA method and nmode module implemented in AMBER 11.[35] For each complex, a total number of 50 snapshots were taken from the last 2 ns on the MD trajectory with an interval of 40 ps. The MM-PBSA method can be summarized as follows.
| (1) |
where ΔGb is the binding free energy in solution consisting of the molecular mechanics energy (ΔEMM) and the conformational entropy effect to binding (−TΔS) in the gas phase, and the solvation free energy (ΔGsol). ΔEMM can be expressed as:
| (2) |
where ΔEvdw and ΔEele correspond to the van der Waals and electrostatic interactions in the gas phase, respectively. The solvation free energy (ΔGsol) is further divided into two components:
| (3) |
where ΔGpol and ΔGnonpol are the polar and non-polar contributions to the solvation free energy, respectively. The ΔGsol is calculated with the PBSA module of AMBER suite of program. The dielectric constant is set to 1.0 inside the solute and 80.0 for the solvent. The nonpolar contribution of the solvation free energy is calculated as a function of the solvent-accessible surface area (SAS), as follows:
| (4) |
where SAS was estimated using the MSMS program, with a solvent probe radius of 1.4 Å. The empirical constants γ and β were set to 0.00542 kcal/(molÅ2) and 0.92 kcal/mol, respectively. The contributions of entropy (TΔS) to binding free energy arise from changes of the translational, rotational and vibrational degrees of freedom, as follows:
| (5) |
TΔS is generally calculated using classical statistical thermodynamics and normal mode analysis. Due to entropy calculations for large systems being extremely time consuming, we applied only 40 snapshots taken at an interval of 50 ps from the final 2 ns of the MD simulation for the entropy contribution. Each snapshot was minimized with a distance dependant dielectric function 4Rij (the distance between two atoms) until the root-mean-square of the energy gradient was lower than 10−4 kcal/mol/Å2.
2.5. Residue-SWCNT interaction decomposition
On account of the huge demand of computational resources for PB calculations, the interaction between SWCNT and each HIV-1-PR residue was computed using the MM-GBSA decomposition process in the mm_pbsa module in AMBER11. The binding interaction of each inhibitor-residue pair includes four terms: van der Waals (ΔEvdw), electrostatic (ΔEele), polar solvation (ΔGpol), and non-polar solvation (ΔGnopol) contribution.
| (6) |
The polar contribution (ΔGpol) to solvation energy was calculated by using the GB (Generalized Born) module and the parameters for the GB calculation were developed by Onufriev et al. [36] All energy components in Equation (6) were calculated using 50 snapshots from the last 2.0 ns of the MD simulation. The hydrogen bonds (H-bonds) were analyzed using the ptraj module of AMBER program. Formation of the H-bonds depends on the distance and angle cutoff as follows: (a) distance between proton donor and acceptor atoms were ≤ 3.5 Å, and (b) the angle between donor-H…acceptor was ≥ 120°. Graphic visualization and presentation of protein structures were done using PYMOL [www.pymol.org].
3. Results and Discussions
3.1. Stability of trajectories from RMSD
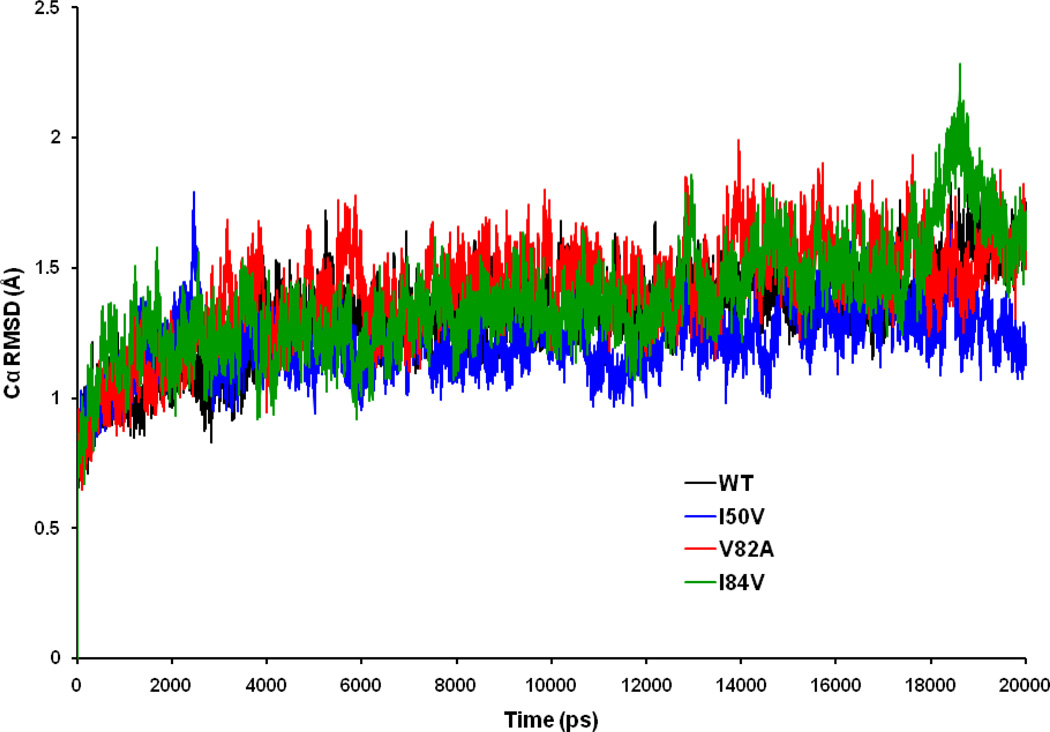
Exploring the effect of mutations on the conformational stability of the HIV-1-PR/SWCNT complexes, RMSDs for HIV-1-PR Cα atoms relative to the equilibrated structures were calculated and plotted in Figure 3. The RMSD plots indicate that the conformations of the WT, I50VPR, V82APR and I84VPR mutant HIV-1-PR complexes are in good equilibrium. The trajectory of the I84VPR/SWCNT complex fluctuates more than other three trajectories at around 18–19 ns, after that it goes parallel to others. V82APR complex has a higher mean RMSD (1.41 Å) than the WT (1.32 Å), I50VPR mutant (1.22 Å) and I84VPR mutant (1.37 Å), with a respective standard deviation (SD) of 0.17, 0.12 0.19 and 0.20 Å for WT, I50VPR, V82APR and I84VPR mutants. The result signifies that RMSD of all four complexes were similar from the starting structures during the course of simulations (except around 18–19 ns where the RMSD is up to 2.2 Å) with values around 0.8 to 2.0 Å ensuring stable trajectories.
Figure 3.
Root-mean-square displacement (RMSD) plot for backbone Cα atoms relative to their initial minimized complex structures as a function of time.
3.2. Root Mean Square Fluctuations (RMSF)
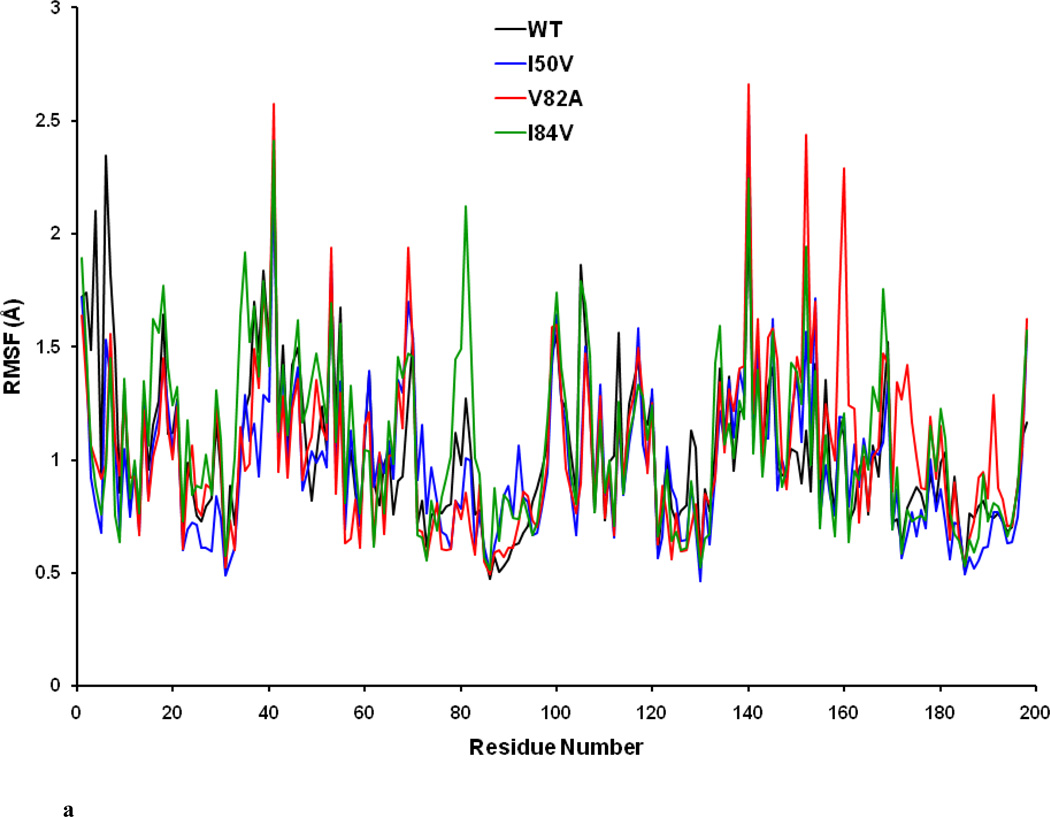
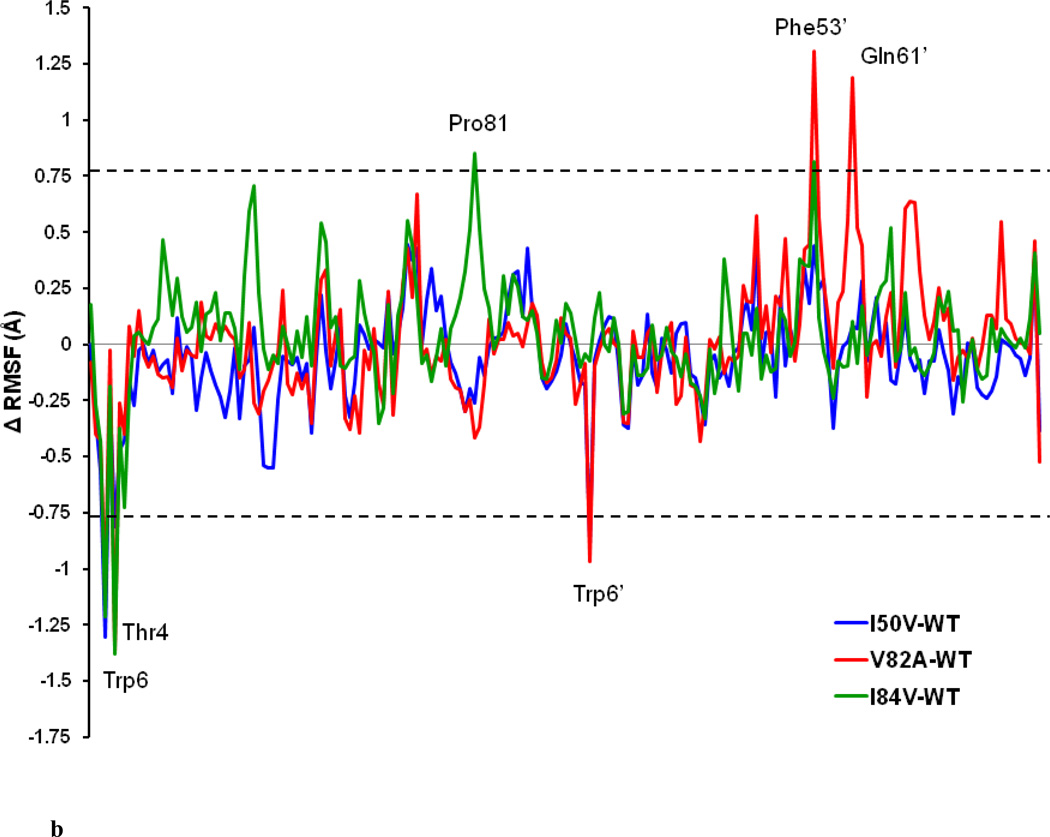
In order to analyze the detailed residual atomic fluctuations, the root mean square fluctuations (RMSF) of the Cα atoms have been performed for HIV-1-PR structures as illustrated in Figure 4a. The average RMSF values per-residue in the flap and active-site binding region for the WT-, I50VPR-, V82APR- and I84VPR- SWCNT complexes are 1.04, 0.97, 1.05 and 1.14 Å, respectively. Overall, the RMSF values of WT-SWCNT complex and the mutant-SWCNT complexes do not greatly differ. The information obtained from RMSF indicates that the three mutations may not lead to significant conformational changes of HIV-1-PR. For the given HIV-1-PR, the RMSF values indicate larger fluctuations near the flap elbows (around Gly40-Arg41 and Gly40’-Arg41’), the flap-tips (Ile50-Phe53 and Ile50’-Phe53’) and cantilever (His69 and His69’) regions than others. The mobility of the residues in the flap elbow regions of the two chains are almost overlapped for WT and all the mutant complexes; however, the flap tips residues Phe53 and Phe53’ in the V82APR mutant have a comparatively higher fluctuations than in the WT, I50VPR and I84VPR mutants. All the four HIV-PR/SWCNT complexes show analogous fashion of dynamics features. Regions near the catalytic triad in both the chains show a rigid behavior, which is in accordance with the experimental [37] and theoretical studies.[38] Difference in the RMSF values of the protein in its SWCNT bound form is shown in Figure 4b. Residues with absolute difference more than 0.75 Å were considered as the highly fluctuating residues and are labeled by two cutoff dashed lines as shown in the figure. There are significant differences for the residues like Thr4-Trp6, Glu35-Gly40 (flap elbow of chain-A), Trp6’, Phe53’ (Flap tip of chain-B). It was noted that residues in the active site region (Pro81) in the I84VPR mutant and cantilever region (Gln61’) in the V82APR mutant have significant fluctuations as compared to the WT counterpart.
Figure 4.
a. Root Mean Square Fluctuations (RMSF) of backbone atoms versus residue number of the WT, I50VPR, V82APR and I84VPR /SWCNT complexed structures.
b. Difference of RMSF values from MD simulation for WT and mutant HIV-PR/SWCNT complexed structures (mutant RMSF – wild type RMSF). The residues with an absolute difference larger than 0.75 Å are labeled by two cutoff dashed lines.
3.3. Flap tip - flap tip distances
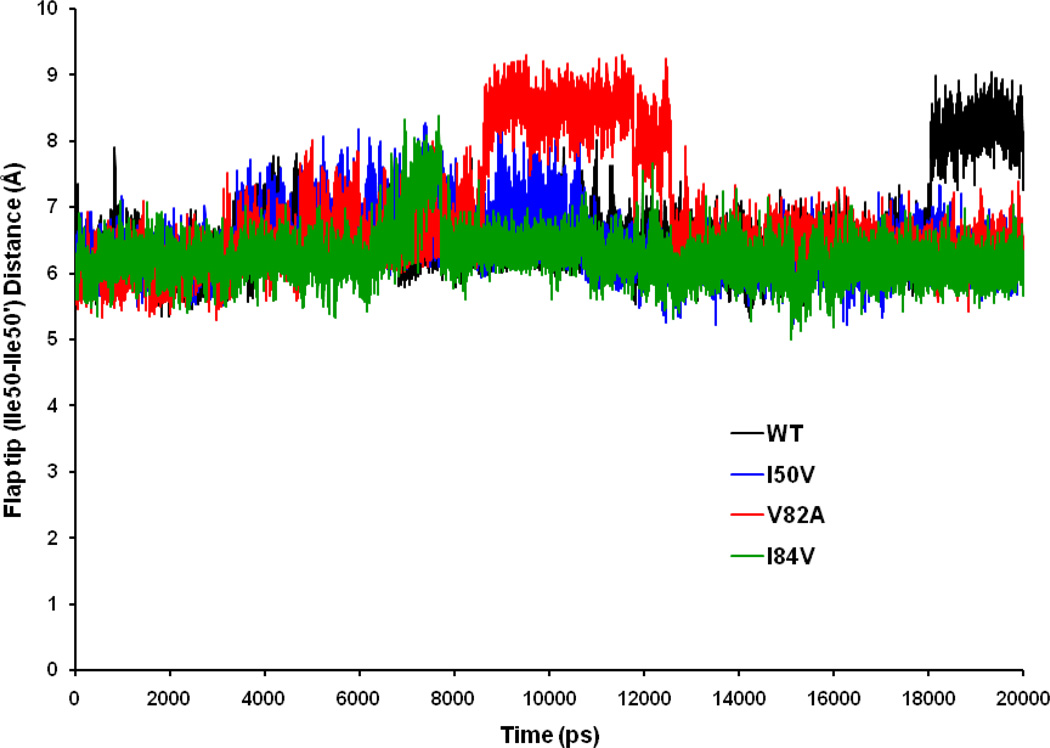
In order to get the idea about the distance between the flaps and also the rate of flap opening with respect to the flap positions, we have calculated the distance between the flap tip residues (Ile50 – Ile50’) as shown in Figure 5. Average distances for the WT-, I50VPR-, V82APR-, and I84VPR-SWCNT complexes are 6.55 Å, 6.42 Å, 6.79 Å and 6.23 Å, with SD 0.60 Å, 0.40 Å, 0.87 Å and 0.35 Å, respectively. The time-series plot shows that, the four systems have almost overlapped distances with few exceptions near 7ns in case of I84VPR, from around 8.0ns to 13.0 ns for V82APR and the last 2 ns in case of WT, where the distance goes up to a range of 6–9Å. This is believed to be due to the curling in and out of the flap tips as evidenced by the video clips of the simulated interactions between the flap tip (Ile50 and Ile50’) residues. More importantly the diagram show that though the flap-flap distance varies through the simulation time, ultimately does not lead to any opened conformation during 20ns simulation time. It is believed that, the open state of HIV-1-PR is defined only when the flap-flap (Ile50 – Ile50’) distance is ≥ 14Å and flap-active site {Ile50 (Ile50’) – Asp25 (Asp25’)} distance is ≥ 18 Å simultaneously. [54] This suggests that the observed result in our study samples mostly closed and occasional semi-opened conformations. The result also signifies that SWCNT may effectively prevent the flaps from opening throughout the simulation time.
Figure 5.
Time-series plot of Ile50–Ile50′ distance for WT, I50VPR, V82APR and I84VPR mutant simulations of the SWCNT complexed proteins.
3.3. Flap tip to Active site (Ile50-Asp25) distances
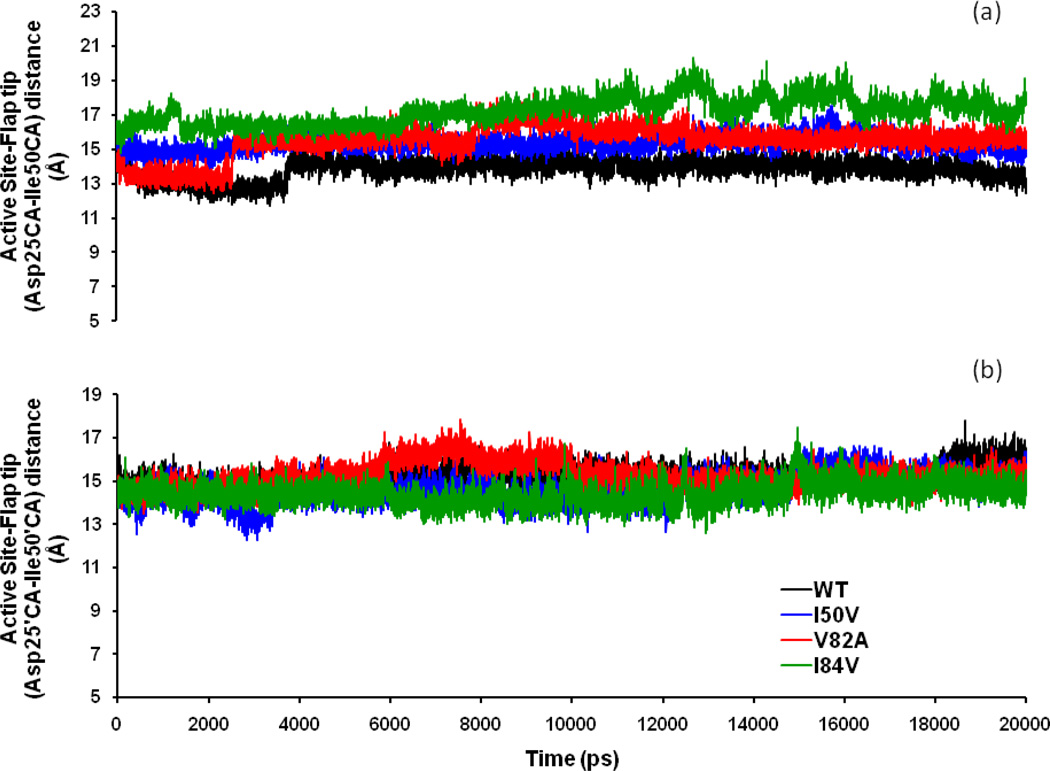
The Asp25 (and Asp25’)-Ile50 (and Ile50’) distances were calculated and the observed results were compared. It was found that, for chain A the trajectory was more fluctuative compared with that for chain-B. Although the WT, I50VPR, V82APR and I84VPR mutant trajectories have significant overlaps, some differences can still be observed (Figure 6a). First, the I84VPR mutant has clearly different values than the WT, I50VPR and is partly overlapped with the V82APR mutant at around 6 ns and 8.0 to 10 ns. Second, the WT and V82APR mutant have two and three phase increment. V82APR distance runs parallel to WT up to 2.5ns and then it jumps to a higher value where it runs parallel to the I50VPR values up to 8.0 ns. The V82APR trajectory then continues at a higher range and from 12 ns onwards goes overlapped with I50VPR. Moreover, the I84VPR mutant trajectory has always a higher value in the range of 16–20 Å. The mean and SD of WT (I50VPR) are 13.81 (15.32) Å and 0.58 (0.45) Å, respectively; whereas for the mutant V82APR (I84VPR), the mean and SD are 15.51 (17.22) and 0.93 (0.80) Å, respectively. The mean of the distribution for I84VPR is larger by 3.41 Å than WT, 1.90 Å than I50VPR and 1.71 Å than V82APR. Furthermore, chain-B (Figure 6b) displays considerable overlapped sampling for all the SWCNT-protease complexes except around 6–8 ns. The mean and SD of WT (I50VPR) are 15.24 (14.64) Å and SD is 0.48 (0.66) Å, respectively. Whereas, for the mutant V82APR (I84VPR), the mean and SD are 15.21 (14.42) Å and 0.60 (0.51) Å, respectively. Thus, the mean of the distribution for V82APR in chain B differ by 0.03 Å from WT, 0.57 Å from I50VPR and 0.79 Å from I84VPR. This indicates that in the SWCNT-bound state, the distance between the flap tips and the active site did not differ significantly on mutation for chain-B. However, for chain-A, there is substantial difference between the distributions. The larger active site-flap distance for I84VPR mutants makes the active site cavity more spacious as compared to the WT.
Figure 6.
Time-series plot of the Active site to flap tip distances (a) Asp25-Ile50 distance in chain-A and (b) Asp25’-Ile50’ distance in chain-B for WT, I50VPR, V82APR and I84VPR mutant simulations of the SWCNT complexed proteins.
3.4. Inhibitor-Protein interaction (SWCNT-Asp25 distances)
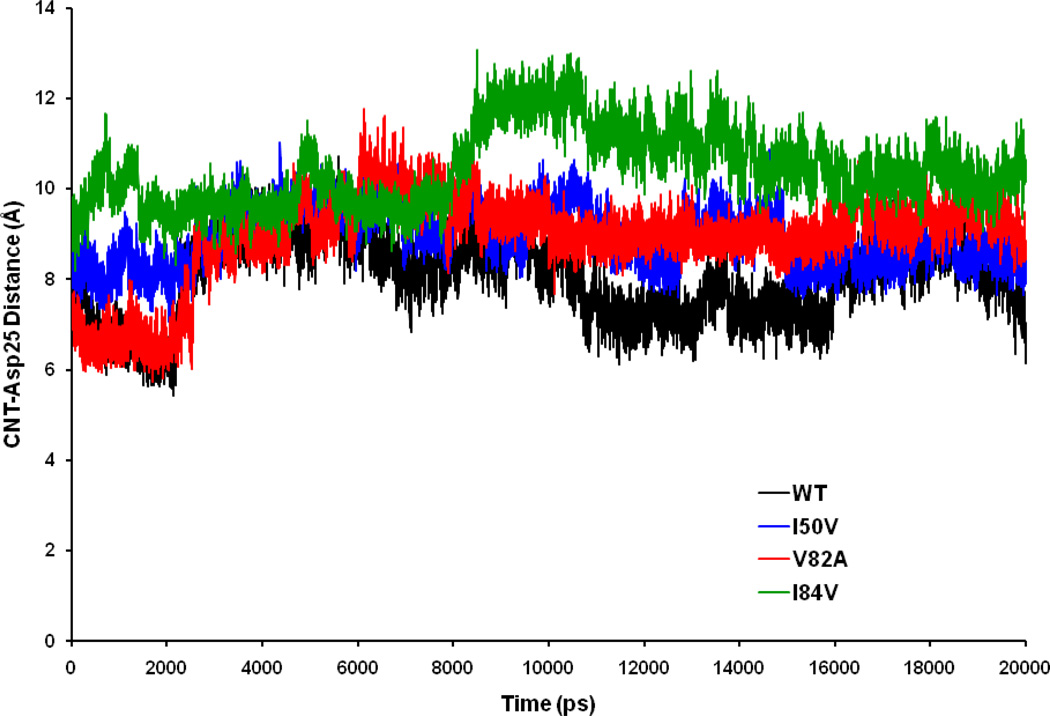
Displacement of the inhibitor to the active site of the protein is coupled with the complex motion of the entire protein. To get the protein-SWCNT interactions, we have followed a simple way by calculating the average distance between the Cα of the two catalytic Asp (Asp25 and Asp25’) residues and to the center of mass (COM) of the SWCNT (Figure 7). Time-series plot for the interactions shows that the four trajectories run parallel to each other in a range from 5Å to 11Å. The mean for the SWCNT-Asp25 distance in WT-SWCNT complex is 8.03Å, for I50VPR-SWCNT is 8.94Å, for V82APR-SWCNT complex is 8.92Å and for I84VPR-SWCNT complex is 10.42 Å with their respective standard deviation (SD) of 0.89Å, 0.63Å 0.99Å and 0.83 Å. The obtained result signifies that the SWCNT tries to fit properly inside the active site cavity in all four complexes in the first 2.5 ns, and then accommodates well inside the cavity. However, from around 9.0 ns, the distance between the catalytic site and the COM of SWCNT increases up o 13 Å. But, interestingly the SWCNT didn’t come out of the active site cavity and eventually remain inside until the end of 20 ns trajectory. The fluctuation of SWCNT in I84VPR active site is more than WT, I50VPR and V82APR, which may be due to the larger active site volume. The 20 ns trajectory confirms that the SWCNT is able to stably swell in the cavity.
Figure 7.
Time-series plot for the protein–inhibitor (Asp25-SWCNT) distance.
3.5. Analysis of the TriCa (Gly49-Ile50-Gly51)Cα Angle
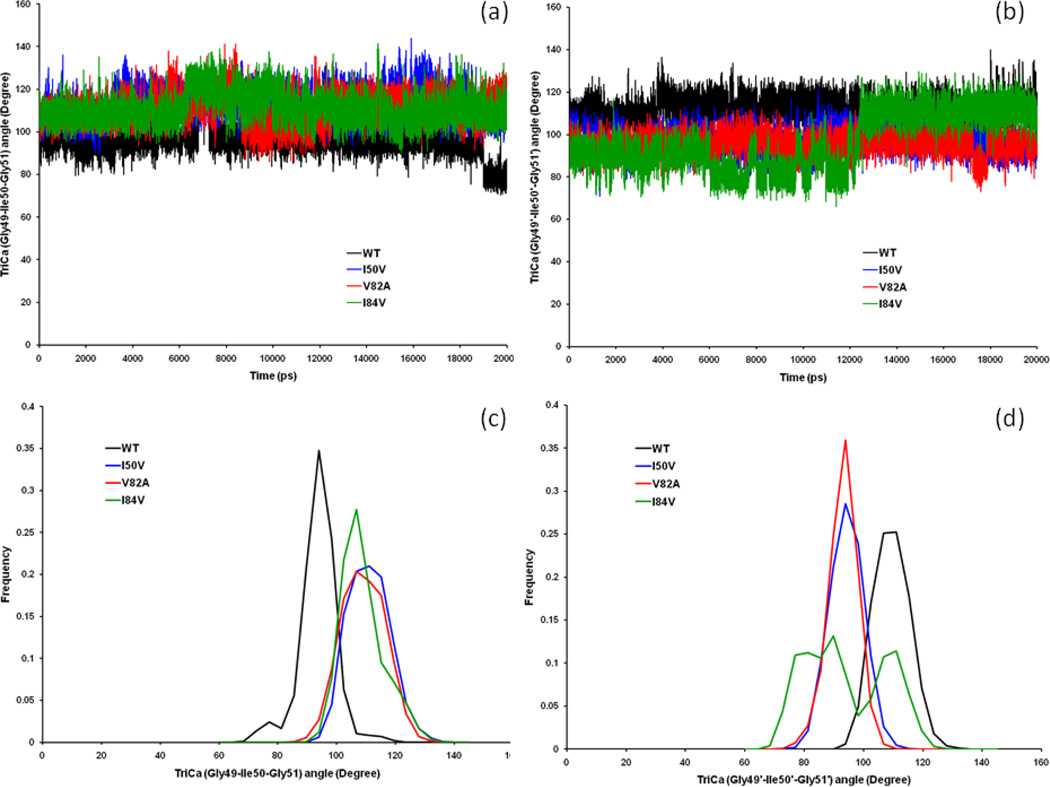
The TriCa-A (Gly49-Ile50-Gly51)Cα in chain-A and TriCa-B (Gly49’-Ile50’-Gly51’)Cα angles in chain-B in the flap tip region for all four WT, I50VPR, V82APR and I84VPR complexes were also analyzed. As shown in the Figures 8a and 8c, the time-series plot for the TriCa-A angle shows that, all three mutant complexes have significant overlapping as compared to the WT-SWCNT complex. Looking at the distribution plot for the TriCa-A angle, we observed that all the SWCNT/HIV-PR complexes have a single peak. The distribution for WT is quite different as compared to the mutant structures, where all the three mutant complexes are partially overlapped and is clearly different from the WT. The mean of I50VPR, V82APR and I84VPR are 113.07°, 111.24° and 110.89° and SD are 7.01°, 7.38° and 7.16° respectively. Whereas, for the WT, the mean and SD are 95.85° and 6.36° respectively. Thus, the mean values of I50VPR, V82APR and I84VPR are larger than those of the WT-SWCNT complex by 17.22°, 15.39° and 15.04°, which implies the more curling out of the flap tips in mutants than in the WT. However, the general pattern of the distribution frequency remains the same in all the SWCNT bound complexes of the protein. By analyzing to the distribution plot for the TriCa-B angle (Figures 8b & 8d), it observed that the I50VPR, V82APR and I84VPR mutants also has wide overlapping as compared to the WT distribution. However, it was found that there only a single peak exists for all complexes except the I84VPR complex, where there exist 2–3 different peaks suggesting a different range of conformations for the said angle. The WT distribution is quite different as compared to the mutant structures, where I50VPR and V82APR mutant partially overlapped and is clearly different from WT. However, the I84VPR mutant has lower values in the first 13 ns and is partially overlapped with the other mutants, after which it jumps to a higher range where it remain overlapped with all other complexes. The mean and SD of the TriCa-B angle for WT distribution is 111.57° and SD is 5.94°. For mutant I50VPR, the mean and SD are 96.41° and 5.61°, respectively. Whereas for the V82APR (I84VPR) mutants, the mean and SD are 95.21° (96.33°) and 4.91°(13.48°). Therefore the mean of the three distributions of I50VPR, V82APR and I84VPR differ by 15.16°, 16.36° and 15.24° respectively from that of WT complex.
Figure 8.
Time-series plot of (a) the Gly48–Gly49–Ile50 TriCa angles and of (b) the Gly49’–Ile50’–Gly51’ TriCa angles of the CSWNT bound WT, I50VPR, V82APR and I84VPR mutant HIV-PR complexes. Histogram distributions of Gly48–Gly49–Ile50 TriCa angles (c); and of Gly49’–Ile50’–Gly51’ TriCa angles (d) for WT and all mutant HIV-pr simulation of the SWCNT-bound protein.
3.6 Binding Free Energies
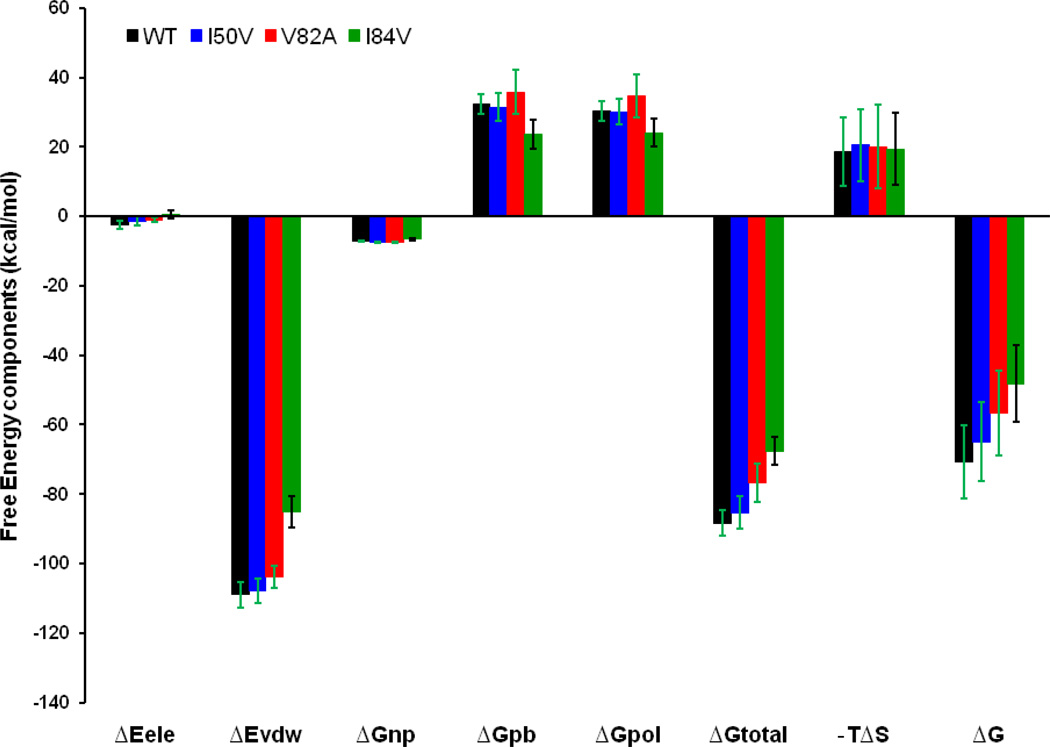
In order to get insights into the different contributions to the binding of the SWCNT to WT, I50VPR,V82APR and I84VPR mutant, absolute binding free energies are calculated for all the complexes using the MM-PBSA method. Contributions of the binding free energies are summarized in the Table 1 and Figure 9. The binding free energies of WT, I50VPR, V82APR and I84VPR complexes are −70.85, −64.88, −56.65 and −48.22 kcal/mol, respectively. This suggests the binding free energy of SWCNTs for all four complexes are considerably higher than the binding affinities of the TMC114 to WT (−15.33), I50VPR (−10.88), [39] V82APR (−12.20) and I84VPR (−11.66).[40] For all of three mutants their bindings to the SWCNT show decrease to different extent, and as compared to the WT complex the binding energies decrease by 5.97, 14.20, and 22.63 kcal/mol for the I50V, V82APR and I84VPR mutants, respectively. These changes may not greatly affect the binding, as the SWCNT can tightly interact with the protein and the overall binding affinities for these mutants to SWCNT are still a few folds higher than the most recent inhibitor Darunavir (TMC114).[39–40] The present binding energy (−70.85 kcal/mol) between the WT and the (3,3) SWCNT with a length of 18.5 and a diameter of 4.0 Å is not as high as that of Cheng et al., the binding free energy of −120.5 kcal/mol for a SWCNT (5,5) with a length of 24.0Å and diameter of 6.8Å.[19] The comparison of the calculated and available experimental binding free energies for a list of FDA approved inhibitors and those with the available nano-material based HIV-1-PR inhibitors are listed in Table 2, which shows that SWCNTs have greater binding affinities and may significantly bind to the active site and flap tip regions.
Table 1.
Binding free energy components for the HIV-PR/SWCNT complex by using the MM-PBSA method. (From 50 snapshots of 19th and 20th ns)
| Component[a] | WT | I50V | V82A | I84V | ||||
|---|---|---|---|---|---|---|---|---|
| Mean | Stdb | Mean | Stdb | Mean | Stdb | Mean | Stdb | |
| ΔEele | −2.46 | 1.17 | −1.33 | 1.30 | −1.09 | 0.63 | 0.57 | 1.13 |
| ΔEvdw | −109.0 | 3.76 | −107.9 | 3.59 | −103.9 | 3.23 | −85.14 | 4.39 |
| ΔGnp | −7.23 | 0.10 | −7.43 | 0.20 | −7.45 | 0.17 | −6.57 | 0.32 |
| ΔGpb | 32.39 | 2.79 | 31.37 | 4.07 | 35.77 | 6.37 | 23.52 | 4.21 |
| ΔGpol | 30.38 | 2.90 | 30.05 | 3.71 | 34.67 | 6.29 | 24.09 | 3.97 |
| ΔGtotal | −88.35 | 3.78 | −85.34 | 4.76 | −76.72 | 5.41 | −67.62 | 3.97 |
| −TΔS | 18.50 | 9.85 | 20.46 | 10.47 | 20.07 | 11.10 | 19.40 | 10.38 |
| ΔG(SWCNT) | −70.85 | −64.88 | −56.65 | −48.22 | ||||
| ΔG(TMC114) | −15.33c | −10.88c | −12.20d | −11.66d | ||||
All values are given in kcal/mol.
Component: ΔEele: Electrostatic energy in the gas phase; ΔEvdw: van der Waals energy; ΔEint: internal energy; ΔGnp: non-polar solvation energy; ΔGpb: polar solvation energy; ΔGpol: ΔGele + ΔGpb; TΔS: Total entropy contribution; ΔGtotal = ΔEele + ΔEvdw + ΔEint + ΔGpb + ΔGnp; ΔG = ΔGtotal − TΔS.
Standard error of mean values.
Calculated binding free energies obtained from Meher et al. [Ref.39]
Experimental binding free energies were calculated from Ki = 1.3 and 3.2 nM. [Ref.24]
Figure 9.
Energy components (kcal/mol) for the binding of SWCNT to the WT, I50VPR, V82APR and I84VPR mutant. ΔEele, electrostatic energy in the gas phase; ΔEvdw, van der Waals energy; ΔGnp, nonpolar solvation energy; ΔGpb, polar solvation energy; ΔGpol = ΔEele + ΔGpb; TΔS, total entropy contribution; ΔGtotal = ΔEele + ΔEvdw + ΔEint + ΔGpb; ΔG = ΔGtotal − TΔS. Error bars in green solid line indicates the difference in WT, I50VPR and V82APR, while error bars in black solid line indicates the difference in I84VPR.
Table 2.
Comparison of calculated with experimental Binding free energies of FDA approved HIV-PR inhibitors and some of the nano-material based HIV-PR inhibitors.
| Name | WT | I50V | V82A | I84V | ||||
|---|---|---|---|---|---|---|---|---|
| Theory | Expt. | Theory | Expt. | Theory | Expt. | Theory | Expt. | |
| SWCNT(3,3) | −70.85 | - | −64.88 | - | −56.65 | - | −48.22 | - |
| SWCNT(5,5) | −120.55(±29.26)r | - | - | - | - | - | - | - |
| Fullerene C60 | −1.25p | 8−11q | ||||||
| Darunavir | −15.33a | −15.20i | −10.88a | −11.90f | −12.20c | −11.66c | ||
| Amprenavir | −9.83 −20.02h −15.10 |
−13.20k | −12.6d | −11.4e | −14.0d | −12.3e | ||
| Saquinavir | −11.37 | −14.24j | ||||||
| Indinavir | −11.29 | −13.24l | 0.79b | |||||
| Nelfinavir | −11.18 | −12.34m | ||||||
| Lopinavir | −12.69 | −14.30o | ||||||
| Ritonavir | −11.51 | −14.84n | ||||||
| Tipranavir | −11.49 | −14.60o | ||||||
| Atazanavir | −27.77g | −14.30o | −18.52g | |||||
All values are given in kcal/mol.
Meher et al. [39];
Mahalingam et al. [42];
Tie et al. [40];
Kar & Knecht [43];
Shen et al. [44];
Kovalevsky et al. [22];
Alcaro et al.[45];
Ref[46];
Ref.[47];
Ref.[48];
Ref.[49];
Ref. [50];
Ref. [51];
Ref. [52];
Ref. [53];
Ref. [20];
Ref. [3];
Ref. [19]
Comparisons of the free energy components between the WT complex and the mutant complexes are carried out to elucidate the interaction mechanism. In accordance with the energy components of the binding free energy in Table 1 and Figure 9, for all the four HIV-1-PR/SWCNT complexes, the van der Waals energies in the gas phase provide the dominant favorable contributions to the binding. Non-polar solvation energies (ΔGnp), resulting from the interment of SWCNT solvent accessible surface area, also have similar small favorable contributions to the binding affinity in all of the four cases. The relatively small non-polar solvation energies indicate that the packing of the cavity region is quite closed in all the systems. On the contrary, polar solvation energies (ΔGpb) of the HIV-1-PR and entropy components (−TΔS) bring about the unfavorable contribution to their binding. The entropy term (−TΔS) for the three mutated HIV-1-PRs is rather close (19.40~20.46kcal/mol), yet slightly higher than that for the WT HIV-1-PR. SWCNTs have a significantly strong binding affinity for both WT and mutant HIV-1-PR due to their direct vdw interactions with the residues of the protease.
A close inspection of Table 1 and Figure 9 reveals that as compared to the case of WT almost every component of the binding free energy for the investigated mutant HIV-1-PRs exhibits a decrease to different extent. The I50VPR mutation shows a binding decrease due to ΔEvdw by about 1.1 kcal/mol, ΔEele by 1.13 kcal/mol, ΔGpb by 1.02 kcal/mol, and -ΔTS by 1.96 kcal/mol relative to the WT. For the V82APR and I84VPR mutants ΔEvdw shows a similar, yet significant decrease by 5.1 and 23.8 kcal/mol respectively, which are dominantly responsible for the decrease in binding affinities. However, solvation of the V82APR is much stronger than that of the I84VPR (ΔGpb, 35.7 vs 23.5 kcal/mol). Thus, despite the big differences in ΔEvdw and ΔGpb the total binding affinity of the I84VPR is lower than that of the V82APR by 8.4 kcal/mol (−48.22 vs −56.65 kcal/mol).
3.7. Structure-affinity relationship analysis
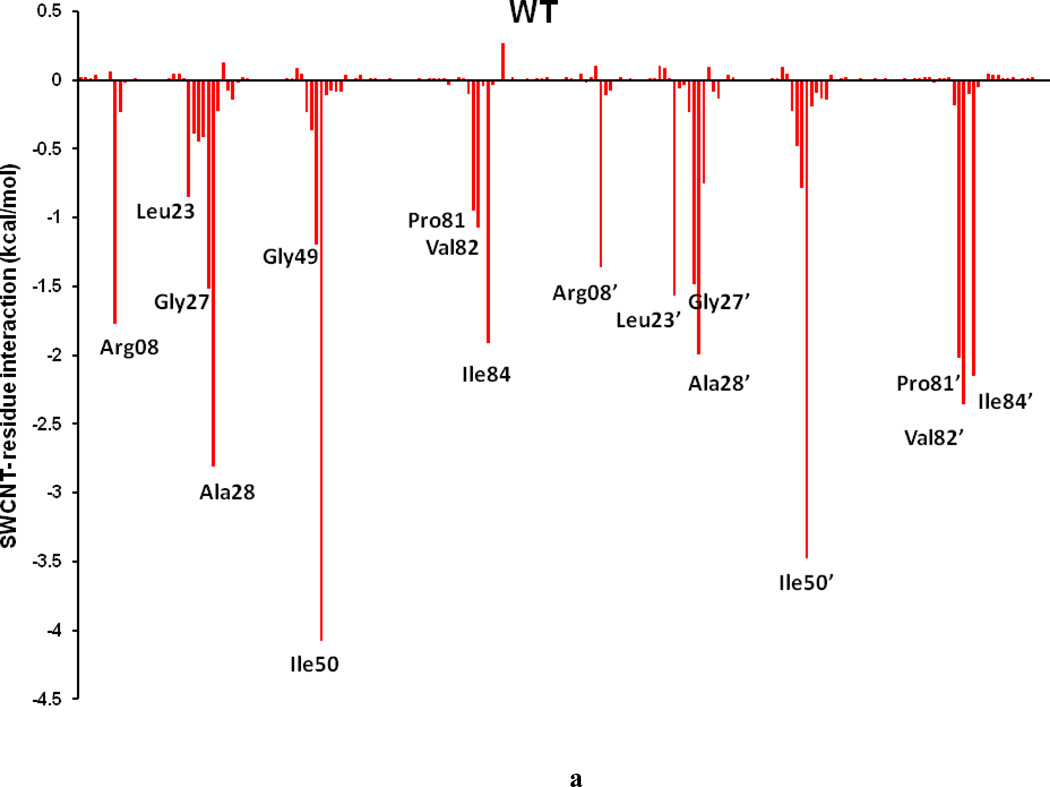
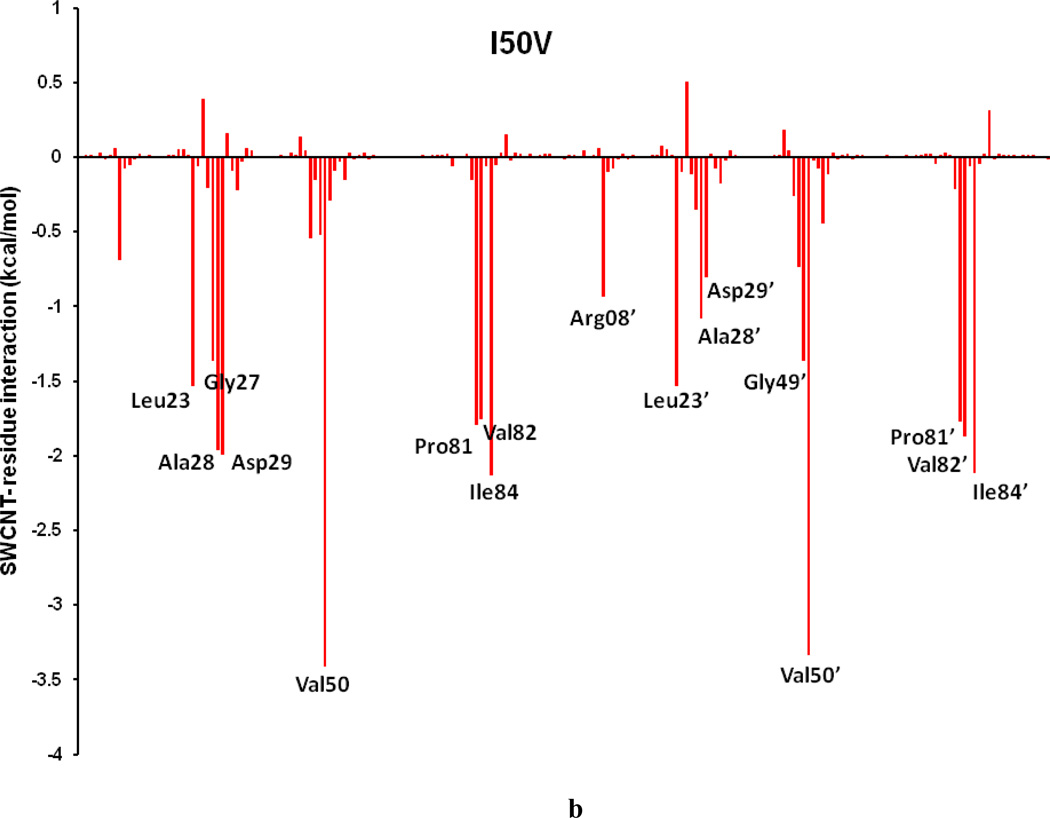
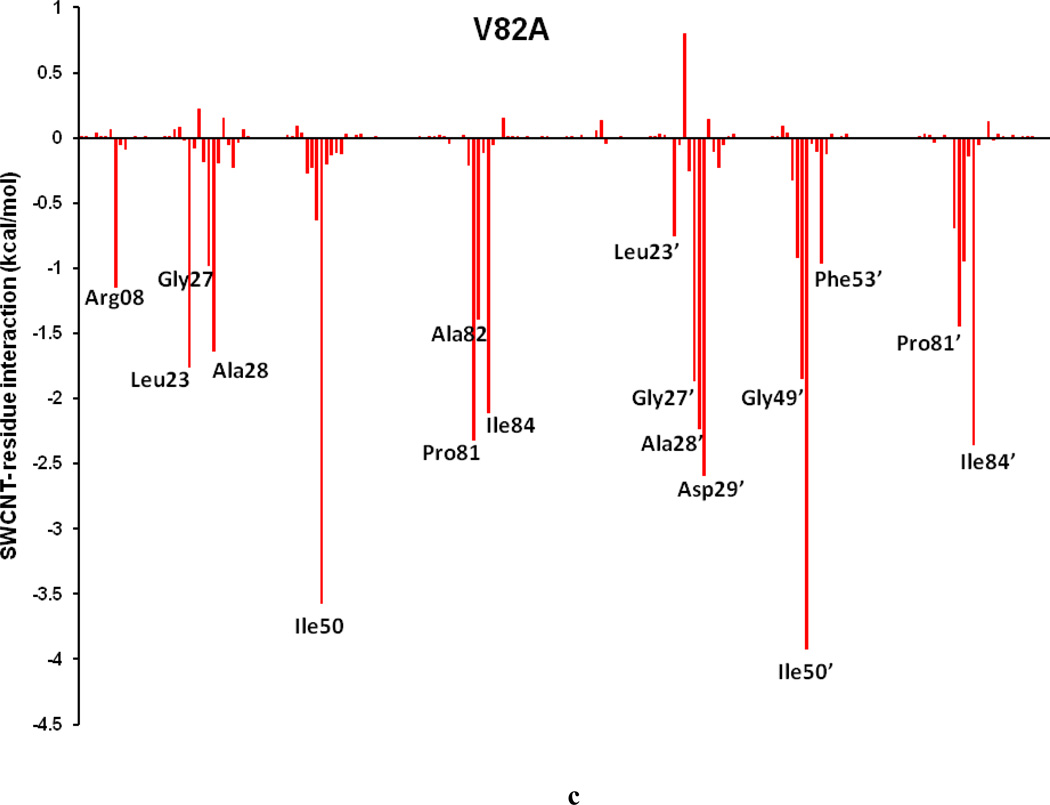
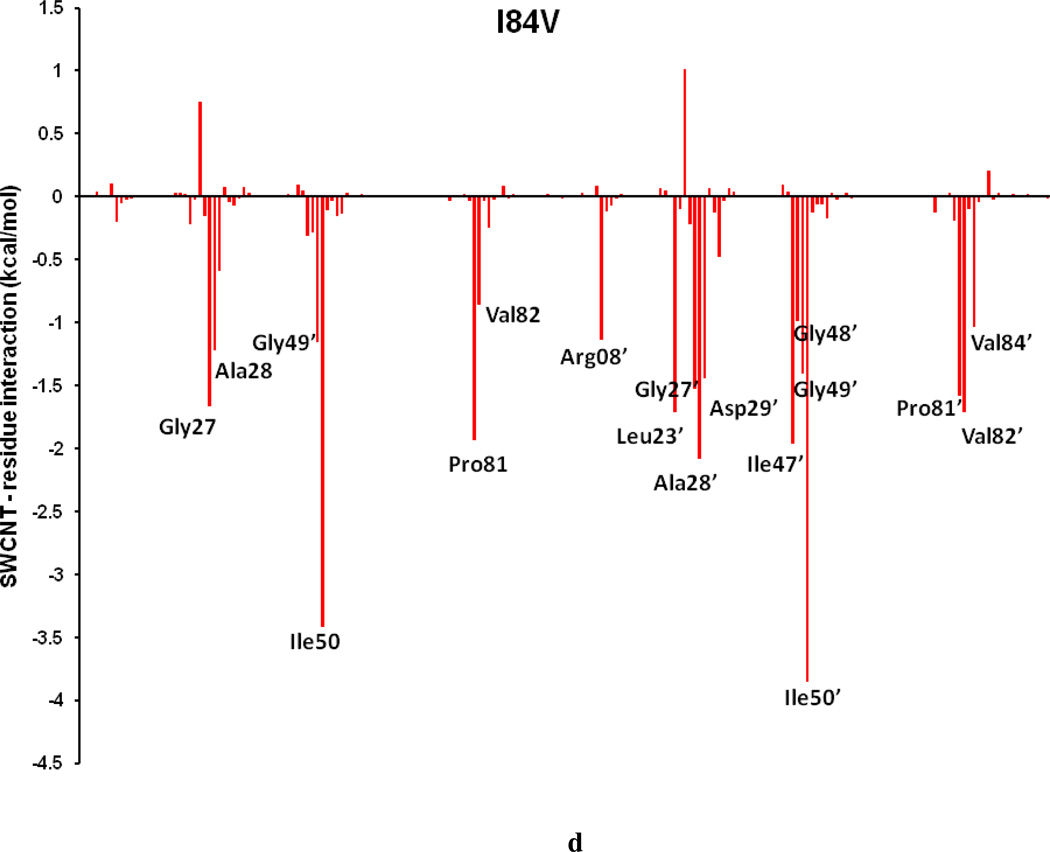
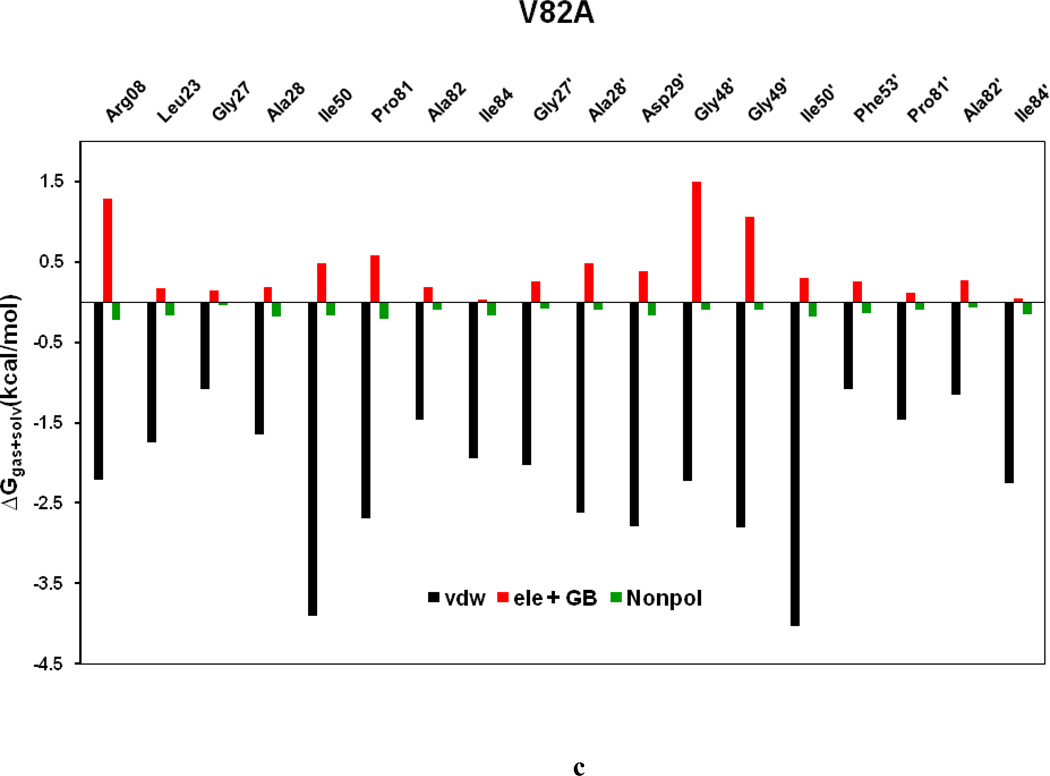
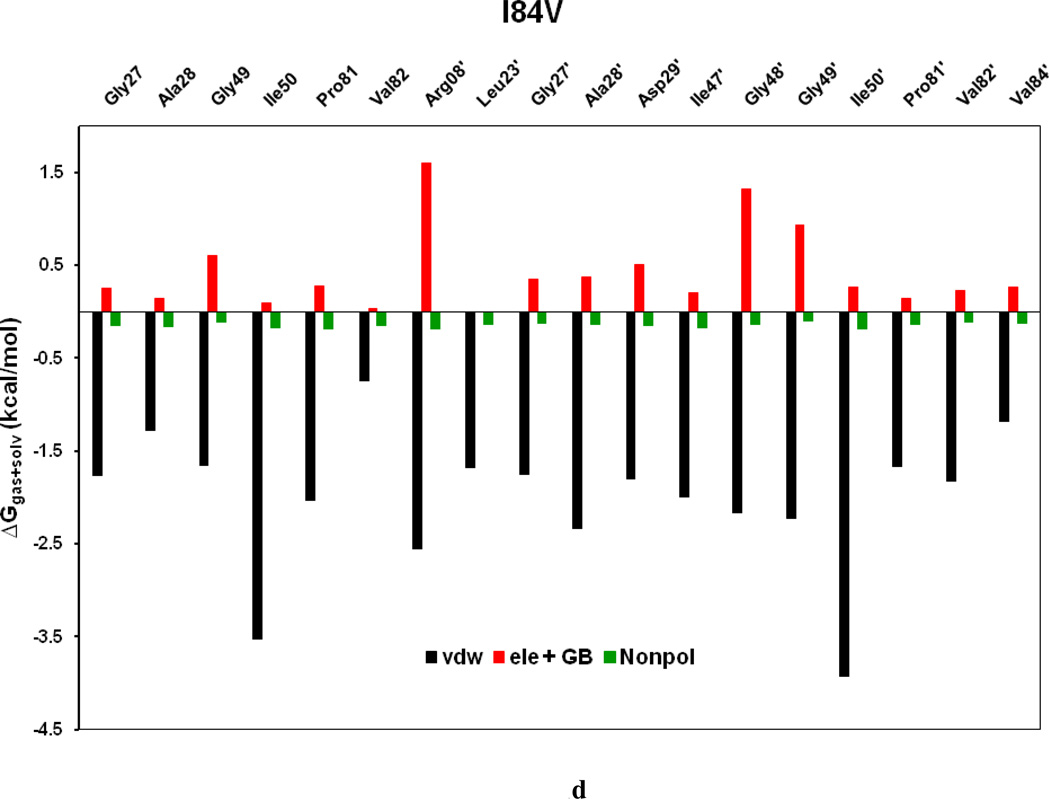
To comprehend the effect of the WT and three HIV-PR mutants on the SWCNT as the prospective inhibitor, the analysis of structure and binding mode has been accomplished. The binding free energy was decomposed into inhibitor-residue pairs to create an inhibitor-residue interaction spectrum as shown in Figures 10a–d. The approach of residue decomposition method is tremendously useful to clarify the drug-resistant mechanism at a molecular level and also helpful to locate contribution of individual residue to the protein-inhibitor interactions too. [41] Figures 10a–d show that, the general patterns in the interaction spectra of four HIV-PR/SWCNT complexes are similar, albeit there exists a difference in individual residue interaction spectrum. In general the major interactions come from twelve groups around Arg08/Arg08’, Leu23/Leu23’, Gly27/Gly27’, Ala28/Ala28’, Ile50/Ile50’, and Ile84/Ile84’, consisting of at least 17 residues in total. Remarkably, the tight bindings with the flap (Ile50/Ile50’), active site and active site wall regions (Leu23/Leu23’, Gly27/Gly27’, Ala28/Ala28’ and Ile84/Ile84’) are favorable to the SWCNT as a protease inhibitor. For the HIV-1-PR/SWCNT complexes, there are a few more residues around Leu23/Leu23’ than the case of HIV-1-PR/TMC114 with significant interactions.[39]
Figure 10.
Decomposition of ΔG on a per-residue basis for the HIV-PR/SWCNT complex: (a) WT, (b) I50VPR, (c) V82APR and (d) I84VPR.
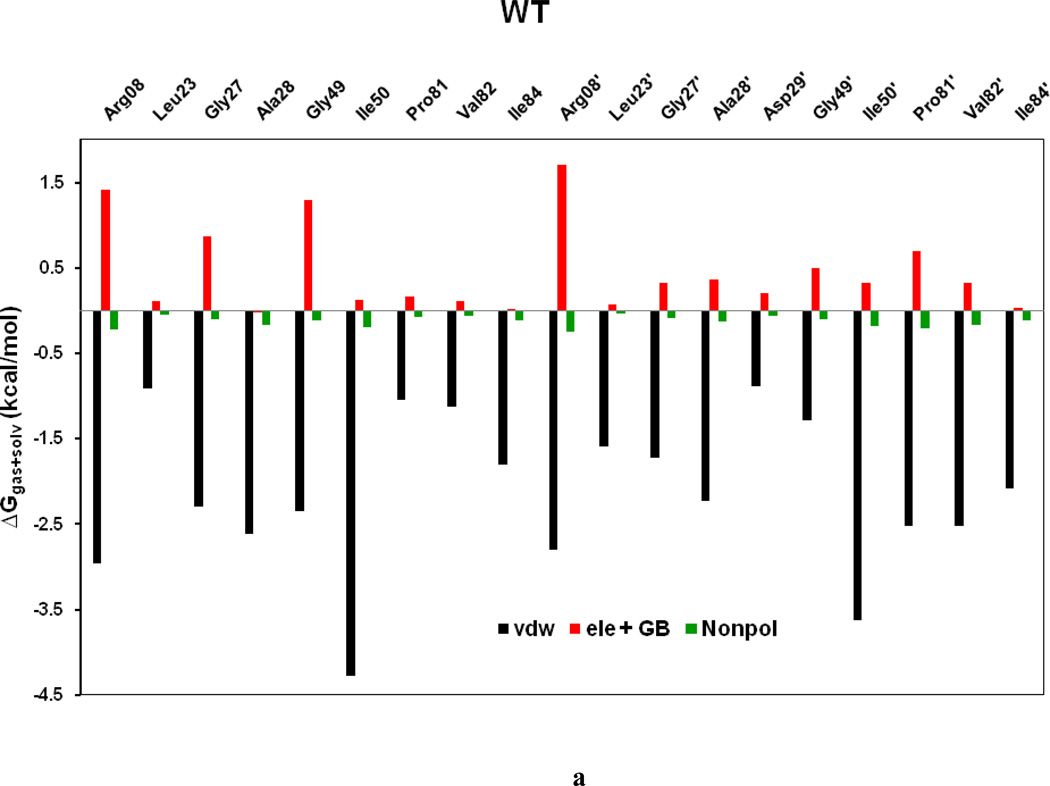
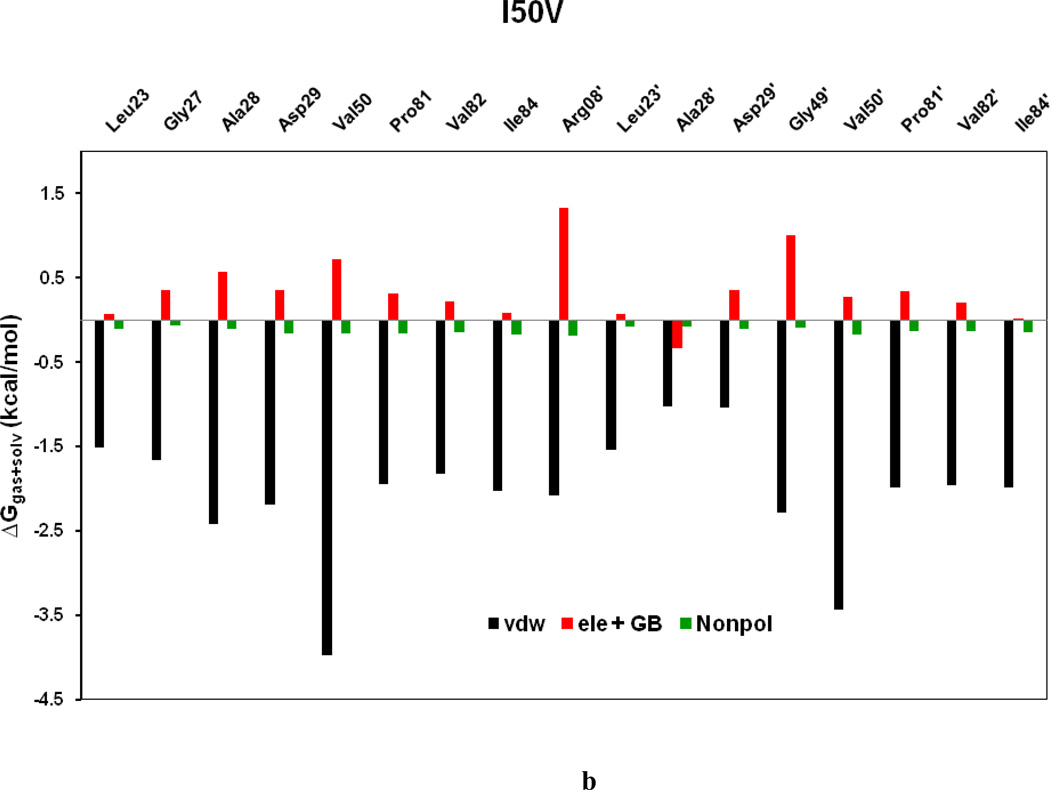
Figure 11a–d shows the decomposition of ΔG values on a per-residue basis into contributions from ΔEvdw, the sum of electrostatic energy in the gas phase and polar solvation energy (ΔGpol= ΔEele + ΔGpb), and non-polar-solvation energy for residues with |ΔG | ≥ 1.0 kcal/mol for all the four HIV-1-PR/SWCNT complexes. Table 3 further represents the contributions of per residue from backbone and the side-chain atoms. For all residues shown in Figure 11a–d and Table 3 the major driving force for the binding of SWCNT to HIV-PR is van der Waals, and comparatively a little bit of non-polar solvation energies, which agrees very well with Figure 9; however, the unfavorable polar solvation energies cancel out the net binding energies due to their solvation in aqueous solution. Residues like Arg08/Arg08’, Gly27, Gly48’, Gly49/Gly49’ and Pro81’have rather high unfavorable polar solvation energies with ≥ 0.5 kcal/mol. Taking the WT as an example, we again examined the interactions between the main residues and the SWCNT. For most of the interesting residues including the Arg08/Arg08’, those from active site region (Leu23/Leu23’, Gly27/Gly27’, Ala28/Ala28’), the key force that directs the binding of SWCNT to the HIV-PR includes ΔEvdw and ΔGnopol. Residues in the flap tip regions like Gly49(49’) and Ile50(Ile50’) have strong binding in terms of ΔEvdw with −2.35(−1.29) and −4.28(−3.62) kcal/mol, respectively, and with small favorable non-polar solvation energies. Residues in the active site wall region including the Pro81(Pro81’), Val82(Val82’) and Ile84(Ile84’) also have significant ΔEvdw energies with −1.05(−2.52), −1.12(−2.52) and −1.80(−2.08) kcal/mol, respectively. The van der Waals for the HIV-PR-1/SWCNT is most likely due to the cooperative C/N-H…π interactions between the SWCNT and the protease residues.
Figure 11.
Decomposition of ΔG on a per-residue basis into contributions from the van der Waals energy (vdw), the sum of electrostatic interactions and polar solvation energy (ele + GB), and nonpolar solvation energy (nonpol) for the residues of |ΔG| ≥ 1.0 kcal/mol: (a) WT, (b) I50VPR, (c) V82APR and (d) I84VPR complexes.
Table 3.
Decomposition of ΔG on a per-residue basis (GB) a
| Residue | Svdw | Bvdw | Tvdw | Sele | Bele | Tele | SGB | BGB | TGB | TSUR | TGBTOT |
|---|---|---|---|---|---|---|---|---|---|---|---|
| WT-SWCNT | |||||||||||
| Arg08 | −2.82 | −0.14 | −2.96 | −1.41 | 0.03 | −1.38 | 2.74 | 0.06 | 2.80 | −0.22 | −1.77 |
| Leu23[b] | −0.80 | −0.11 | −0.91 | 0.01 | −0.01 | 0.00 | 0.07 | 0.04 | 0.11 | −0.05 | −0.85 |
| Gly27 | 0.00 | −2.29 | −2.29 | 0.00 | −0.17 | −0.17 | 0.00 | 1.04 | 1.04 | −0.10 | −1.51 |
| Ala28 | −0.83 | −1.79 | −2.62 | −0.01 | −0.03 | −0.04 | −0.04 | 0.06 | 0.02 | −0.17 | −2.81 |
| Gly49 | 0.00 | −2.35 | −2.35 | 0.00 | −0.23 | −0.23 | 0.00 | 1.52 | 1.52 | −0.12 | −1.19 |
| Ile50 | −2.45 | −1.83 | −4.28 | 0.00 | −0.23 | −0.23 | 0.11 | 0.24 | 0.35 | −0.19 | −4.07 |
| Pro81[b] | −0.82 | −0. 23 | −1.05 | 0.15 | −0.05 | 0.10 | 0.04 | 0.03 | 0.07 | −0.07 | −0.95 |
| Val82 | −0.93 | −0. 19 | −1.12 | 0.03 | −0.08 | −0.05 | 0.04 | 0.12 | 0.16 | −0.06 | −1.07 |
| Ile84 | −1.67 | −0.13 | −1.80 | 0.06 | −0.03 | 0.03 | −0.05 | 0.04 | −0.01 | −0.12 | −1.91 |
| Arg08’ | −2.73 | −0.07 | −2.80 | 0.54 | 0.01 | 0.55 | 1.09 | 0.06 | 1.15 | −0.25 | −1.36 |
| Leu23’ | −1.48 | −0.11 | −1.59 | 0.07 | −0.04 | 0.03 | 0.01 | 0.03 | 0.04 | −0.04 | −1.56 |
| Gly27’ | 0.00 | −1.72 | −1.72 | 0.00 | 0.23 | 0.23 | 0.00 | 0.09 | 0.09 | −0.09 | −1.48 |
| Ala28’ | −0.69 | −1.54 | −2.23 | 0.00 | 0.09 | 0.09 | −0.05 | 0.32 | 0.27 | −0.13 | −1.99 |
| Asp29’[b] | −0.38 | −0.51 | −0.89 | −0.02 | −0.01 | −0.03 | 0.19 | 0.04 | 0.23 | −0.06 | −0.75 |
| Gly49’[b] | 0.00 | −1.29 | −1.29 | 0.00 | 0.12 | 0.12 | 0.00 | 0.50 | 0.50 | −0.10 | −0.88 |
| Ile50’ | −2.32 | −1.30 | −3.62 | 0.08 | −0.08 | 0.00 | 0.03 | 0.30 | 0.33 | −0.18 | −3.47 |
| Pro81’ | −1.49 | −1.03 | −2.52 | 0.27 | −0. 16 | 0.11 | −0.05 | 0.44 | 0.39 | −0.21 | −2.02 |
| Val82’ | −1.88 | −0.64 | −2.52 | 0.14 | −0.13 | 0.01 | 0.10 | 0.22 | 0.32 | −0.17 | −2.35 |
| Ile84’ | −1.94 | −0.14 | −2.08 | 0.07 | −0.06 | 0.01 | −0.03 | 0.05 | 0.02 | −0.11 | −2.15 |
| I50V-SWCNT | |||||||||||
| Leu23 | −1.41 | −0.10 | −1.51 | 0.05 | −0.05 | 0.00 | 0.02 | 0.05 | 0.07 | −0.10 | −1.53 |
| Gly27 | 0.00 | −1.66 | −1.66 | 0.00 | −0. 03 | −0. 03 | 0.00 | 0.39 | 0.39 | −0.06 | −1.36 |
| Ala28 | −0.77 | −1.65 | −2.42 | −0.01 | 0.11 | 0.10 | −0.05 | 0.52 | 0.47 | −0.11 | −1.96 |
| Asp29 | −1.29 | −0.90 | −2.19 | −0.99 | −0.07 | −1.06 | 1.24 | 0.18 | 1.42 | −0.16 | −1.99 |
| Val50 | −2.10 | −1.87 | −3.97 | 0.05 | −0.11 | −0.06 | 0.30 | 0.48 | 0.78 | −0.16 | −3.41 |
| Pro81 | −1.45 | −0. 50 | −1.95 | 0.19 | −0.03 | 0.16 | 0.04 | 0.12 | 0.16 | −0.16 | −1.79 |
| Val82 | −1.40 | −0.43 | −1.83 | 0.06 | −0. 10 | −0.04 | 0.07 | 0.19 | 0.26 | −0.15 | −1.75 |
| Ile84 | −1.89 | −0.15 | −2.03 | 0.08 | −0.05 | 0.03 | −0.02 | 0.07 | 0.05 | −0.17 | −2.13 |
| Arg08’[b] | −2.02 | −0.06 | −2.08 | 0.21 | 0.03 | 0.24 | 1.04 | 0.05 | 1.09 | −0.18 | −0.93 |
| Leu23’ | −1.43 | −0.11 | −1.54 | 0.08 | −0.04 | 0.03 | −0.01 | 0.05 | 0.04 | −0.08 | −1.53 |
| Ala28’ | −0.08 | −0.95 | −1.03 | −0.01 | 0.07 | 0.06 | −0.01 | −0.03 | −0.4 | −0.08 | −1.08 |
| Asp29’[b] | −0.69 | −0.35 | −1.04 | −0.04 | −0.07 | −0.11 | 0.47 | −0.01 | 0.46 | −0.10 | −0.85 |
| Gly49’ | 0.0 | −2.28 | −2.28 | 0.0 | −0.09 | −0.09 | 0.0 | 1.1 | 1.1 | −0.09 | −1.36 |
| Val50’ | −1.91 | −1.53 | −3.44 | −0.09 | 0.06 | −0.03 | 0.18 | 0.13 | 0.31 | −0.17 | −3.33 |
| Pro81’ | −1.49 | −0.49 | −1.98 | 0.20 | −0.06 | 0.14 | 0.12 | 0.08 | 0.20 | −0.13 | −1.77 |
| Val82’ | −1.56 | −0.40 | −1.96 | 0.08 | −0.09 | −0.01 | 0.06 | 0.17 | 0.22 | −0.13 | −1.87 |
| Ile84’ | −1.85 | −0.14 | −1.99 | 0.08 | −0.05 | 0.03 | −0.06 | 0.05 | −0.01 | −0.15 | −2.11 |
| V82A-SWCNT | |||||||||||
| Arg08 | −2.14 | −0.07 | −2.21 | 0.25 | 0.03 | 0.28 | 0.95 | 0.05 | 1.00 | −0.22 | −1.15 |
| Leu23 | −1.64 | −0.11 | −1.75 | 0.07 | −0.02 | 0.05 | 0.07 | 0.05 | 0.12 | −0.16 | −1.76 |
| Gly27[b] | 0.0 | −1.08 | −1.08 | 0.0 | 0.12 | 0.12 | 0.00 | 0.02 | 0.02 | −0.04 | −0.98 |
| Ala28 | −0.68 | −0.96 | −1.65 | −0.01 | 0.11 | 0.10 | −0.04 | 0.13 | 0.08 | −0.18 | −1.64 |
| Ile50 | −2.32 | −1.58 | −3.90 | 0.09 | −0.11 | −0.02 | 0.13 | 0.37 | 0.50 | −0.16 | −3.57 |
| Pro81 | −1.71 | −0. 98 | −2.69 | 0.22 | −0.14 | 0.08 | −0.01 | 0.51 | 0.50 | −0.21 | −2.32 |
| Ala82 | −0.77 | −0. 70 | −1.47 | 0.01 | −0.04 | −0.03 | −0.02 | 0.23 | 0.21 | −0.10 | −1.39 |
| Ile84 | −1.83 | −0.12 | −1.95 | 0.09 | −0.07 | 0.02 | −0.06 | 0.07 | 0.01 | −0.17 | −2.12 |
| Gly27’ | 0.00 | −2.03 | −2.03 | 0.00 | −0.08 | −0.08 | 0.00 | 0.34 | 0.34 | −0.08 | −1.86 |
| Ala28’ | −0.80 | −1.82 | −2.62 | 0.01 | −0.04 | −0.03 | −0.05 | 0.57 | 0.51 | −0.09 | −2.23 |
| Asp29’ | −1.70 | −1.09 | −2.79 | −0.83 | −0.08 | −0.91 | 0.99 | 0.31 | 1.29 | −0.17 | −2.59 |
| Gly48’[b] | 0.00 | −2.23 | −2.23 | 0.00 | 0.23 | 0.23 | 0.00 | 1.27 | 1.27 | −0.10 | −0.92 |
| Gly49’ | 0.00 | −2.80 | −2.80 | 0.00 | −0.19 | −0.19 | 0.00 | 1.25 | 1.25 | −0.10 | −1.85 |
| Ile50’ | −2.31 | −1.72 | −4.03 | 0.08 | 0.00 | 0.08 | 0.09 | 0.13 | 0.22 | −0.18 | −3.92 |
| Phe53’[b] | −0.97 | −0.11 | −1.08 | 0.02 | 0.01 | 0.03 | 0.15 | 0.08 | 0.23 | −0.14 | −0.96 |
| Pro81’ | −0.94 | −0.53 | −1.47 | −0.04 | −0. 05 | −0.09 | 0.19 | 0.02 | 0.21 | −0.09 | −1.44 |
| Ala82’[b] | −0.29 | −0.86 | −1.15 | −0.02 | −0.08 | −0.10 | 0.01 | 0.36 | 0.37 | −0.07 | −0.94 |
| Ile84’ | −2.04 | −0.21 | −2.25 | 0.08 | −0.03 | 0.05 | −0.04 | 0.04 | 0.00 | −0.15 | −2.35 |
| I84V-SWCNT | |||||||||||
| Gly27 | 0.00 | −1.76 | −1.76 | 0.00 | 0. 00 | 0. 00 | 0.00 | 0.25 | 0.25 | −0.15 | −1.66 |
| Ala28 | −0.32 | −0.96 | −1.28 | −0.01 | 0.11 | 0.10 | −0.01 | 0.14 | 0.13 | −0.16 | −1.21 |
| Gly49 | −0.00 | −1.65 | −1.65 | 0.00 | 0.06 | 0.06 | 0.00 | 0.58 | 0.55 | −0.11 | −1.15 |
| Ile50 | −2.39 | −1.13 | −3.52 | 0.04 | −0.06 | −0.02 | 0.03 | 0.27 | 0.30 | −0.17 | −3.41 |
| Pro81 | −1.57 | −0. 46 | −2.03 | 0.20 | −0.11 | 0.09 | −0.04 | 0.23 | 0.19 | −0.18 | −1.93 |
| Val82[b] | −0.60 | −0.14 | −0.74 | 0.07 | −0.04 | 0.03 | −0.07 | 0.08 | 0.01 | −0.15 | −0.85 |
| Arg08’ | −2.46 | −0.09 | −2.55 | 0.09 | −0.17 | −0.08 | 0.25 | 1.43 | 1.68 | −0.18 | −1.13 |
| Leu23’ | −1.55 | −0.13 | −1.68 | 0.07 | −0.02 | 0.05 | 0.03 | 0.02 | 0.05 | −0.13 | −1.71 |
| Gly27’ | 0.00 | −1.75 | −1.75 | 0.00 | 0.09 | 0.09 | 0.00 | 0.26 | 0.26 | −0.12 | −1.52 |
| Ala28’ | −0.68 | −1.65 | −2.33 | −0.03 | 0.12 | 0.09 | −0.06 | 0.35 | 0.29 | −0.13 | −2.08 |
| Asp29’ | −1.04 | −0.76 | −1.80 | 0.02 | −0.05 | 0.03 | 0.37 | 0.11 | 0.48 | −0.15 | −1.44 |
| Ile47’ | −1.58 | −0.41 | −1.99 | 0.05 | 0.01 | 0.06 | −0.01 | 0.15 | 0.14 | −0.17 | −1.96 |
| Gly48’[b] | 0.00 | −2.16 | −2.16 | 0.00 | −0.09 | −0.09 | 0.00 | 1.41 | 1.41 | −0.14 | −0.98 |
| Gly49’ | 0.00 | −2.23 | −2.23 | 0.00 | −0.21 | −0.21 | 0.00 | 1.14 | 1.14 | −0.10 | −1.40 |
| Ile50’ | −2.37 | −1.55 | −3.92 | 0.04 | −0.07 | −0.03 | 0.11 | 0.18 | 0.29 | −0.19 | −3.85 |
| Pro81’ | −1.23 | −0.44 | −1.67 | 0.15 | −0. 05 | 0.10 | 0.02 | 0.11 | 0.13 | −0.14 | −1.58 |
| Val82’ | −1.36 | −0.47 | −1.83 | 0.06 | −0.07 | −0.01 | 0.08 | 0.16 | 0.24 | −0.11 | −1.71 |
| Val84’ | −1.05 | −0.13 | −1.18 | 0.17 | −0.05 | 0.12 | 0.07 | 0.08 | 0.15 | −0.12 | −1.03 |
Energies shown as contributions from van der Waals energy (vdw), electrostatic energy (ele), polar solvation energy (GB), the non-polar solvation energy (SUR) of side chain atoms (S), backbone atoms (B), and the sum of them, total (T) of protein-inhibitor complex. Only residues of |ΔG| ≥ 1.0 kcal /mol were listed (except few [b]). All values are given in kcal/mol.
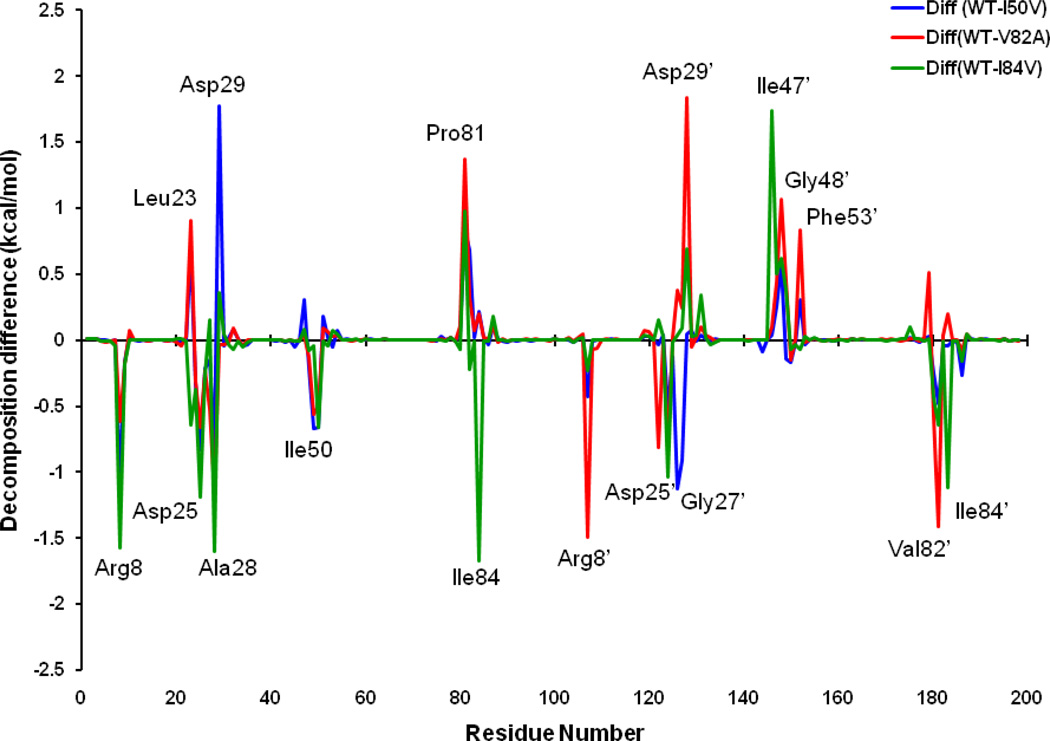
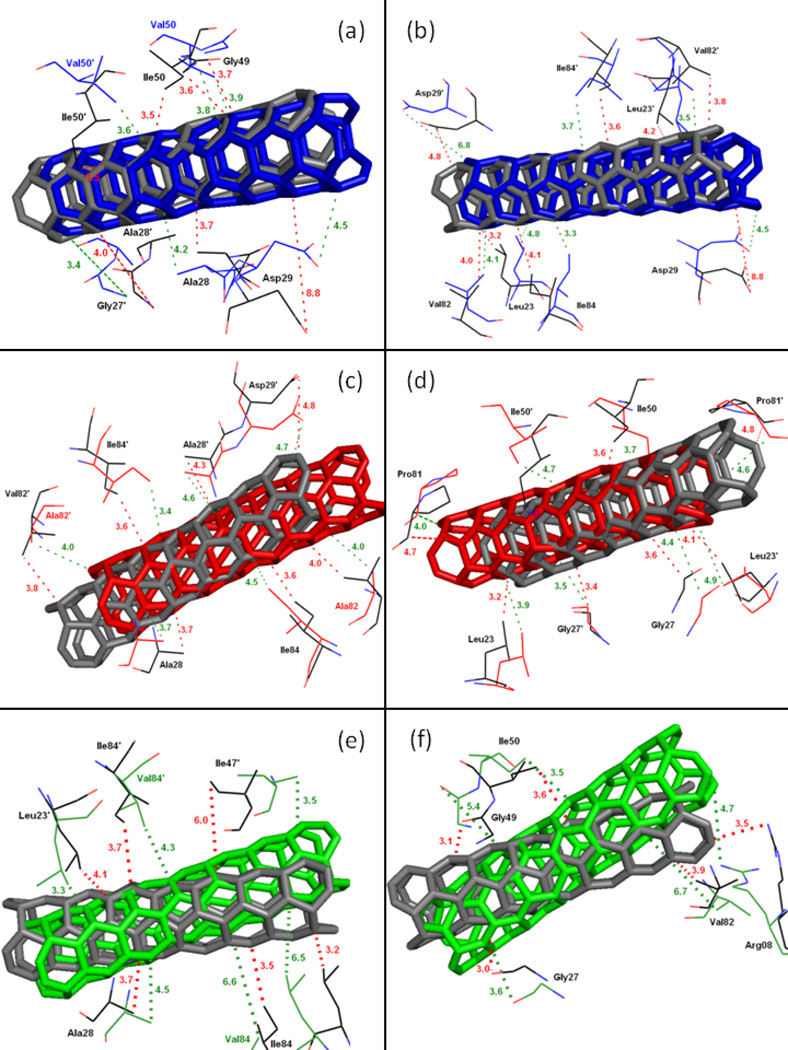
To further get insight into the effect on the binding affinity due to the mutations, binding energy difference per residue between the mutants and the WT was shown in Figure 12. Figures 13a–f describe the geometries of SWCNT in the binding complex with the important residues, which interact firmly with SWCNT through averaging the lowest-energy structure from the last 2 ns of the MD simulations. For the I50VPR, the decrease of binding energy by 5.97 kcal/mol partially attributes to the loss of one CH3 group from Ile50/Ile50’ (ΔG: −4.07/−3.47 kcal/mol) to Val50/Val50’ (−3.41/−3.33 kcal/mol) in the I50V mutant flap tip region (Figure 12 and Table 3), which accounts approximately 12% of the total binding loss. The decrease is consistent with the C…C distance increase for Val50-SWCNT from 3.5Å to 3.6Å in chain-B and from 3.6 to 3.8Å in chain-A, due to the I50V and I’50V’, shown in Figures 13(a) and 13(b) suggesting a direct loss of the vdw binding affinity. The unfavorable polar solvation energies (ΔGpol) for Val50 also decrease the binding affinity further by approximately 0.4 kcal/mol. Besides the mutation residue I50V/I50’V, Figure 12 and Table 3 show that Arg08 and Gly27’ contributes to the binding decrease by over 1.0kcal/mol, which is basically consistent with the longer distance between the residue and the SWCNT as shown in Figures 13a. In the I50VPR mutant the residue Asp29 has a net increase in the binding affinity by approximately −2.0 kcal/mol, which was well supported by the distance variation between the SWCNT and Asp29 from the WT (8.8Å) to the I50VPR mutant (4.5Å) in Figure 13b.
Figure 12.
The binding energy difference per residue between the WT and mutant HIV-PRs.
Figure 13.
C-H…π and N-H…π interactions between the SWCNT and the important residues in the flap tip, flaps, active site region of the HIV-PR for WT-vs-I50VPR (a and b), WT-vs-V82APR (c and d) and WT-vs-I84VPR (e and f). SWCNT in sticks is colored by four different colors (Gray, WT; Blue, I50VPR; Red, V82APR and green, I84VPR). Residues are shown as lines and are colored by atom type in respective colors to the SWCNT color. Color dashed lines indicate the distance between the SWCNT and the residues in Angstrom (Å) unit.
Figures 13c and 13d show a comparison of the C-C distances for the selected residues from flaps, active site and active site wall regions of the WT and mutant V82APR. The mutation residue Ala82 has little direct effect on the binding energy as the C…C distance with the SWCNT remains the same after mutation; however, Ala82’ directly results in the affinity decrease by approximately 1.5 kcal/mol, and as shown in Figure 13c the distance from Val82’/Ala82’ to the SWCNT is consistently increased from 3.8 to 4.0Ǻ. Compared to the I50VPR, more residues indirectly contribute to the binding decrease for the V82APR. For example, he residues Arg08/Arg08’ (2.0 kcal/mol) and Leu23’ (0.8 kcal/mol) have a loss of 2.8 kcal/mol from its WT counterpart, which accounts ~20% loss of the total binding energies. Other residues like Gly27 (0.5kcal/mol), Ala28 (1.2), Gly49 (~1.0), and Ile50 (0.5) result in considerable decrease in the binding energy by 0.5–1.2- kcal/mol. Table 3 and Figure 11 show that the binding loss is mainly due to decrease of van der Waals and cavity hydrophobicity of HIV-1-PR. On the other hand a few residues like Leu23, Pro81, Asp29’, Gly48’, and Phe53’ gain binding energy after the mutation that accounts about 8.0 kcal/mol in total.
In the I84VPR mutant the mutated residues Val84 (1.6 kcal/mol) and Val84’ (1.2 kcal/mol) have direct effect on the loss of binding affinities. However, the interactions from the residues in chain-A result in a more significant decrease in binding affinities, especially for Arg08 (1.6 kcal/mol), active residues Leu23 (0.6), Asp25 (1.2) and Ala28 (1.6),, and flap residue (Ile50 (0.7), and in chain-B like residues Asp25’ (1.2), and Val82’(0.6). The binding decrease can be once again mainly attributed to the decrease of van der Waals, reflected by the distance increase from the SWCNT to the flap and active residues as observed from Figures 13e–f. However, it is surprised to find that polar solvation energy becomes less than that of the WTPR (ΔGPB 23.5 vs 32.4 kcal/mol), indicating an increase of hydrophobicity for I84VPR. Apart from the total loss and gain of the binding free energies, the van der Waals interaction still keeps the SWCNT intact in all the HIV-PR/SWCNT complexes.
In order to check the flap arrangement pattern and the flap dynamics in the SWCNT-bound state we have analyzed the hydrogen bonding (H-bond) pattern. Analysis of the H-bond as listed in Table 4 shows the inter-flap and intra-flap H-bonds in the two flap region of the protease. It is noted that, the change from WT to mutant type of the HIV-pr has not affected much on the intra-flap H-bonding pattern, which can be seen with occupancy of (~ 90% in I50VPR and I84VPR) and (≥ 90% in WT and V82APR mutants). Conversely, the inter-flap H-bonds seems to be poor in all complexes except for I50VPR and V82APR, where the percentage is 8.32 and 7.90 respectively. This result confirms that, the flap dynamics pattern and flap arrangement does not differ much for mutants from their WT counterpart on binding of the SWCNT to the active site region.
Table 4.
Hydrogen bonds formed between intra- and inter- flaps in both the chains of HIV-PR.[a]
| Acceptor | Donor | WT | I50V | V82A | I84V | ||||
|---|---|---|---|---|---|---|---|---|---|
| Distance(Å) | %occup. | Distance(Å) | %occup. | Distance(Å) | %occup. | Distance(Å) | %occup. | ||
| Intra- flap H-bonding | |||||||||
| Gly52-O | Gly49-N-H | 2.95 (0.17) | 90.85 | 3.12 (0.25) | 88.07 | 3.06 (0.22) | 94.74 | 3.08 (0.23) | 87.24 |
| Gly49-O | Gly52-N-H | 3.50 (0.31) | 36.38 | 3.40 (0.30) | 21.45 | 3. 30 (0.28) | 34.05 | 3.30 (0.28) | 48.33 |
| Gly49-O | Gly51-N-H | 3.04 (0.22) | 0.43 | - | - | 2.93 (0.28) | 0.20 | 2.94 (0.17) | 0.43 |
| Inter- flap H-bonding | |||||||||
| Gly51-O | Ile50’-N-H | - | - | 3.27 (0.30) | 8.32 | 2.96 (0.19) | 7.90 | 3.38 (0.29) | 0.84 |
The H-bonds are determined by the donor….acceptor atom distance of ≤ 3.5 Å and acceptor….H-donor angle of ≥ 120°.
4. Conclusion
The primary objective of this study is to understand the interaction mechanisms of SWCNT and wild type (WT) HIV-1-PR as well as a few primary mutants (I50VPR, V82APR and I84VPR). The 20ns all-atom molecular dynamics simulations for the SWCNT/HIV-1-PR signify that the SWCNT accommodates well to the groove of the active site during the entire simulation, and that the flaps did not show significant opening throughout the simulation time. The MM-PBSA based free energy calculations showed that the SWCNT can bind several folds higher than the currently treated anti-HIV drug (TMC114/Darunavir) to the WT and mutant proteins as well. Free energy decomposition of residues indicated that, for the WT and all types of mutant most of the residues that contributes to the favorable binding of the SWCNT with the HIV-PR come from the active site, active site wall and the flap tip region, suggesting these three areas of the protease plays an important role in binding event. In accordance with the energy components of the binding free energy, for all the four HIV-1-PR/SWCNT complexes the van der Waals (vdw) energies provide the dominant contributions to the SWCNT binding. With careful observations from the MD simulation results and based on the binding properties of SWCNT to the HIV-PR variants, the present study can offer SWCNTs as HIV-PR inhibitors with vast potential for applications against drug resistance.
Acknowledgements
This work was supported by the National Institute of General Medical of the National Institute of Health (SC3GM082324), the American Recovery and Reinvestment Act (3SC3GM082324-02S1). The authors thank Pittsburgh Supercomputing Center, NCSA-Teragrid for providing the computational facilities to carry out the work in the form of a startup grant (CHE100117) to BRM.
References
- 1.Piana S, Carloni P, Rothlisberger U. Drug resistance in HIV-1 protease: Flexibility-assisted mechanism of compensatory mutations. Protein Sci. 2002;11:2393–2402. doi: 10.1110/ps.0206702. [DOI] [PMC free article] [PubMed] [Google Scholar]
- 2.Piana S, Carloni P, Parrinello M. Role of conformational fluctuations in the enzymatic reaction of HIV-1 protease. J Mol Biol. 2002;319:567–583. doi: 10.1016/S0022-2836(02)00301-7. [DOI] [PubMed] [Google Scholar]
- 3.Friedman SH, DeCamp DL, Sijbesma RP, Srdanov G, Wudl F, Kenyon GL. Inhibition of the HIV-1 protease by fullerene derivatives: model building studies and experimental verification. J. Am. Chem. Soc. 1993;115:6506–6509. [Google Scholar]
- 4.Friedman SH, Ganapathi PS, Rubin Y, Kenyon GL. Optimizing the binding of fullerene inhibitors of the HIV-1 protease through predicted increases in hydrophobic desolvation. J Med Chem. 1998;41:2424–2429. doi: 10.1021/jm970689r. [DOI] [PubMed] [Google Scholar]
- 5.Bosi S, Da Ros T, Spalluto G, Prato M. Fullerene derivatives: an attractive tool for biological applications. Eur J Med Chem. 2003;38:913–923. doi: 10.1016/j.ejmech.2003.09.005. [DOI] [PubMed] [Google Scholar]
- 6.Aruksakunwong O, Promsri S, Wittayanarakul K, Nimmanpipug P, Lee VS, Wijitkosoom A, et al. Current Development on HIV-1 Protease Inhibitors. Curr. Comp. Aid. Drug Des. 2007;3:201–213. [Google Scholar]
- 7.Zhu Z, Schuster DI, Tuckerman ME. Molecular dynamics study of the connection between flap closing and binding of fullerene-based inhibitors of the HIV-1 protease. Biochemistry. 2003;42:1326–1333. doi: 10.1021/bi020496s. [DOI] [PubMed] [Google Scholar]
- 8.Ge C, Du J, Zhao L, Wang L, Liu Y, Li D, et al. Binding of blood proteins to carbon nanotubes reduces cytotoxicity. Proc Natl Acad Sci U S A. 2011;108:16968–16973. doi: 10.1073/pnas.1105270108. [DOI] [PMC free article] [PubMed] [Google Scholar]
- 9.Schinazi RF, Sijbesma R, Srdanov G, Hill CL, Wudl F. Synthesis and virucidal activity of a water-soluble, configurationally stable, derivatized C60 fullerene. Antimicrob Agents Chemother. 1993;37:1707–1710. doi: 10.1128/aac.37.8.1707. [DOI] [PMC free article] [PubMed] [Google Scholar]
- 10.Mashino T, Okuda K, Hirota T, Hirobe M, Nagano T, Mochizuki M. Inhibitory effect of fullerene derivatives on glutathione reductase. Fullerene Sci. Technol. 2001;9:191–196. [Google Scholar]
- 11.Ueng T, Wang H, Chiang LY. Inhibition of Drug-Metabolizing Enzymes in Mouse Liver by a Water Soluble Fullerene C60. Fullerene Sci. Technol. 1999;7:681–694. [Google Scholar]
- 12.Innocenti A, Durdagi S, Doostdar N, Strom TA, Barron AR, Supuran CT. Nanoscale enzyme inhibitors: fullerenes inhibit carbonic anhydrase by occluding the active site entrance. Bioorg Med Chem. 2010;18:2822–2828. doi: 10.1016/j.bmc.2010.03.026. [DOI] [PubMed] [Google Scholar]
- 13.Meng X, Chen Z, Li B, Zhang Y, Zhao D, Yang X. Inhibition of M-MuLV reverse transcriptase activity by fullerene derivatives. Chinese Science Bulletin. 2006;15:2550–2552. [Google Scholar]
- 14.Meng X, Li B, Chen Z, Yao L, Zhao D, Yang X, et al. Inhibition of a thermophilic deoxyribonucleic acid polymerase by fullerene derivatives. J Enzyme Inhib Med Chem. 2007;22:293–296. doi: 10.1080/14756360601114270. [DOI] [PubMed] [Google Scholar]
- 15.Wolff DJ, Barbieri CM, Richardson CF, Schuster DI, Wilson SR. Trisamine C(60)-fullerene adducts inhibit neuronal nitric oxide synthase by acting as highly potent calmodulin antagonists. Arch Biochem Biophys. 2002;399:130–141. doi: 10.1006/abbi.2002.2766. [DOI] [PubMed] [Google Scholar]
- 16.Benyamini H, Shulman-Peleg A, Wolfson HJ, Belgorodsky B, Fadeev L, Gozin M. Interaction of c(60)-fullerene and carboxyfullerene with proteins: docking and binding site alignment. Bioconjug Chem. 2006;17:378–386. doi: 10.1021/bc050299g. [DOI] [PubMed] [Google Scholar]
- 17.Compain P, Decroocq C, Iehl J, Holler M, Hazelard D, Mena Barragan T, et al. Glycosidase inhibition with fullerene iminosugar balls: a dramatic multivalent effect. Angew Chem Int Ed Engl. 2010;49:5753–5756. doi: 10.1002/anie.201002802. [DOI] [PubMed] [Google Scholar]
- 18.Yang ST, Wang H, Guo L, Gao Y, Liu Y, Cao A. Interaction of fullerenol with lysozyme investigated by experimental and computational approaches. Nanotechnology. 2008;19:395101. doi: 10.1088/0957-4484/19/39/395101. [DOI] [PubMed] [Google Scholar]
- 19.Cheng Y, Li D, Ji B, Shi X, Gao H. Structure-based design of carbon nanotubes as HIV-1 protease inhibitors: atomistic and coarse-grained simulations. J Mol Graph Model. 2010;29:171–177. doi: 10.1016/j.jmgm.2010.05.009. [DOI] [PubMed] [Google Scholar]
- 20.Tzoupis H, Leonis G, Durdagi S, Mouchlis V, Mavromoustakos T, Papadopoulos MG. Binding of novel fullerene inhibitors to HIV-1 protease: insight through molecular dynamics and molecular mechanics Poisson-Boltzmann surface area calculations. J Comput Aided Mol Des. 2011;25:959–976. doi: 10.1007/s10822-011-9475-4. [DOI] [PubMed] [Google Scholar]
- 21.Surleraux DL, Tahri A, Verschueren WG, Pille GM, de Kock HA, Jonckers TH, et al. Discovery and selection of TMC114, a next generation HIV-1 protease inhibitor. J Med Chem. 2005;48:1813–1822. doi: 10.1021/jm049560p. [DOI] [PubMed] [Google Scholar]
- 22.Kovalevsky AY, Tie Y, Liu F, Boross PI, Wang Y-FM, Leshchenko S, et al. Effectiveness of Nonpeptide Clinical Inhibitor TMC-114 on HIV-1 Protease with Highly Drug Resistant Mutations D30N, I50V, and L90M. J. Med. Chem. 2006;49:1379–1387. doi: 10.1021/jm050943c. [DOI] [PMC free article] [PubMed] [Google Scholar]
- 23.Wang YF, Tie Y, Boross PI, Tozser J, Ghosh AK, Harrison RW, et al. Potent new antiviral compound shows similar inhibition and structural interactions with drug resistant mutants and wild type HIV-1 protease. J Med Chem. 2007;50:4509–4515. doi: 10.1021/jm070482q. [DOI] [PMC free article] [PubMed] [Google Scholar]
- 24.Tie Y, Kovalevsky AY, Boross P, Wang YF, Ghosh AK, Tozser J, et al. Atomic resolution crystal structures of HIV-1 protease and mutants V82A and I84V with saquinavir. Proteins. 2007;67:232–242. doi: 10.1002/prot.21304. [DOI] [PubMed] [Google Scholar]
- 25.Schneidman-Duhovny D, Inbar Y, Nussinov R, Wolfson HJ. PatchDock and SymmDock: servers for rigid and symmetric docking. Nucleic Acids Res. 2005;33:W363–367. doi: 10.1093/nar/gki481. [DOI] [PMC free article] [PubMed] [Google Scholar]
- 26.Hyland LJ, Tomaszek TA, Jr, Meek TD. Human immunodeficiency virus-1 protease. 2. Use of pH rate studies and solvent kinetic isotope effects to elucidate details of chemical mechanism. Biochemistry. 1991;30:8454–8463. doi: 10.1021/bi00098a024. [DOI] [PubMed] [Google Scholar]
- 27.Wang YX, Freedberg DI, Yamazaki T, Wingfield PT, Stahl SJ, Kaufman JD, et al. Solution NMR evidence that the HIV-1 protease catalytic aspartyl groups have different ionization states in the complex formed with the asymmetric drug KNI-272. Biochemistry. 1996;35:9945–9950. doi: 10.1021/bi961268z. [DOI] [PubMed] [Google Scholar]
- 28.Bayly CI, Cieplak P, Cornell W, Kollman PA. A well-behaved electrostatic potential based method using charge restraints for deriving atomic charges: the RESP model. J. Phys. Chem. 1993;97 [Google Scholar]
- 29.Dewar MJS, Zoebisch EG, Healy EF, Stewart JJP. Development and use of quantum mechanical molecular models. 76. AM1: a new general purpose quantum mechanical molecular model. J. Am. Chem. Soc. 1985;107 [Google Scholar]
- 30.Hornak V, Abel R, Okur A, Strockbine B, Roitberg A, Simmerling C. Comparison of multiple Amber force fields and development of improved protein backbone parameters. Proteins. 2006;65:712–725. doi: 10.1002/prot.21123. [DOI] [PMC free article] [PubMed] [Google Scholar]
- 31.Jorgensen WL, Chandrasekhar J, Madura JD, Impey Roger W, Klein ML. Comparison of simple potential functions for simulating liquid water. Journal of Chemical Physics. 1983;79:10. [Google Scholar]
- 32.Essmann U, Perera L, Berkowitz ML, Darden T, Lee H, Pedersen LG. A smooth particle mesh Ewald method. J. Chem. Phys. 1995;103:17. [Google Scholar]
- 33.Berendsen HJC, Postma JPM, Van Gunsteren WF, DiNola A, Haak JR. Molecular dynamics with coupling to an external bath. J. Chem. Phys. 1984;81:7. [Google Scholar]
- 34.Ryckaert J-P, Ciccotti G, Berendsen HJC. Numerical integration of the cartesian equations of motion of a system with constraints: molecular dynamics of n-alkanes. J. Comput. Phys. 1977;23:327–341. [Google Scholar]
- 35.Case DA, Darden TA, Cheatham ITE, Simmerling CL, Wang J, Duke RE, et al. AMBER 11. University of California; San Francisco: 2010. [Google Scholar]
- 36.Onufriev A, Bashford D, Case DA. Modification of the Generalized Born model suitable for macromolecules. J. Phys. Chem. B. 2000;104:3712–3720. [Google Scholar]
- 37.Freedberg DI, Wang YX, Stahl SJ, Kaufman JD, Wingfield PT, Kiso Y, et al. Flexibility and function in HIV protease: Dynamics of the HIV-1 protease bound to the asymmetric inhibitor Kynostatin 272 (KNI-272) J. Am. Chem. Soc. 1998;120:7916–7923. [Google Scholar]
- 38.Zoete V, Michielin O, Karplus M. Relation between sequence and structure of HIV-1 protease inhibitor complexes: a model system for the analysis of protein flexibility. J Mol Biol. 2002;315:21–52. doi: 10.1006/jmbi.2001.5173. [DOI] [PubMed] [Google Scholar]
- 39.Meher BR, Wang Y. Interaction of I50V Mutant and I50L/A71V Double Mutant HIV-Protease with Inhibitor TMC114 (Darunavir): Molecular Dynamics Simulation and Binding Free Energy Studies. J Phys Chem B. 2012;116:1884–1900. doi: 10.1021/jp2074804. [DOI] [PMC free article] [PubMed] [Google Scholar]
- 40.Tie Y, Boross PI, Wang YF, Gaddis L, Hussain AK, Leshchenko S, et al. High resolution crystal structures of HIV-1 protease with a potent non-peptide inhibitor (UIC-94017) active against multi-drug-resistant clinical strains. J Mol Biol. 2004;338:341–352. doi: 10.1016/j.jmb.2004.02.052. [DOI] [PubMed] [Google Scholar]
- 41.Wu EL, Han K, Zhang JZ. Selectivity of neutral/weakly basic P1 group inhibitors of thrombin and trypsin by a molecular dynamics study. Chemistry. 2008;14:8704–8714. doi: 10.1002/chem.200800277. [DOI] [PubMed] [Google Scholar]
- 42.Mahalingam B, Wang YF, Boross PI, Tozser J, Louis JM, Harrison RW, et al. Crystal structures of HIV protease V82A and L90M mutants reveal changes in the indinavir-binding site. Eur J Biochem. 2004;271:1516–1524. doi: 10.1111/j.1432-1033.2004.04060.x. [DOI] [PubMed] [Google Scholar]
- 43.Kar P, Knecht V. Energetic basis for drug resistance of HIV-1 protease mutants against amprenavir. J Comput Aided Mol Des. 2012;26:215–232. doi: 10.1007/s10822-012-9550-5. [DOI] [PubMed] [Google Scholar]
- 44.Shen CH, Wang YF, Kovalevsky AY, Harrison RW, Weber IT. Amprenavir complexes with HIV-1 protease and its drug-resistant mutants altering hydrophobic clusters. FEBS J. 2010;277:3699–3714. doi: 10.1111/j.1742-4658.2010.07771.x. [DOI] [PMC free article] [PubMed] [Google Scholar]
- 45.Alcaro S, Artese A, Ceccherini-Silberstein F, Ortuso F, Perno CF, Sing T, et al. Molecular dynamics and free energy studies on the wild-type and mutated HIV-1 protease complexed with four approved drugs: mechanism of binding and drug resistance. J Chem Inf Model. 2009;49:1751–1761. doi: 10.1021/ci900012k. [DOI] [PubMed] [Google Scholar]
- 46.Hou T, Yu R. Molecular dynamics and free energy studies on the wild-type and double mutant HIV-1 protease complexed with amprenavir and two amprenavir-related inhibitors: mechanism for binding and drug resistance. J Med Chem. 2007;50:1177–1188. doi: 10.1021/jm0609162. [DOI] [PubMed] [Google Scholar]
- 47.King NM, Prabu-Jeyabalan M, Nalivaika EA, Wigerinck P, de Bethune MP, Schiffer CA. Structural and thermodynamic basis for the binding of TMC114, a next-generation human immunodeficiency virus type 1 protease inhibitor. J Virol. 2004;78:12012–12021. doi: 10.1128/JVI.78.21.12012-12021.2004. [DOI] [PMC free article] [PubMed] [Google Scholar]
- 48.Stoica I, Sadiq SK, Coveney PV. Rapid and accurate prediction of binding free energies for saquinavir-bound HIV-1 proteases. J Am Chem Soc. 2008;130:2639–2648. doi: 10.1021/ja0779250. [DOI] [PubMed] [Google Scholar]
- 49.Ohtaka H, Velazquez-Campoy A, Xie D, Freire E. Overcoming drug resistance in HIV-1 chemotherapy: the binding thermodynamics of Amprenavir and TMC-126 to wild-type and drug-resistant mutants of the HIV-1 protease. Protein Sci. 2002;11:1908–1916. doi: 10.1110/ps.0206402. [DOI] [PMC free article] [PubMed] [Google Scholar]
- 50.Chen Z, Li Y, Chen E, Hall DL, Darke PL, Culberson C, et al. Crystal structure at 1.9-A resolution of human immunodeficiency virus (HIV) II protease complexed with L-735,524, an orally bioavailable inhibitor of the HIV proteases. J Biol Chem. 1994;269:26344–26348. [PubMed] [Google Scholar]
- 51.Kaldor SW, Kalish VJ, Davies JF, 2nd, Shetty BV, Fritz JE, Appelt K, et al. Viracept (nelfinavir mesylate, AG1343): a potent, orally bioavailable inhibitor of HIV-1 protease. J Med Chem. 1997;40:3979–3985. doi: 10.1021/jm9704098. [DOI] [PubMed] [Google Scholar]
- 52.Mongan J, Case DA, McCammon JA. Constant pH molecular dynamics in generalized Born implicit solvent. J Comput Chem. 2004;25:2038–2048. doi: 10.1002/jcc.20139. [DOI] [PubMed] [Google Scholar]
- 53.Muzammil S, Armstrong AA, Kang LW, Jakalian A, Bonneau PR, Schmelmer V, et al. Unique thermodynamic response of tipranavir to human immunodeficiency virus type 1 protease drug resistance mutations. J Virol. 2007;81:5144–5154. doi: 10.1128/JVI.02706-06. [DOI] [PMC free article] [PubMed] [Google Scholar]
- 54.Li D, Liu MS, Ji B, Hwang K, Huang Y. Coarse-grained molecular dynamics of ligands binding into protein: The case of HIV-1 protease inhibitors. J Chem Phys. 2009;130:215102. doi: 10.1063/1.3148022. [DOI] [PubMed] [Google Scholar]


