Abstract
Scanning electron microscopy, transmission electron micrsocopy, rheomerty, and electrochemistry were used to provide insight into the microstructure of collagen type I gel (1% w/v) modified with the tiopronin-protected (N-(2-mercaptopropionyl)glycine) gold nanoparticles (TPAu), a multivalent crosslinker. The cross-linking reaction, performed via EDC (1-ethyl-3-(3-dimethyl aminopropyl) carbodiimide) coupling, results in compliant, mechanically stable and continuous gels. The gels contain unusual interconnected collagen-TPAu particles. Electrochemical measurements of 4-hydroxy-(2,2,6,6-tetramethylpiperidine-1-oxyl) (4HT) diffusion within the gel reveal that the gel hindrance is nearly independent of the TPAu concentration. The properties of the collagen-TPAu gel make it suitable for potential biomedical applications, such as delivery of small molecule drugs.
1. Introduction
Collagen is a major component of connective tissue and the most abundant protein.1–3 It is extensively used in biomedical applications ranging from drug delivery to tissue-engineering, scaffolds, and materials for wound dressing.4 The broad interest in collagen arises from its biodegradability, its ease of extraction, purification and processing, and its excellent biocompatibility.1,5 However, the low mechanical stability and fast biodegradation rate of unmodified collagen hamper its use for many biomedical applications. The cross-linking of collagen improves its performance by providing thermal, mechanical, and chemical stabilization.5 Multiple cross-linking procedures, including chemical, thermal, and photo treatments, have been used to produce collagen materials.6–11
Recently, a new type of cross-linking procedure has emerged employing multivalent ) cross-linkers (more than two bonds between cross-linker and collagen gel). Both dendrimers and monolayer-protected gold nanoparticles have been used in this approach.12–15 The use of multivalent cross-linkers results in gels with a unique spatial arrangement of collagen molecules and changes the properties of the gel. Collagen gels cross-linked with dendrimers show higher cross-linking density and are optically fully transparent and thermally very stable.12 Despite their extremely high thermal stability, the gels lack a fibrillar structure.13 By contrast, collagen gels modified with gold nanoparticles are opaque and show only a minor increase in thermal stability.14
The cross-linking of collagen fibrils with with gold nanoparticles results in 2-D assemblies.16,17 For example, multivalent gold nanoparticles modified with tris(hydroxymethyl)phosphine-alanine can be used to spatially organize collagen fibers to create a specific mesh size for 2-D assembly.16 The spatial organization of these assemblies is guided by electrostatic interactions between the nanoparticle and the collagen fiber.16
In a previous report we demonstrated that cross-linking collagen with tiopronin-protected gold nanoparticles (TPAu) results in formation of a gel with improved thermal stability (the helix-to-coil transition temperature, Tm, shifts from 42°C to 55°C).14 Thus under physiological conditions (at 37°C) the gel-forming collagen is in its helical form. In addition the gels are biocompatible and exhibit low cytotoxicity.15 Here we report detailed characterization of the microstructure and properties of collagen gels modified with tiopronin-protected (N-(2-mercaptopropionyl)glycine) gold nanoparticles.
2. Materials and Methods
2.1 Preparation of TPAu nanoparticles
All chemicals were used as received unless otherwise specified. TPAu, diameter = 2.4 (± 0.7) nm, were synthesized using previously reported methods.18,19 Briefly, 0.31g tetrachloroauric acid (Sigma) and 0.39 g N-(2-mercaptopropionyl)glycine (Aldrich) were slowly dissolved in 35 ml of 6:1 methanol/acetic acid. To this 0.6g NaBH4 (Sigma) was added in 15 ml of water. The resulting hot, blue-black suspension was cooled to room temperature and stirred for 30 minutes. The crude black TPAu was purified by dialysis, with fresh water changed every 14 hours over the course of 70 hours. A detailed characterization of the TPAu (spectrophotometry, thermogravimetric analysis and transmission electron microscopy) was reported earlier.14
2.2 Preparation of collagen gels
Collagen was extracted from rat-tail tendons (Pel-Freeze Biologicals) according to theprocedure of Ho et al. 20 lyophilized and stored at 4°C until used. The yield was 29–31%. The collagen was then dissolved in 0.01 M HCl and the purity of the product was examined by SDS-PAGE (Bio-Rad, Mini-Protean TGX)).
TPAu were coupled to the collagen via EDC (N-(3-dimethylaminopropyl)-N'-ethylcarbodiimide hydrochloride) (Aldrich) coupling.14 Briefly, 200 mg of 1% or 2% (w/v) stock solution of collagen in deionized (DI) water was placed in a 24-well plate. Varied amounts (10–100 µL) of 7.5 mg/mL stock TPAu in 0.01 M MES (2-(N-morpholino) ethanesulfonic acid) pH 6.0 (Sigma) were mixed with MES buffer (to give final volume of 100 µL) and 7 mg of EDC was added. The mixture of TPAu and EDC was incubated for 5 minutes to activate the nanoparticle carboxyl terminal groups for the coupling reaction (Table 1). Subsequently, the activated TPAu solution was added to the collagen in the wells. The mixture was kept in a undisturbed overnight to cross-link. The supernatant from the coupling solution was left in the well and did not incorporate into the gel.
Table 1.
Composition of collagen gel samples and comparison of the storage and loss moduli recorded at 1.6 Hz. Ccoll lists the actual concentration of collagen in the sample, while CTPAu represents the actual concentration of nanoparticles in the sample. Mass ratio refers to ratio of masses of dry collagen to dry TPAu without solvent.
| Sample | Ccoll [mg/ml] | CTPAu [mg/ml] | EDC [mg] | Mass ratio | G' [Pa] | G"[Pa] |
|---|---|---|---|---|---|---|
| coll 1% | 10 | 0 | 0 | n/a | 77.2 ± 1.2 | 44.7 ± 1.9 |
| coll 2% | 20 | 0 | 0 | n/a | 164.6 ± 0.1 | 98.8 ± 0.1 |
| coll-EDC | 10 | 0 | 6.8 | n/a | 2081 ± 29 | 27.3 ± 2.4 |
| TPAu1 | 10 | 0.75 | 6.8 | 26.7 | 2343 ± 9 | 25.7 ± 1.6 |
| TPAu2 | 10 | 3.75 | 6.8 | 5.3 | 3323 ± 59 | 46.1 ± 0.5 |
| TPAu3 | 10 | 7.5 | 6.8 | 2.7 | 3663 ± 31 | 52.1 ± 1.6 |
| TPAu3-2% | 20 | 7.5 | 6.8 | 5.3 | 25321 ± 742 | 1154 ± 50 |
| TPAu-0.5% | 5 | 7.5* | 6.8 | 0.6 | n/a | n/a |
2.3 Scanning Electron Microscopy (SEM)
After cross-linking the collagen gels were fixed with 3% (v/v) glutaraldehyde (Aldrich), 3% (v/v) formaldehyde (Aldrich), 2.5% (v/v) DMSO (Fisher Scientific), and 0.1 M sodium cacodylate buffer(Fisher Scientific) for 12 h at room temperature, dehydrated with a series of ethanol solutions (50, 75, 90, 95, 100%) for 10 min each (Sigma), and critical point dried from ethanol with CO2 (Praxair). Subsequently samples where mounted on SEM stubs (carbon adhesive, Ted Pella) and send to the University of California, Riverside, EM Imaging Facility for imaging. The samples were coated with a sputtered thin film of Pt/Pd (70/30). The images were acquired in a FEI XL30-FEG SEM at 5 kV accelerating voltage. Images were taken at magnifications of 200, 5000, 20000, and 50000x.
2.4 Transmission Electron Microscopy (TEM)
Collagen-TPAu gels were dried with progressively increasing concentrations of ethanol solutions, cured in Araldite (Ted Pella) resin, and sectioned (LKB Ultratome Nova) to 60–80 nm thickness before imaging. The gels were placed on a TEM grid (Formvar-coated copper grids), and phase contrast images were recorded at 80 KeV with a JEOL-1200EXII electron microscope.
2.5 Determination of degree of cross-linking
The degree of cross-linking was measured as the loss of free ε-amino groups of lysine upon addition of Au nanoparticles. The amount of free amino groups was determined using 2,4,6-trinitrobenzenesulfonic acid (TNBS, Pierce) as described by Cheung et al. and Sheu et al.21,22 Briefly, 100 mg of collagen samples treated with different amounts of Au nanopatrticles was added to 400 µl of 0.1 M sodium bicarbonate solution and 250 µl of 0.1% TNBS (in 0.1 M sodium bicarbonate, Sigma) and placed in a water bath (40°C) for 2 hours. 300 µl of 12M HCl (Sigma) was added to the reaction mixture, and the temperature was raised to 60°C. The solubilization of the collagen was achieved after 2 hours. The samples were transferred to a UV-Vis spectrophotometer (Shimadzu UV-2401 PC) and the absorbance was measured at 425 nm (the reference sample contained an appropriate amount of Au nanoparticles to compensate for contributions due to scattering). The degree of cross-linking was determined as the % loss of free ε-amino groups and is equal to: 1- (AbsAu / Abscoll ), where AbsAu represents the absorbance of the TPAu cross-linked collagen and Abscoll represents the absorbance of the collagen.
2.6 Rheometry
Viscoelastic measurements were performed on an ARES rheometer (TA Instruments) with aparallel plate geometry. Collagen gels for rheological measurements were prepared in custom-made molds of 25 mm diameter and 1.5 mm thickness to fully cover the plates. The measurements were performed at room temperature (21°C). The storage and loss moduli were measured using a frequency range of 0.1–10 Hz and a strain amplitude of 1%.
2.7. Diffusion measurements
The diffusion hindrance of the gels was calculated from the diffusion coefficient of the electrochemical probe: 4-hydroxy-(2,2,6,6-tetramethylpiperidine-1-oxyl) (4HT, Aldrich), determined by electrochemical time of flight (ETOF) as described elsewhere.23–26 In short, the ETOF technique employs a photolithographically fabricated dual-band microelectrode device with one electrode serving as a generator of the probe and the other as a collector. The redox probe is produced at the generator electrode, and its time of arrival at the collector electrode is monitored as a current–time transient. The transit time (τ), defined as time at which the recorded current reaches 1/3 of the plateau current, is inversely proportional to the diffusion coefficient (D) of a probe.
Here we used a device with 4 micro-bands (w = 10µm, gap = 10µm, each) (Amtek). Only two electrodes were used for a single measurement. The ETOF and voltammetry were performed using a CH Instuments bipotentiostat (model 760B) in a four- and threeelectrode configuration, respectively, under computer control. A Ag wire pseudo-reference was used as a reference electrode, and a Pt wire was used as a counter electrode. To ensure the quality of the ETOF experiment, voltammograms were recorded on each micro-band before the ETOF measurements. Calibration of the device was performed on a 0.5 mM solution of 4-HT in PBS buffer (Cell Grow). The nominal concentration of 4-HT in ETOF experiments recorded in a collagen matrix was 0.1 mM, and PBS was used as a supporting electrolyte. All measurements were performed at 21°C.
3. Results and Discussion
3.1 Collagen-TPAu Gel Preparation
The synthesis and detailed characterization of TPAu was reported elsewhere.14,15 In short, TPAu nanoparticles were characterized by UV-Vis spectra and transmission electron microscopy. The average particle diameter was 2.4 ± 0.7 nm as determined by analysis of TEM images.
Collagen gels were prepared by dissolving lyophilized collagen in DI water for 48 hours to a final concentration of 0.5, 1 or 2% (w/v). The homogenous collagen solutions were cross-linked with various amounts of TPAu via EDC coupling (Table 1). The gels (1 and 2 %) were solid, jello-like and easy to handle. As reported recently by Tierneya et.al. 27, the collagen gels obtained from solutions with concentrations ≥ 1% have enhanced mechanical and biological properties, making them highly attractive for the use in bone tissue engineering.
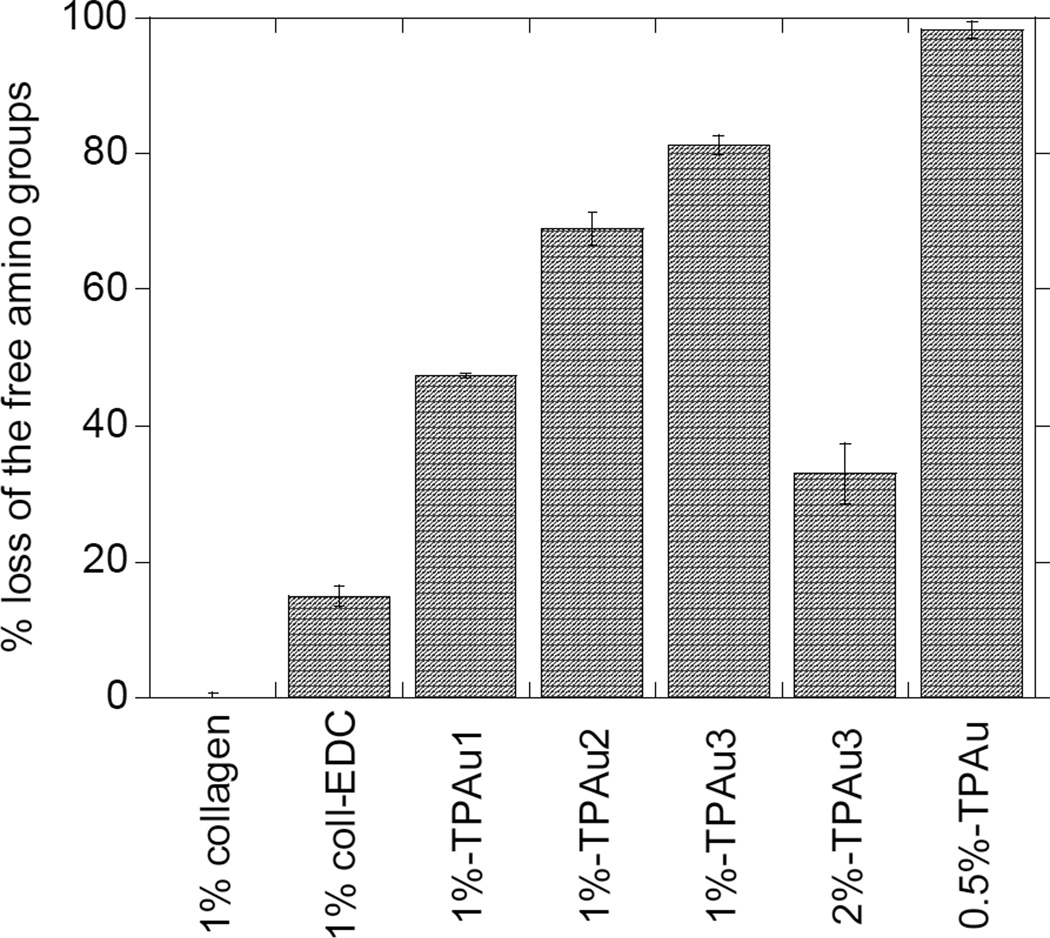
The level of cross-linking is defined as the percent loss of free amino groups from collagen and is measured with TNBS assay. Since EDC alone might mediate collagen self-cross-linking due to the presence of both carboxyl and amino side chains in the collagen, we examined the extent of this reaction without TPAu. The addition of EDC to 1% collagen solution resulted in 14.8% loss of free amino groups, as a result of intra- or inter-molecular cross-linking with collagen carboxyl groups (Figure 1). Furthermore, in our protocol, the cross-linked gels are produced by adding the TPAu/EDC solution mixture to collagen. Thus this approach is likely to further reduce collagen self-cross-linking.
Figure 1.
Histogram of the percent loss of free amino groups, normalized with respect to un-cross-linked collagen determined by the TNBS assay. The error bars reflect standard deviations calculated from six samples.
The described protocol allowed formation of collagen gels with varying degrees of cross-linking (Figure 1). The recorded loss of amino groups was up to 81% for gels based on 1% collagen (Table 1). Under the experimental conditions described in Table 1, essentially all TPAu particles participated in cross-linking. For example, for collagen concentrations of 0.5%, 1%, and 2% the degree of cross-linking was 100%, 81%, and 33% respectively, indicating that the availability of TPAu limits the number of cross-links formed. The level of crosslinking was determined to be significantly different for each crosslinking treatment (p<0.05). Similar behavior was observed earlier for collagen-GAG scaffolds.26 It should be noted that the loss of the collagen amino groups does not necessarily indicate formation of a cross-link – the TPAu nanoparticles can possibly be attached to just one lysine group without the formation of a cross-link. However, many previous reports have shown that the loss of free amino groups correlates very well with the extent of gel cross-linking.14,20,21
3.2 Collagen-TPAu Gel Imaging
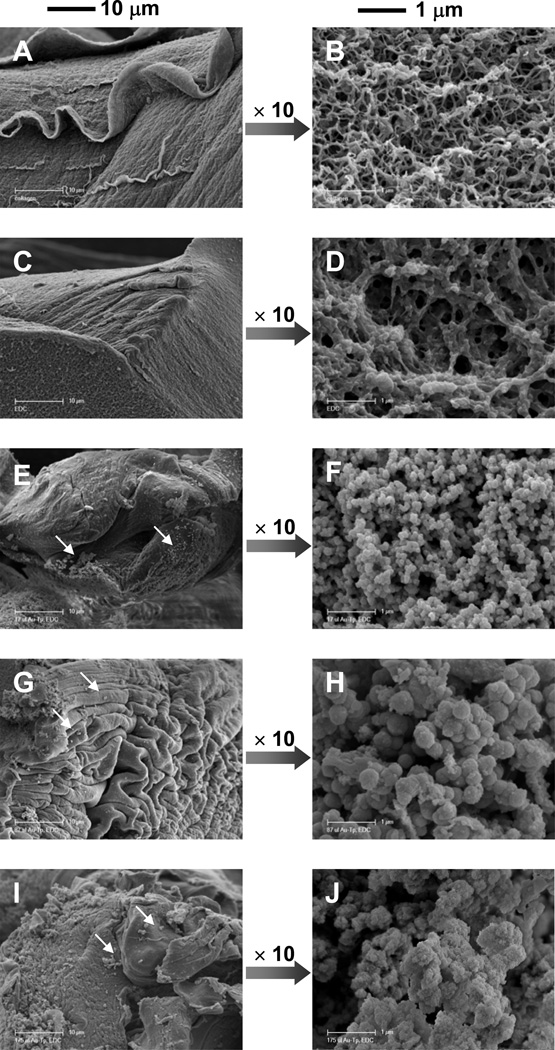
The preparation of the collagen samples used for SEM imaging was designed to preserve the potential fibrous structure of collagen-based materials.28 It has been shown that the use of a combination of glutaraldehyde and formaldehyde preserves the microstructure of collagen gels and fibers that are present in the gel in situ.28 For this reason, regardless of the amount and type of cross-linker added to form the gel (TPAu), the protocol for SEM imaging of collagen gels was followed. After the structure preservation treatment the collagen scaffolds were dehydrated, coated with Pd/C and imaged with SEM. The images of collagen scaffolds are presented in Figure 2. The morphology of unmodified collagen (Figure 2A, B) is typical for this type of gel. The high initial concentration of collagen (1%) resulted in the formation of a dense network of short fibers (Figure 2B) organized in sheets (Figure 2A). Addition of EDC led to thicker and shorter fibers and resulted in larger pores formed within the collagen gel (Figure 2C, D).
Figure 2.
SEM Images of collagen gels dried under morphology-preserving conditions (see text)). The two scale bars apply to all the images in the respective columns. (A,B) 1% collagen, (C,D) cross-linked with EDC, (E,F) TPAu1, (G,H), TPAu2, (I,J) TPAu3. White arrows indicate random, free particles at the surface of the collagen (see text).
In Figures 2E–J the SEM images of collagen modified with TPAu are presented. The sheet morphology is partially wrinkled (for example in Figure 2G), possibly because of dehydration during sample preparation. More interestingly, the naturally occurring fractures of a sheet (Figure 2, images on the right-hand side) allowed for viewing of the “bulk” of the scaffold. The inner scaffold formed a “particulate phase” and the particles appeared to be connected. The particle size increased with the concentration of TPAu from about 150±60 to 400±80 nm (averages calculated for 100 particles). The majority of the particles seemed to be interconnected and we could only observe a very limited number of free particles. These random, free particles at the surface of the collagen scaffold probably indicate minor damage to the gels during the sample preparation process (Figure 2E, G, I).
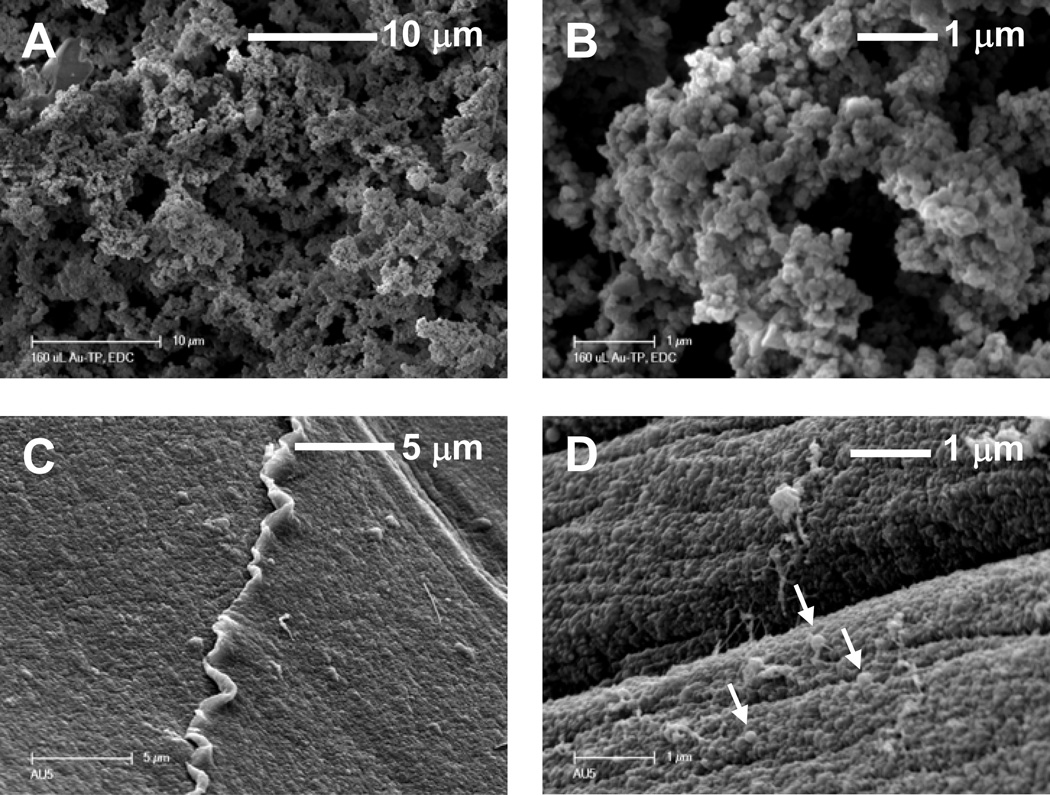
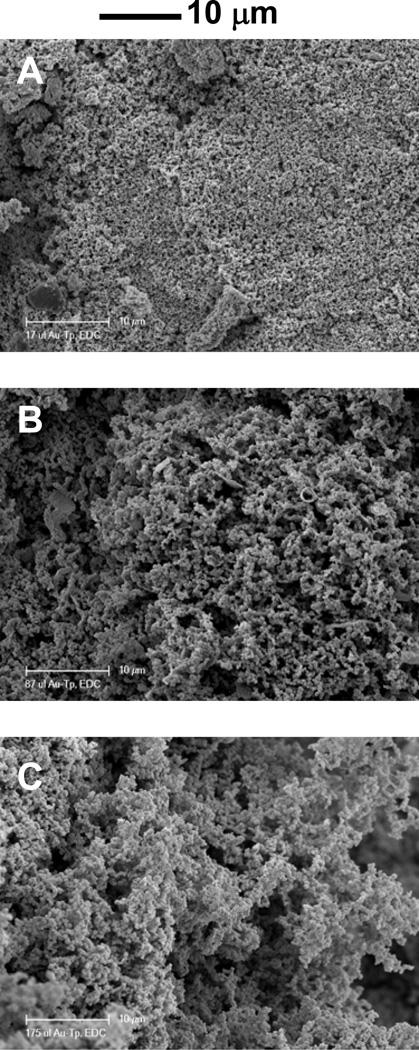
As shown in Figure 3, connected particles were also present for 0.5% and 2% collagen concentrations modified with TPAu. The particle size of collagen within the scaffolds varied with the concentration of TPAu added to collagen and with the concentration of collagen in the gels. When the concentration of collagen was decreased to 0.5% and the amount of TPAu increased by a factor of 2.5, the size of the particles decreased significantly (Figure 3C, D) and the particles became almost indistinguishable from the film itself. In this case accuratequantification of the collagen-TPAu particles was not possible, but we were able to estimate the size of particles as 40–80 nm. Additionally, SEM micrographs (Figure 4) showed large amounts of particles within the bulk of the sample, indicating that the entire gel is made from the particulate phase.
Figure 3.
SEM Images of collagen gels dried under morphology-preserving conditions (see text). The concentration of collagen was varied (A,B) 2% (w/v) TPAu3-2% and (C,D) 0.5% (w/v) TPAu-0.5%. The arrows in (D) point to particles (see text).
Figure 4.
SEM Images of collagen gels dried under morphology-preserving conditions (see text). The gels were fracture to expose the inner structure (A) TPAu1, (B) TPAu2, (C) TPAu3
In all experiments special care was taken to eliminate the possibility of imaging artifacts due to sample preparation. All of the collagen samples (non-cross-linked, EDC-cross-linked and TPAu-cross-linked) were subjected to a “fiber-preserving” protocol, i.e., addition of glutaraldehyde and formaldehyde and multiple dehydration steps.28 While we could clearly identify the fibers within non-cross-linked collagen, we did not observe fibers with the TPAu-cross-linked gels. In addition, the reproducible presence of particles in the bulk phase and the differences in particle sizes for the same preparation protocols but different concentrations of TPAu, all suggest that the particles are not an artifact of the SEM preparation protocol. Finally, the gels with the low concentration of collagen (0.5%) and high concentration of TPAu (Figure 3D) were fully cross-linked (Figure 1) and thus had no collagen sites available for cross-linking (all the collagen free amino groups are used to form cross-links with TPAu). Consequently the addition of other cross-linking agents would not change the gel microstructure. In this case, after the “fiber preserving” protocol for SEM imaging, we still observed a particulate phase and lack of fibers.
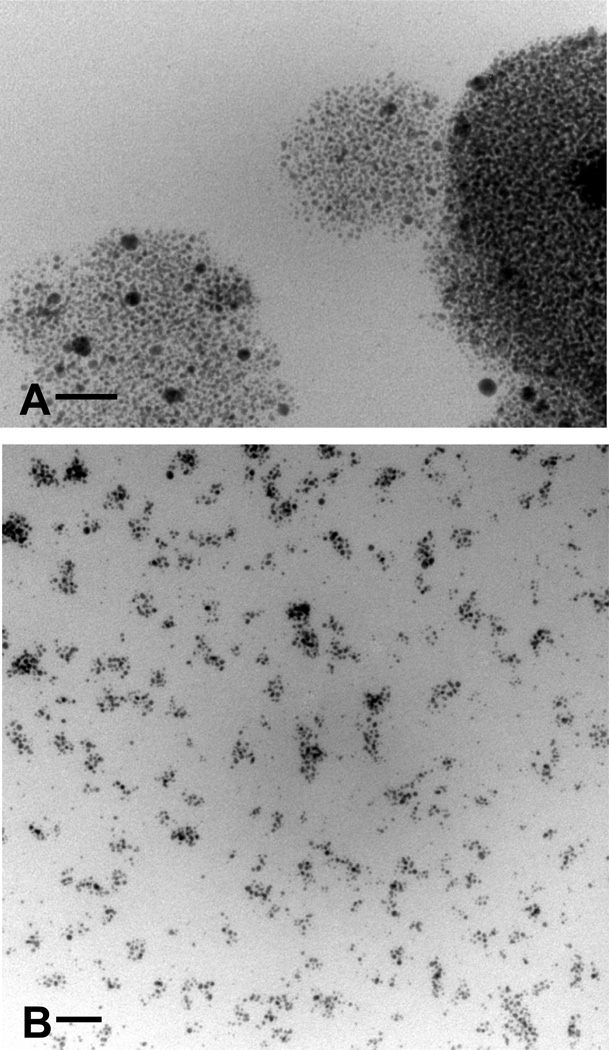
The size of the collagen-TPAu particles (above 50 nm) visible in the particulate phase is much larger than the size of the TPAu (2.4 nm) used for the cross-linking. TEM images were acquired to examine how the gold nanoparticle relates to the size of the collagen-TPAu particulate phase observed with SEM. Figure 5A shows the TEM of the 0.5% collagen modified with TPAu (the same sample was imaged with SEM in Figure 3C, D). We observed spherical objects that contained hundreds of TPAu nanoparticles. The size of the particles visible in Figure 5A was approximately 50–100 nm and coincides with the particle size observed with the SEM (Figure 3D).
Figure 5.
TEM images of lyophilized 0.5% (w/v) collagen gels preserved in Araldite resin. (A) TPAu-0.5% and (B) TPAu-0.5% at 1/3 the concentration of TPAu. The bar on the figures represents 20 nm.
Following a 3-fold decrease of the concentration of the TPAu for 0.5% collagen (Figure 5B) we observed rather irregular groups of TPAu (between 10–25 particles) separated by 10–30 nm. We hypothesize that the observed microstructure can be explained by the formation of smaller size (10–15 nm) collagen-TPAu particles.
We were unsuccessful in visualizing the collagen-TPAu in TEM by negative staining, indicating that there was no fibrillar structure present within the gel. Also, neither SEM nor TEM pictures indicated unequivocally whether the observed particulate phase was continuous. Moreover SEM and TEM did not allow us to determine whether the collagen-TPAu particles were interconnected. To investigate the interconnectivity of the collagen-TPAu particles, the mechanical properties of the gels were determined from viscoelastic measurements.
3.3 Collagen-TPAu Viscoelastic Properties
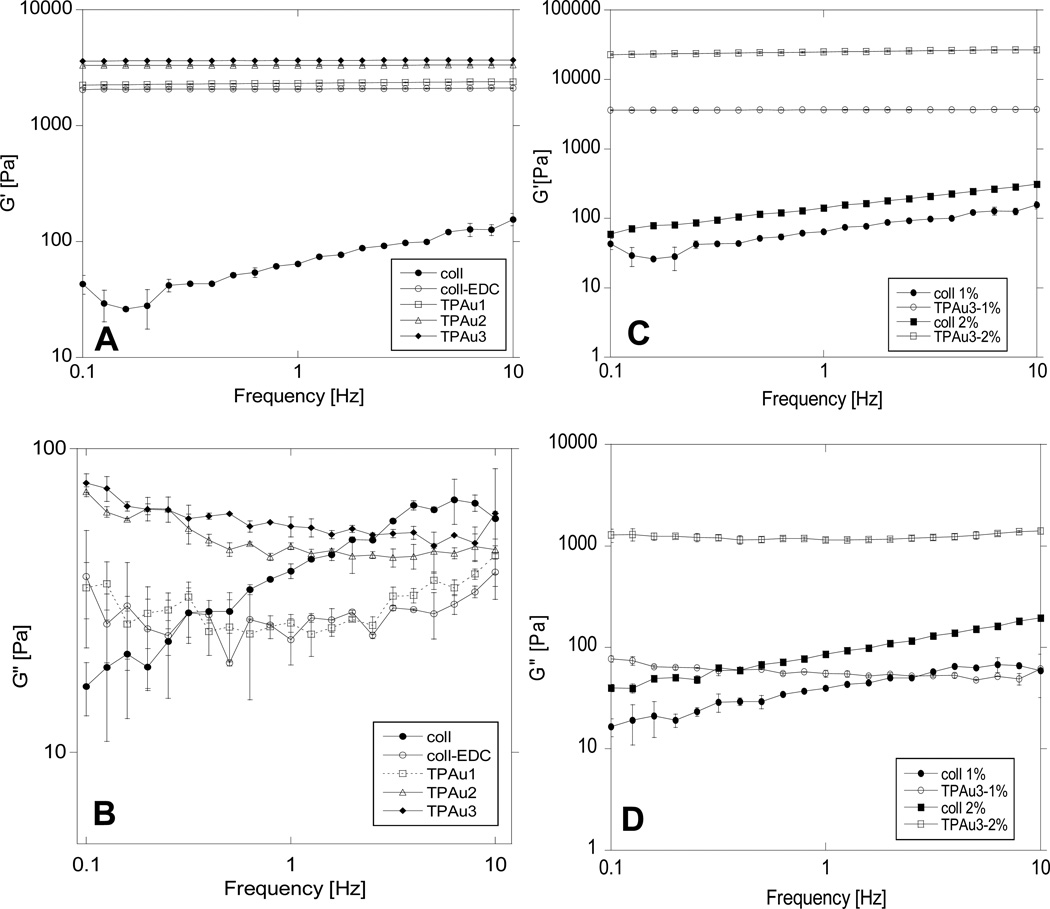
The viscoelastic properties of collagen gels modified with TPAu were determined by measuring storage and loss moduli. The collagen gel storage (G’) and loss (G”) modulus for 1% collagen samples are presented (Figure 6A,B) over a range of frequencies (0.1–10 Hz) that well represents the stress that the collagen scaffolds may experience in vivo during the tissue remodeling process, as stated by Francis-Sedlak et.al.29 In uncrosslinked collagen an increase in the frequency of oscillations results in a monotonic increase of both storage and loss moduli, consistent with previously reported data.29,30 Higher concentrations of collagen lead to larger G’ and G” due to an increase in gel viscosity. In the TPAu-cross-linked gels the storage modulus was constant and the loss modulus changed marginally within the frequencies tested. The results indicate that the gel is mechanically stable under these conditions.31 At all frequencies the storage modulus is larger than the loss modulus, which indicates gel-like behavior. Addition of cross-linking TPAu/EDC considerably increases the storage modulus for both 1% and 2% gels. indicating less compliant gels, with much higher values for 2% gels (Figure 6C,D). The loss modulus, which measures the viscous component of the gel, increases considerebly with addition of TPAu/EDC to 2% collagen. In 1% collagen G” increases with increasing level of cross-linking, most visibly between TPAu1 and TPAu2 (47% and 69% cross-linking degree, Figure 1) and to some small extent in TPAu3 (81% cross-linking degree). Comparing the loss moduli for 1% collagen gels cross-linked with TPAu to collagen, G” is larger for low frequencies (< about 1Hz) but smaller for frequencies above 1 Hz. In Table 1 the storage and loss moduli are compared for a low frequency (1.6 Hz) that approximates the biological environment 29 Interestingly, for a low degree of cross-linking the loss modulus of uncrosslinked collagen is larger than that of cross-linked collagen. This behavior has been reported earlier for collagen modified by glycation.29
Figure 6.
Storage and loss moduli from parallel plate rheometry of 1% (w/v) collagen gels (A,B) and 1% and 2% (w/v) collagen gels with and without TPAu (C,D). The error bars represent standard deviations calculated from three samples..
In the case of 1% collagen both G’ and G” increase monotonically with increased degree of cross-linking (with a much stronger dependence for G’, Figure 6A,B). The smallest addition of TPAu increases the degree of cross-linking from about 15% (EDC only) to 47%, which causes a large increase in storage modulus. Increasing the concentration of collagen in the gels considerably increases both G’ and G”, and this increase is much larger than the increase with the change in cross-linking (Figure 6C,D). In summary, all the materials studied had strong gel-like behavior with progressive changes typical for an increased level of cross-linking within the gel. This indicates that the gels are continuous and that the collagen-TPAu particles visible under SEM are connected.
3.4 Collagen-TPAu Gel Diffusion Hindrance
Electrochemical time-of-flight (ETOF) was used to measure the diffusion coefficient of 4HT (4-hydroxy-(2,2,6,6-tetramethylpiperidine-1-oxyl) in BPS buffer within collagen gels. The ETOF device consists of four 10 µm band electrodes separated by 10 µm gaps.23–26 The first electrode functioned as a generator, while the other three were used as collectors. Thus the total spacing for the probe to travel between electrodes was 15, 35 and 55 µm. These large distances allow 4-HT to interact with large volumes of the gel, thus avoiding problems related to possible “void” spaces between the gel and electrode formed after insertion of the device. The transient time was recorded for 20 seconds, and transit time τ⅓ was defined as the time to reach ⅓ of the plateau current for each gap. The diffusion coefficient (D) was determined by plotting transit time (τ⅓) versus the square of the distance (d) according to the equation:
where K is a constant dependent on the device geometry, determined by performing ETOF of 4HT in 0.01 M HCl and using the previously determined diffusion coefficient Do = 6.5 ± 0.4 × 10-−6 cm2/s.25,26 Table 2 lists the mass ratio of collagen to TPAu, diffusion coefficients, and diffusion hindrance of 4HT, D/Do, for the gels tested. The diffusion data of 4HT (rH = 0.34 nm) show that the addition of collagen and cross-linking agents to the solution results in a five-fold decrease in the diffusion coefficient, while the viscosity increases over 103-fold.25 Thus the tracer diffusion represents the structure of the gel, not the Stokesian diffusion of the tracer within the continuous medium. The lowest diffusion coefficient (1.6 ± 0.4 ×10⁻⁶ cm2/s) is recorded for uncross-linked collagen solution. The addition of EDC causes an increase in D and subsequent additions of TPAu result in a lowering of D. The differences in diffusion coefficient between gels with varying degree of cross-linking are small (1.6 to 2.8 ± 0.2 × 10⁻⁶ cm2/s), but statistically significant (one-way ANOVA, p<0.05). The initial addition of EDC to 1% collagen results in an increase in the diffusion coefficient of 4HP. We observed similar behavior in previous studies when glutaraldehyde was used as cross-linking agent and concluded that formation of cross-links causes rearrangement of collagen and results in micro-phase separation.25 The diffusion hindrance (D/Do) of the collagen gels is the largest for unmodified collagen (0.24) and drops with addition of EDC (0.42). gradually dropping to the native collagen gel hindrance value (Table 2). The diffusion hindrance of 4HT for native collagen gel is consistent with previously reported values.25 Even though the diffusion hindrance is affected by the formation of a particulate phase due to collagen cross-linking with TPAu, the changes are small. Thus transport through the gel is not strongly affected by the changes in the gel microstructure and the gel can be potentially used for applications in drug delivery.
Table 2.
Collagen gel compositions, diffusion coefficients of 4HT within each gel, and normalized diffusion hindrance for 4HT diffusion (D/Do) for the tested gels. Mass ratio refers to collagen to TPAu mass ratio. The error in measurements of diffusion coefficient was 0.1×10⁻⁶ cm2/s
| sample | mass ratio | D ×106 [cm2/s] | D/D 0 |
|---|---|---|---|
| coll | n/a | 1.6 | 0.24 |
| coll-EDC | n/a | 2.8 | 0.42 |
| TPAu-d1 | 5 | 2.4 | 0.36 |
| TPAu-d2 | 3.3 | 2.2 | 0.33 |
| TPAu-d3 | 1.7 | 1.9 | 0.28 |
| TPAu-d4 | 0.8 | 1.9 | 0.28 |
| TPAu-d5 | 0.6 | 1.6 | 0.24 |
The formation of such small (<200 nm) collagen particles (collagen-TPAu) is sometimes associated with the degradation of collagen’s secondary structure and thus formation of gelatin rather than collagen particles.32,33 As stated in the Introduction, the collagen cross-linked with TPAu stays in its helical form within the particulate phase.14 We believe that this provides evidence that the collagen-TPAu particles are interconnected.
Conclusion
Cross-linking of 1% collagen gels with 2.4 nm gold nanoparticles protected with tiopronin (a multivalent cross-linker) resulted in the formation of an unusual gel morphology: a particulate phase containing interconnected, small collagen-TPAu particles (150–400 nm). The gels do not contain visible fibrillar structures, but exhibit larger mechanical stability than non-cross-linked collagen. In-situ measurements of the diffusion hindrance of the gels revealed a lack of significant changes with different TPAu concentrations. The mechanical stability and diffusion characteristics of the collagen-TPAu gel suggest potential applications in drug delivery..
Highlights.
Collagen gels cross-linked with Au-nanoparticles were synthesized and characterized
The gels contain unusual morphology: interconnected collagen-Au-nanoparticle particles (150–400 nm)
The gels are compliant, mechanically stable, and continuous
Electrochemical measurements show the gel hindrance nearly independent of the Au-nanoparticle concentration
Acknowledgements
The work was partially supported by a Research Corporation Cottrell Collage Science Award (CC7696). The work was also partially supported through The Aerospace Corporation’s internally funded Independent Research and Development (IR&D) program and the National Institutes of Health (GM099594-01). The SEM images were recorded at the University of California at Riverside. We would like to extend our gratitude to Dr. Tom Douglass (CSULB, Department of Biological Sciences) for help with the TEM.
Footnotes
Publisher's Disclaimer: This is a PDF file of an unedited manuscript that has been accepted for publication. As a service to our customers we are providing this early version of the manuscript. The manuscript will undergo copyediting, typesetting, and review of the resulting proof before it is published in its final citable form. Please note that during the production process errors may be discovered which could affect the content, and all legal disclaimers that apply to the journal pertain.
References
- 1.Wallace DG, Rosenblatt J. Adv. Drug Delivery Rev. 2003;55:1631. doi: 10.1016/j.addr.2003.08.004. [DOI] [PubMed] [Google Scholar]
- 2.Nimni ME, Cheung D, Strates B, Kodama M, Sheikh KJ. Biomed. Mater. Res. 1987;21:741. doi: 10.1002/jbm.820210606. [DOI] [PubMed] [Google Scholar]
- 3.Ruszczak Z. Adv. Drug Delivery Rev. 2003;55:1595. doi: 10.1016/j.addr.2003.08.003. [DOI] [PubMed] [Google Scholar]
- 4.Israelowitz M, Rizvi SWH, Kramer J, Von Schroeder HP. Protein Engineering, Design & Selection. 2005;18:329. doi: 10.1093/protein/gzi037. [DOI] [PubMed] [Google Scholar]
- 5.Wise DL. Biomaterials and bioengineering handbook. New York, NY: Marcel Dekker; 2000. [Google Scholar]
- 6.Schoof H, Apel J, Heschel I, Rau G. J Biomed Mater Res (Appl Biomater) 2001;58:352. doi: 10.1002/jbm.1028. [DOI] [PubMed] [Google Scholar]
- 7.Matthews JA, Wnek GE, Simpson DG, Bowlin GL. Biomacromolec. 2002;3:232. doi: 10.1021/bm015533u. [DOI] [PubMed] [Google Scholar]
- 8.Rault I, Frei V, Herbage D, Adbul-Marak N, Hue A. J. Mater. Sci. Mater. Med. 1996;7:215. [Google Scholar]
- 9.Barbucci R, editor. Integrated Biomaterials Science. New York: Kulwer Academic / Plenum Publishers; 2002. [Google Scholar]
- 10.Tierney CM, Jaasma MJ, O'Brien FJ. J Biomed Mater Res A. 2009;91:92. doi: 10.1002/jbm.a.32207. [DOI] [PubMed] [Google Scholar]
- 11.Cao H, Xu SY. J Mater Sci Mater Med. 2008;19:567. doi: 10.1007/s10856-007-3281-5. [DOI] [PubMed] [Google Scholar]
- 12.Duan X, Sheardown H. J. Biomed. Mater. Res. Part A. 2005;75:510. doi: 10.1002/jbm.a.30475. [DOI] [PubMed] [Google Scholar]
- 13.Duan X, Sheardown H. Biomaterials. 2006;27:4608. doi: 10.1016/j.biomaterials.2006.04.022. [DOI] [PubMed] [Google Scholar]
- 14.Castaneda L, Valle J, Yang N, Pluskat S, Slowinska K. Biomacromolecules. 2008;9:3383. doi: 10.1021/bm800793z. [DOI] [PMC free article] [PubMed] [Google Scholar]
- 15.Castaneda L, Pluskat S, Ky D, Te E, Slowinska K, in Naik RR, Perry CC, Shiba K, Ulijn R. The Nature of Design—Utilizing Biology’s Portfolio, Mater. Res. Soc. Symp. Proc. 1008E. Warrendale, PA: 2007. pp. T09–T08. [Google Scholar]
- 16.Graham JS, Miron Y, Grandbois M. J. Mol. Recognit. 2011;24:477. doi: 10.1002/jmr.1131. [DOI] [PubMed] [Google Scholar]
- 17.Whelove OE, Cozad MJ, Lee BD, Sengupta S, Bachman SL, Ramshaw BJ, Grant SA. J Biomed Mater Res B. 2011;99:142. doi: 10.1002/jbm.b.31881. [DOI] [PubMed] [Google Scholar]
- 18.Brust M, Walker M, Bethell D, Schiffrin DJ, Whyman R. J. Chem. Soc. Chem. Commun. 1994:801. [Google Scholar]
- 19.Templeton AC, Chen S, Gross SM, Murray RW. Langmuir. 1998;15:66. [Google Scholar]
- 20.Ho HO, Lin LH, Sheu MT. J. Control. Release. 1997;44:103. [Google Scholar]
- 21.Cheung DT, Perelman N, Ko EC, Nimni ME. Conn. Tiss. Res. 1985;13:109. doi: 10.3109/03008208509152389. [DOI] [PubMed] [Google Scholar]
- 22.Sheu MT, Huang JC, Yeh GC, Ho HO. Biomaterials. 2001;22:1713. doi: 10.1016/s0142-9612(00)00315-x. [DOI] [PubMed] [Google Scholar]
- 23.Feldman BJ, Feldberg SW, Murray RW. J. Phys. Chem. 1987;91:6558. [Google Scholar]
- 24.Slowinska K, Feldberg SW, Majda M. J. Electroanal. Chem. 2003;554:61. [Google Scholar]
- 25.Ky D, Liu CK, Marumoto C, Castaneda L, Slowinska K. J. Control. Release. 2006;112:214. doi: 10.1016/j.jconrel.2006.02.005. [DOI] [PubMed] [Google Scholar]
- 26.Liu CK, Valle J, Slowinska K. Bioelectrochemistry. 2008;74:195. doi: 10.1016/j.bioelechem.2008.08.002. [DOI] [PubMed] [Google Scholar]
- 27.Tierneya CM, Haugha MG, Liedla J, Mulcahya F, Hayesa B, O’Briena FJ. J. Mech. Behav. Biomed. Mater. 2009;2:202. doi: 10.1016/j.jmbbm.2008.08.007. [DOI] [PubMed] [Google Scholar]
- 28.Yang Y, Kaufman LJ. Biophys. J. 2009:1566. doi: 10.1016/j.bpj.2008.10.063. [DOI] [PMC free article] [PubMed] [Google Scholar]
- 29.Francis-Sedlak ME, Uriel S, Larson JC, Greisler HP, Venerus DC, Brey EM. Biomaterials. 2009;30:1851. doi: 10.1016/j.biomaterials.2008.12.014. [DOI] [PubMed] [Google Scholar]
- 30.Stuart K, Panitch A. Biopolymers. 2008;89:841. doi: 10.1002/bip.21024. [DOI] [PubMed] [Google Scholar]
- 31.Sundararaghavan HG, Monteiro GA, Lapin NA, Chabal YJ, Miksan JR, Shreiber DI. J. Biomed. Mater. Res. A. 2008;87A:308. doi: 10.1002/jbm.a.31715. [DOI] [PubMed] [Google Scholar]
- 32.Nicklas M, Schatton W, Heinemann S, Hanke, Kreuter J. Drug Dev. Ind. Pharmacy. 2009;35:1035. doi: 10.1080/03639040902755213. [DOI] [PubMed] [Google Scholar]
- 33.Rossler B, Kreuter J, Scherer D. J. Microencapsulation. 1995;12:49. doi: 10.3109/02652049509051126. [DOI] [PubMed] [Google Scholar]


