Abstract
Network-based analyses of high-dimensional biological data often produce results in the form of tree structures. Generating easily interpretable layouts to visualize these tree structures is a non-trivial task. We present a new visualization algorithm to generate two-dimensional layouts for complex tree structures. Implementations in both MATLAB and R are provided.
Keywords: tree, visualization, matlab
1 Introduction
Network-based analyses of high-dimensional biological data often produce results in the form of tree structures [1, 2, 3, 4, 5, 6]. Visualizing these tree structures in an easily interpretable layout is a non-trivial task. Existing methods that generate automatic layouts include circular layout with various ordering schemes, spring embedding [7], multidimensional scaling [8], and high-dimensional embedding [9].
Circular layout algorithms place nodes on a circle with equal spacing. Various schemes can be used to determine the order of the nodes, such as ordering by node degree, or ordering by spectral analysis to minimize edge crossings. These algorithms are easy to implement, but the resulting layouts are diffcult to interpret.
Spring embedding produce graph layouts by employing principles of mechanical systems. Edges in a graph are modeled by springs. Nodes are connected by the springs, creating attractive and repulsive forces between each pair of nodes. Node pairs that are not adjacent are connected by looser springs. Starting from an initial layout, an iterative algorithm is used to find the layout that minimizes the overall potential energy. Depending on the initialization scheme and the iterative optimization algorithm, a layout generated by spring embedding may represent a local minimum. Consequently, multiple runs of spring embedding may produce different layouts.
Both multidimensional scaling and high-dimensional embedding derive a distance matrix from the graph, and then use either optimization or principle component analysis to determine a layout. These two approaches generally produce easily interpretable layouts for relatively simple tree structures. However, when visualizing complex tree structures, nodes can overlap.
We present a new algorithm, TreeVis, for visualizing tree structures. TreeVis generates a layout that emphasizes the longest path and major branches of a tree structure. The algorithm first rearranges the nodes in the longest path into an arch-like shape. Then, the remaining nodes are sequentially appended using a modified Fruchterman and Reingold graph layout algorithm [10], so that smaller branches are oriented pointing outwards from the arch that represents the longest path.
There are several existing toolboxes for graph visualization, such as Cytoscape [7], Graphviz [11], RGraphviz, and Graphlet [12], implemented in Java, C++/GTL and R. Since MATLAB is extensively used in analyzing high-throughput bioinformatics data, we implemented TreeVis using MATLAB. We also provide an R implementation.
2 Method
The TreeVis algorithm emphasizes on the longest path and major branches of a tree structure. Different from most existing visualization algorithms that determine the visualization positions of all nodes at the same time, TreeVis orders the tree nodes and visualizes them sequentially.
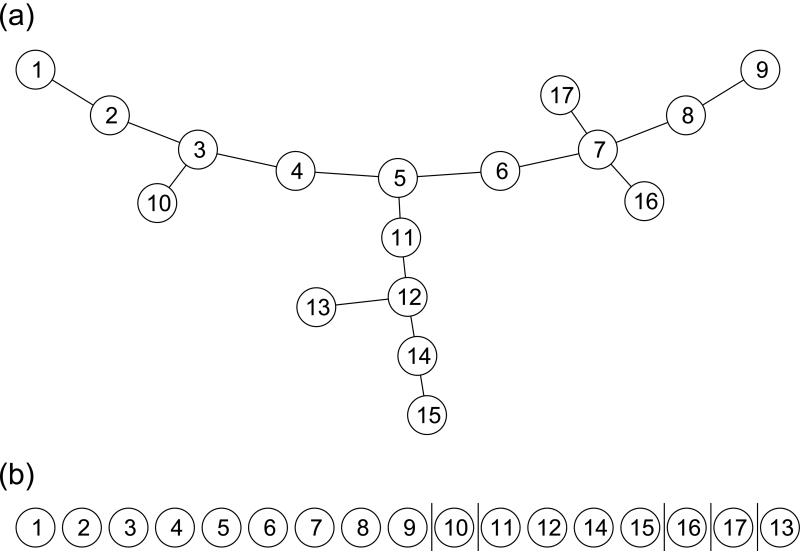
The ordering of the tree nodes is derived as follows. TreeVis breaks the tree into chains of nodes. The longest chain is defined as the main chain. Chains that are directly connected to the main chain are defined as the side chains of the main chain. For complex tree structures, each side chain may also have its own lower level side chains. Tree nodes are arranged in an order such that nodes in the main chain come first, followed by nodes in the side chains of the main chain, and then the lower level side chains. An example is shown in Figure 1. In Figure 1(a), there are three longest chains of equal length. The main chain is randomly chosen from them. The ordering, shown in Figure 1(b), starts with the main chain, which is composed of nodes 1 to 9, followed by the side chains. Node 10 is a side chain attached to node 3. Nodes 11, 12, 14, 15 constitute a side chain attached to node 5. Nodes 16 and 17 are two side chains attached to node 7. After the side chains of the main chain are included, lower level side chains are appended, i.e. node 13 is a lower level side chain attached to node 12.
Figure 1.
(a) An example tree structure visualized by TreeVis; (b) TreeVis constructed the layout by sequentially appending nodes to the main chain, which is the longest path. The node ordering used when TreeVis generated the layout is shown here. Vertical lines separate main chain and side chains.
After ordering the tree nodes, TreeVis rearranges nodes in the main chain on an arch-like curve, with unit distance between adjacent nodes. The remaining nodes are appended one at a time, according to the ordering defined above. A modified Fruchterman and Reingold algorithm [10] is used to determine the position of a new node to be appended. Between the new node and each existing node in the layout, we assume a repelling force, which is inversely proportional to their distance. Each edge is assumed to be a string whose length is less than or equal to unit distance. Since the new node is attached to one of the nodes whose positions are already determined, the position of the new node is within a unit radius disk of the node it is appended to. TreeVis exhaustively examines all positions within that unit disk, and place the new node at the position where it is under balanced forces.
As a result of the above procedure, the TreeVis layout always has an arch-like backbone, with smaller branches oriented pointing outwards from the backbone. One example is shown in Figures 1(a). TreeVis is a deterministic algorithm, meaning that multiple runs of TreeVis on the same tree structure will produce the same layout. We have found this method favorable when visualizing complex tree structures with relatively large numbers of nodes.
3 Results
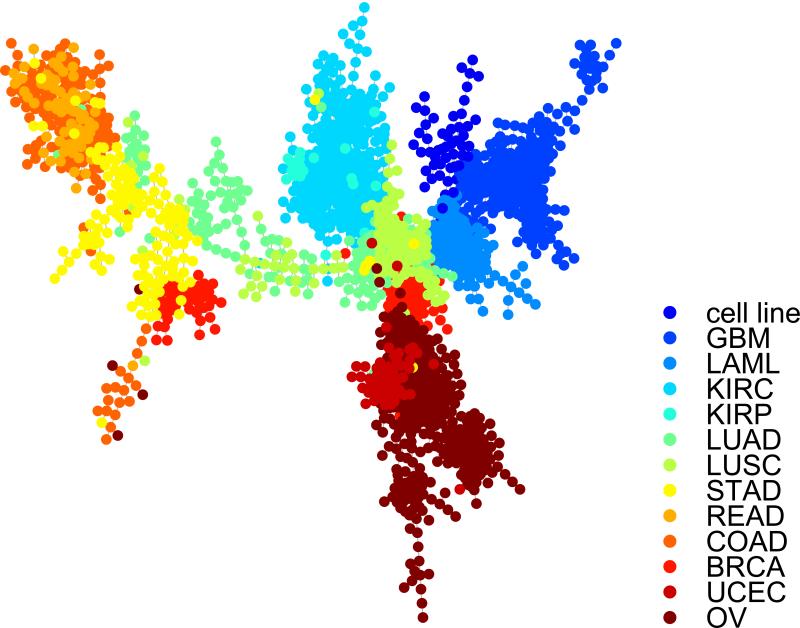
We have applied TreeVis to visualize trees in several recent publications, in which the number of tree nodes ranged from 20 to 300 [3, 4, 6]. Here, we provide the TreeVis result for a complex tree, which contains 2491 nodes. The tree is derived from the methylation data of 2491 samples generated by The Cancer Genome Atlas (TCGA). The samples are composed of cell lines and 12 cancer types. We selected 200 CpG sites using conditional correlation [13], and used the methylation data of those CpG sites to build a minimum-spanning tree. The tree describes the similarities among the samples according to their methylation status of the selected CpG sites. TreeVis took the the 2491*2491 adjacency matrix of the tree as input, and automatically produced the layout shown in Figure 2. When visualizing the tree, we used different colors for different cancer types. Due to the large size of the tree, nodes inevitably overlapped. However, the clustering according to tissue types is evident.
Figure 2.
TreeVis generated visualization for a complex tree structure that contains 2491 nodes. Each node corresponds to one cancer sample, collected by The Cancer Genome Atlas (TCGA) and profiled using Illumina methylation array. The 2491 samples are composed of cell line controls and 12 different cancer types. The tree structure describes the similarities among the samples in terms of methylation.
4 Conclusion
For bioinformatic analyses that produce tree structures, visualization is essential to the interpretation of the results. We present a new visualization algorithm, TreeVis, to generate easily interpretable and visually appealing layouts for complex tree structures. Implementations in both MATLAB and R are available at http://odin.mdacc.tmc.edu/~pqiu/software/TreeVis/index.htm
Table 1.
TCGA abbreviation of cancer types.
| GBM | Glioblastoma multiforme |
| LAML | Acute myeloid leukemia |
| KIRC | Kidney renal clear cell carcinoma |
| KIRP | Kidney renal papillary cell carcinoma |
| LUAD | Lung adenocarcinoma |
| LUSC | Lung squamous cell carcinoma |
| STAD | Stomach adenocarcinoma |
| READ | Rectum adenocarcinoma |
| COAD | Colon adenocarcinoma |
| BRCA | Breast invasive carcinoma |
| UCEC | Uterine corpus endometrioid carcinoma |
| OV | Ovarian serous cystadenocarcinoma |
Acknowledgement
We gratefully acknowledge funding from the TCGA Genome Data Analysis Center (GDAC) grant and the Cancer Center Support Grant at University of Texas MD Anderson Cancer Center (U24 CA143883 02 S1 and P30 CA016672), as well as the NCI funded Center for Cancer Systems Biology at Stanford (grant U56 CA112973).
Footnotes
Publisher's Disclaimer: This is a PDF file of an unedited manuscript that has been accepted for publication. As a service to our customers we are providing this early version of the manuscript. The manuscript will undergo copyediting, typesetting, and review of the resulting proof before it is published in its final citable form. Please note that during the production process errors may be discovered which could affect the content, and all legal disclaimers that apply to the journal pertain.
Conflict of Interest
None declared.
References
- 1.Xu Y, Olman V, Xu D. Clustering gene expression data using a graph-theoretic approach: an application of minimum spanning trees. Bioinformatics. 2002;18(4):536–545. doi: 10.1093/bioinformatics/18.4.536. [DOI] [PubMed] [Google Scholar]
- 2.Park Y, Shackney S, Schwartz R. Network-based inference of cancer progression from microarray data. IEEE/ACM Trans. on Computational Biology and Bioinformatics. 2009;6(2):200–212. doi: 10.1109/TCBB.2008.126. [DOI] [PubMed] [Google Scholar]
- 3.Qiu P, Gentles A, Plevritis S. Discovering biological progression underlying microarray samples. PLoS Computational Biology. 2011;7(4):e1001123. doi: 10.1371/journal.pcbi.1001123. [DOI] [PMC free article] [PubMed] [Google Scholar]
- 4.Qiu P, Simonds EF, Bendall SC, Gibbs K, Jr., Bruggner RV, Linderman MD, Sachs K, Nolan GP, Plevritis SK. Extracting a cellular hierarchy from high-dimensional cytometry data with SPADE. Nature Biotechnology. 2011;29(10):886–891. doi: 10.1038/nbt.1991. [DOI] [PMC free article] [PubMed] [Google Scholar]
- 5.Bendall SC, Simonds EF, Qiu P, Amir ED, Krutzik PO, Finck R, Bruggner RV, Melamed R, Ornatsky OI, Balderas RS, Plevritis SK, Sachs K, Pe'er D, Tanner SD, Nolan GP. Single cell mass cytometry of differential immune and drug responses across the human hematopoietic continuum. Science. 2011;332(6030):687–696. doi: 10.1126/science.1198704. [DOI] [PMC free article] [PubMed] [Google Scholar]
- 6.Qiu P. Inferring phenotypic properties from single-cell characteristics. PLoS One. 2012;7(5):e37038. doi: 10.1371/journal.pone.0037038. [DOI] [PMC free article] [PubMed] [Google Scholar]
- 7.Shannon P, Markiel A, Ozier O, Baliga N, Wang J, Ramage D, Amin N, Schwikowski B, Ideker T. Cytoscape: a software environment for integrated models of biomolecular interaction networks. Genome research. 2003;13(11):2498–2504. doi: 10.1101/gr.1239303. [DOI] [PMC free article] [PubMed] [Google Scholar]
- 8.Cox TF, Cox MAA. Multidimensional Scaling. Chapman & Hall/CRC; 2000. [Google Scholar]
- 9.Harel D, Koren Y. Graph drawing by high-dimensional embedding. J. Graph Algorithms and Applications. 2004;8:195–214. [Google Scholar]
- 10.Fruchterman T, Reingold E. Graph drawing by force-directed placement. Softw. Exp. Pract. 1991;21:1129–1164. [Google Scholar]
- 11.Ellson J, Gansner ER, Koutsofios E, North SC, Woodhull G. Graph Drawing Software. Springer-Verlag; 2004. Graphviz and dynagraph – static and dynamic graph drawing tools. pp. 127–148. [Google Scholar]
- 12.Himsolt M. Graphlet: design and implementation of a graph editor. Softw. Exp. Pract. 2000;30(11):1303–1324. [Google Scholar]
- 13.Qiu P, Zhang L. Identification of markers associated with global changes in DNA methylation regulation in cancers. BMC Bioinformatics. 2012 doi: 10.1186/1471-2105-13-S13-S7. in press. [DOI] [PMC free article] [PubMed] [Google Scholar]


