Abstract
Many pathological states involve dysregulation of mitochondrial fusion, fission, or transport. These dynamic events are usually studied in cells lines because of the challenges in tracking mitochondria in tissues. To investigate mitochondrial dynamics in tissues and disease models, we generated two mouse lines with photo-activatable mitochondria (PhAM). In the PhAMfloxed line, a mitochondrially localized version of the photo-convertible fluorescent protein Dendra2 (mito-Dendra2) is targeted to the ubiquitously expressed Rosa26 locus, along with an upstream loxP-flanked termination signal. Expression of Cre in PhAMfloxed cells results in bright mito-Dendra2 fluorescence without adverse effects on mitochondrial morphology. When crossed with Cre drivers, the PhAMfloxed line expresses mito-Dendra2 in specific cell types, allowing mitochondria to be tracked even in tissues that have high cell density. In a second line (PhAMexcised), the expression of mito-Dendra2 is ubiquitous, allowing mitochondria to be analyzed in a wide range of live and fixed tissues. By using photo-conversion techniques, we directly measured mitochondrial fusion events in cultured cells as well as tissues such as skeletal muscle. These mouse lines facilitate analysis of mitochondrial dynamics in a wide spectrum of primary cells and tissues, and can be used to examine mitochondria in developmental transitions and disease states.
Keywords: mitochondrial fusion, organelle trafficking, neurodegeneration, mouse model, Cre reporter
INTRODUCTION
In recent years, the dynamic properties of mitochondria have become increasingly appreciated. Mitochondria are dynamic and mobile organelles that continually undergo fusion and fission (division). These opposing processes control the morphology of mitochondria, and more importantly, also regulate their physiological functions (Detmer and Chan, 2007). As a result, mitochondrial fusion and fission impact cellular respiration, apoptosis, necrosis, and maintenance of mitochondrial DNA. Multiple neurodegenerative diseases have also been associated with defects in mitochondrial dynamics (Chen and Chan, 2009).
Most studies of mitochondrial dynamics rely on cultured cells, where mitochondria can be imaged at high resolution. In cell lines, the fusion of mitochondria can be directly measured using photo-activatable fluorescent proteins targeted to the mitochondria (Karbowski et al., 2004). There is a pressing need to extend such studies to tissues, particularly where cell-based models are inadequate in recapitulating complex cellular interactions. It is important to be able to study a broad range of tissues, given that mitochondrial dynamics has been shown to affect the physiology of multiple systems, including the placenta, central nervous system, peripheral nervous system, skeletal muscle, and cardiac muscle (Alexander et al., 2000; Chen et al., 2003; Chen et al., 2007; Chen et al., 2010; Delettre et al., 2000; Ishihara et al., 2009; Wakabayashi et al., 2009; Waterham et al., 2007; Zuchner et al., 2004). Moreover, the metabolism of tissues can change during developmental transitions, and methods are needed to track mitochondria during such processes. To address this need, we have developed mouse models in which the photo-convertible fluorescent protein Dendra2 can be used to track mitochondria. These mouse models allow mitochondria to be readily studied in fixed and live tissues. Furthermore, the photo-switchable properties of Dendra2 allow subsets of mitochondria to be precisely monitored within a dense mitochondrial network.
RESULTS AND DISCUSSION
Generation of mice with photo-activatable mitochondria
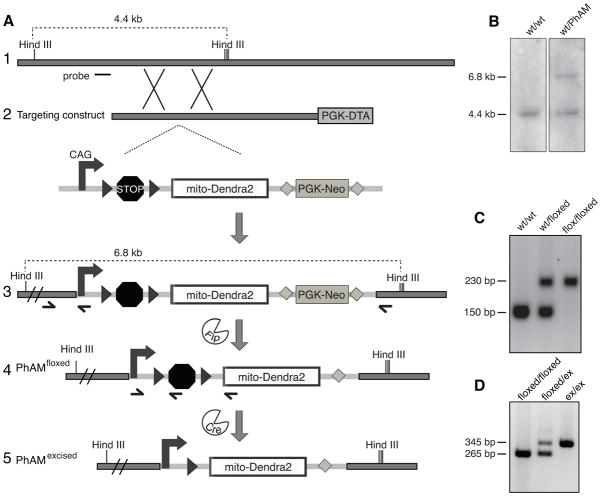
We used homologous recombination in mouse embryonic stem (ES) cells to insert an expression cassette containing mito-Dendra2 (a version of Dendra2 targeted to the mitochondrial matrix) into the ubiquitously expressed Rosa26 locus. The expression cassette included the CAG (cytomegalovirus/β-actin) enhancer-promoter, which has been reported to enhance expression several fold compared to the endogenous Rosa26 promoter (Chen et al., 2011). A loxP-flanked (floxed) termination sequence upstream of mito-Dendra2 provides Cre-regulated expression (Fig. 1A). Once mice were generated from correctly targeted embryonic stem cells (Fig. 1B), the neomycin selection cassette was removed to generate the PhAMfloxed line (Fig. 1A, C). In this mouse line, mito-Dendra2 expression relies on Cre-mediated excision of the termination sequence. These mice can be maintained as heterozygotes or homozygotes without apparent defects in viability or fertility.
Figure 1. Construction of PhAMfloxed and PhAMexcised mouse lines.
(A) Targeting of mito-Dendra2 into the Rosa26 locus. Homologous recombination of the targeting construct (schematic 2) in embryonic stem cells results in insertion of the Cre-dependent mito-Dendra2 cassette into the Rosa26 locus (schematic 3). In mice, removal of the neomycin selection marker by Flp recombinase results in the PhAMfloxed line (schematic 4), which can be mated to a Cre driver line to obtain cell-specific labeling of mitochondria. Germline excision of the termination signal produces the PhAMexcised line (schematic 5). Black arrowheads, loxP sites; stop symbol, termination cassette; gray diamonds, frt sites; half arrows, PCR primers for genotyping; short horizontal line, probe for Southern blot. (B) Representative Southern blot analysis of ES cell clones. Genomic DNA was digested with HindIII and hybridized with the Rosa26 probe indicated in schematic 1 of (A). (C) PCR genotyping of the PhAMfloxed strain for the wild-type or knock-in allele using the set of three primers in schematic 3 of (A). (D) PCR genotyping of the PhAMexcised strain using the three primers in schematic 4 of (A).
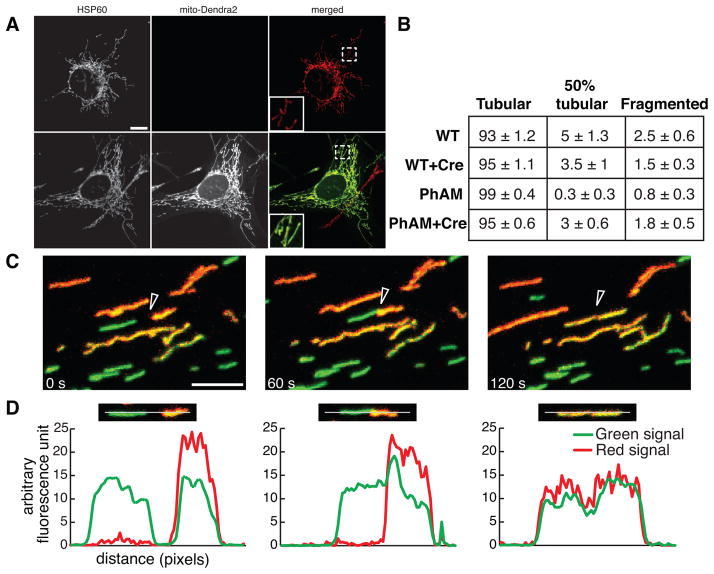
To determine the potential of the PhAMfloxed line in tracking mitochondrial dynamics, tail fibroblasts were isolated for image analysis. No Dendra2 fluorescence was detected in these cells (Fig. 2A top panel). Upon expression of Cre recombinase, the cells show bright green fluorescence that co-localizes precisely with HSP-60, a marker of the mitochondrial matrix (Fig. 2A, bottom panel). Quantitative profiling of mitochondrial morphology indicates that expression of mito-Dendra2 does not alter the morphology of the mitochondrial network (Fig. 2B).
Figure 2. Tracking of mitochondria in PhAMfloxed tail fibroblasts.
(A) Representative images of mitochondria in tail fibroblasts cultured from the PhAMfloxed mice. Tail fibroblasts were cultured in the absence (top) or presence of Cre-expressing retrovirus (bottom). Mitochondria are identified by immunostaining for HSP60 (red). The mito-Dendra2 fluorescence (green) was found only after expression of Cre. Mitochondrial morphology remains tubular (inset). Scale bar is 10 μm. (B) Quantification of mitochondrial morphology in wildtype and PhAMfloxed fibroblasts. The table shows the percentage of cells with the indicated morphology ± SEM (n=4). (C) Monitoring mitochondrial fusion in PhAMfloxed fibroblasts. A subset of mitochondria was photo-converted (red) and tracked by time-lapse imaging. Three still images from the resulting movie highlight a mitochondrial fusion event (arrowhead) and exchange of matrix contents. Scale bar is 5 μm. (D) Fluorescence line analysis of the two mitochondria undergoing fusion in the frames from (C). Each plot measures the red and green signals along the drawn line. The line analysis demonstrates that mitochondrial fusion results in the transfer of red fluorescence to the adjoining mitochondrion.
Taking advantage of the photo-switchable properties of Dendra2, we used a 405 nm laser to photo-convert a sub-population of mitochondria in live fibroblasts. After photo-conversion, the mitochondria switch to red fluorescence (Fig. 2C). In fluorescence time-lapse movies, we observed both transport and fusion of these labeled mitochondria. Fusion events between the red and green mitochondria result in the transfer of fluorescence signal, an indication of matrix mixing (Figure 2C, D).
Widespread expression of mito-Dendra2
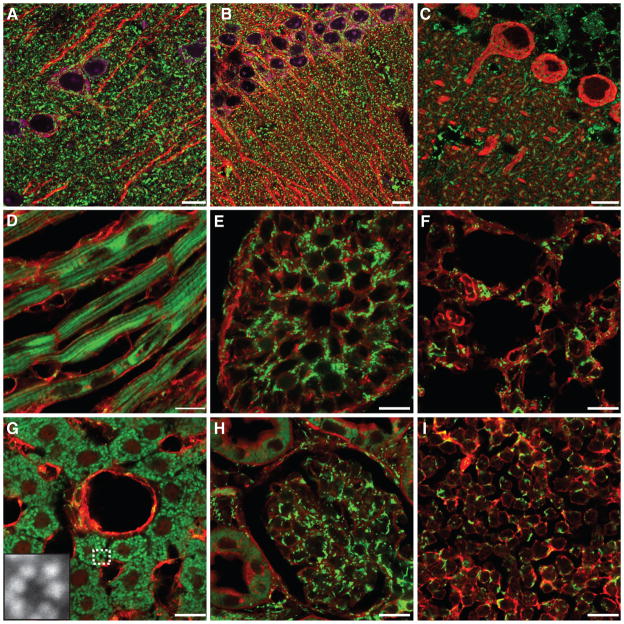
We generated mice with ubiquitous expression of mito-Dendra2 by crossing the PhAMfloxed mice to Meox2-Cre mice. The resulting mouse line, referred to as PhAMexcised, lacks the floxed termination cassette (Fig. 1A, D). In tissue sections, all organs isolated from these animals exhibit bright mito-Dendra2 fluorescence localized specifically to the mitochondrial compartment. Widespread expression is found in the central nervous system, heart, testis, lung, liver, kidney, and thymus (Fig. 3 and S1). Therefore, the PhAMexcised line can be used to survey mitochondrial morphology in a wide range of tissues. For example, cardiomyocytes contain linearly aligned mitochondria in contrast to the punctate structures found in hepatocytes (compare Fig. 3D to 3G). Homozygous PhAMexcised mice are viable and fertile.
Figure 3. Ubiquitous expression of mito-Dendra2 in PhAMexcised tissues.
Frozen tissue sections from the PhAMexcised mice. (A) pyramidal neurons in the cortex; (B) pyramidal neurons in the hippocampus; (C) Purkinje neurons of the cerebellum; (D) myocardium; (E) testis; (F) lung; (G) liver cannula, inset shows magnified image of the boxed region; (H) kidney cortex; (I) thymus. Cell counter stains are shown in red or purple. In (A–B), anti-Map2 (red) stains the dendritic processes of neurons; in (A–B), a fluorescent Nissl stain (purple) marks neurons; in (C), anti-calbindin (red) highlights Purkinje neurons; in (D–I), wheat germ agglutinin (WGA) labels cell borders. Scale bars, 10 μm.
Tracking of mitochondria in live cells and tissues
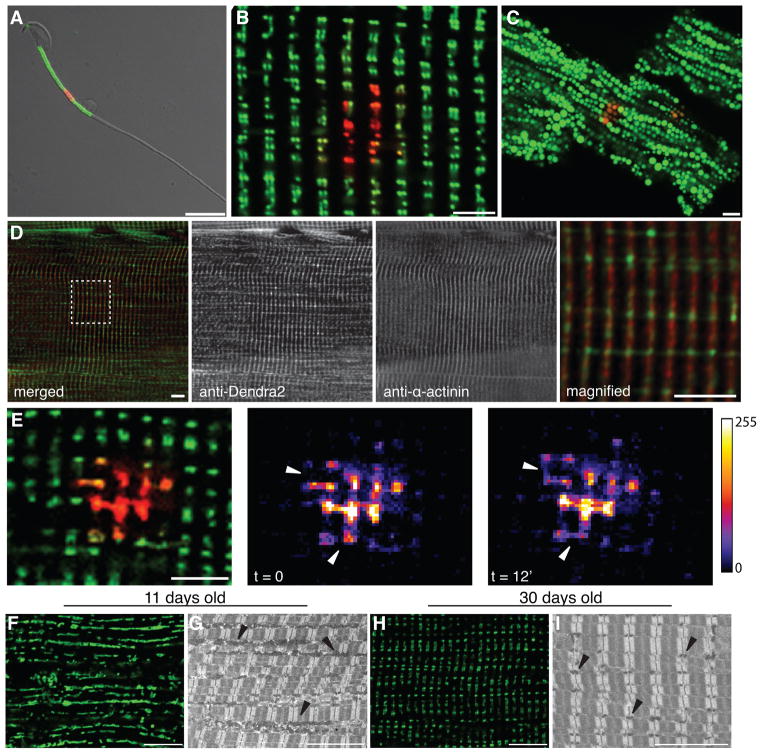
Live cells can be isolated from PhAMexcised mice to facilitate imaging of the mitochondrial network (Fig. 4). In live mouse sperm (Fig. 4A), we observed a region of intense mito-Dendra2 fluorescence in the midpiece. This fluorescence pattern is consistent with ultra-structural data showing cylindrical packing of mitochondria around the midpiece of the spermatozoa (Cardullo and Baltz, 1991). We were unable to resolve individual mitochondria, suggesting that these mitochondria are packed tightly. When a small portion of the midpiece was illuminated with the 405 nm laser, we found that the photo-converted region was stable, indicating that the packed mitochondria are discrete and do not share matrix contents.
Figure 4. Imaging of mito-Dendra2 in live isolated cells.
The fluorescence of mito-Dendra2 (green) was imaged in a (A) spermatocyte, (B) myofiber, and (C) cardiomyocyte. In each case, a subset of mitochondria was irradiated with a 405 nm laser to photo-switch mito-Dendra2 (red). (D) Comparison of mito-Dendra2 (green) in a fixed myofiber with the Z-disc marker α-actinin (red). Since the myofiber in (D) was processed for immunostaining, the resolution of mitochondrial doublets is lower than (B). The far right panel is a higher magnification image of the boxed region. (E) Detection of mitochondrial fusion in isolated EDL muscle from a 2-month old animal. A subset of mitochondria was photo-converted and tracked. Intensity maps of the photo-converted signal show two mitochondrial fusion events (marked by arrowheads) over a 12-minute period. In the top fusion event, the transfer of red signal into an unconverted mitochondrion was detected. In the bottom event, fusion occurs between two photo-converted mitochondria and results in equalization of the intensity. Intensity values of the heat maps are indicated in the legend. Scale bars: 10 μm for sperm and 5 μm for myofibers and cardiomyocyte. (F, H) Changes in mitochondrial structure during postnatal muscle development. Whole EDL muscles were isolated and imaged by mito-Dendra2 fluorescence at indicated ages. Scale bars: 5 μm. (G, I) Ultrastructural analysis of fixed EDL sections. Mitochondria are indicated by arrowheads. Scale bars: 10 μm.
We also examined mitochondria in dissociated tissues and intact skeletal muscles. In collagenase-digested myofibers, mito-Dendra2 fluorescence is arranged in a repeating pattern of doublets (Fig. 4B and S2). In fixed myofibers, mito-Dendra2 signal localizes adjacent to the Z-disk marker, α-actinin (Fig. 4D). This pattern is consistent with ultra-structural studies showing the stereotyped architecture of mitochondria in skeletal muscle (Ogata and Yamasaki, 1997). In dissociated cardiomyocytes, mitochondria are arranged in linear arrays (Fig. 4C and S2). In each case, the photo-conversion of Dendra2 provides higher resolution of mitochondria in dense networks (Fig. S2).
To test whether mitochondria can be tracked in live tissues, we monitored mitochondrial dynamics in whole extensor digitorum longus (EDL) muscles. By following a subset of photo-converted mitochondria over time, we observed mitochondrial fusion between intramyofibrillar mitochondria. The fusion events occurred along both the longitudinal and transverse axes of the myofiber (Fig. 4E). Therefore, although mitochondria in skeletal muscle appear static and rigidly organized, they are dynamic and fusion-competent. We previously observed that postnatal development of fast-twitch muscle is accompanied by a dramatic increase in mitochondrial DNA copy number (Chen et al., 2010). This observation suggests that mitochondria may play an important role in the development of skeletal muscle. To explore this idea, we analyzed mitochondrial morphology during the postnatal development of EDL muscle. In fixed whole mounts of EDL, we noted a dramatic remodeling of mitochondrial structure between postnatal day 11 and 30 (Fig. 4F–H). In EDL muscle at postnatal day 11, the mitochondria appear as elongated tubules oriented along the long axis of the muscle fiber (Fig. 4F). By postnatal day 30, the mitochondria are punctate and organized into doublets (Fig. 4H). These morphological observations in the PhAMexcised muscles were confirmed by electron microscopy analysis of wildtype mice (Fig. 4G, I). Taken together, these results suggest that extensive mitochondrial remodeling accompanies skeletal muscle development, and indicates that the PhAM mouse lines can be used to examine mitochondria in developmental processes.
Cell-specific labeling of mitochondria
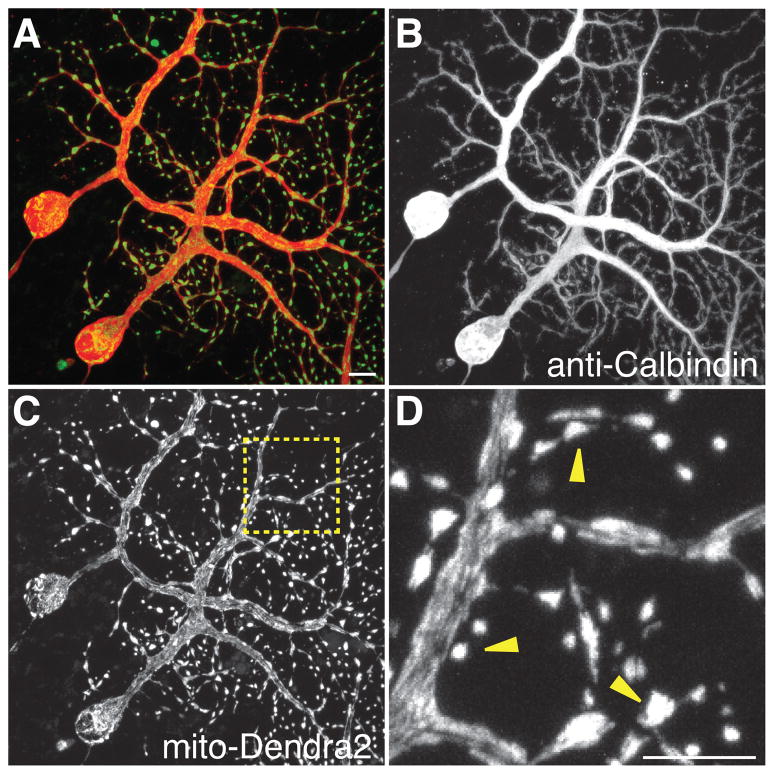
The experiments above indicate that the PhAMexcised line can be used to monitor mitochondria in a wide range of cell types. In some tissues with high cell density and diversity, however, the near ubiquitous expression of mito-Dendra2 results in overlapping mitochondrial signals from multiple cells. In such cases, it would be advantageous to restrict labeling to a particular cell type. To test this idea, we crossed PhAMfloxed mice with the Pcp2-Cre line, which drives Cre expression in Purkinje neurons of the cerebellum. To facilitate high resolution imaging in brain tissue, we used organotypic culturing methods to maintain parasagittal cerebellar slices. Purkinje neurons in the cerebellum were identified by anti-calbindin immunofluorescence. As expected, mito-Dendra2 expression is restricted to Purkinje neurons (Fig. 5A–C). In these neurons, we noted several morphologically distinct populations of mitochondria (Fig. 5D). Tubular mitochondria occupy the soma and primary dendrites, whereas focal clusters of smaller mitochondria appear in the secondary and tertiary dendrites. In these clusters, the mitochondria are densely packed, and individual organelles often cannot be distinguished without photo-conversion. Interestingly, when mito-Dendra2 expression is restricted by the Pcp2-Cre driver, the mitochondria in individual Purkinje cells are better resolved. In the PhAMexcised line, the expression of mito-Dendra2 in granular cells and supporting cells obscures the tracking of mitochondria in Purkinje neurons beyond the soma and primary dendrites (compare Fig. 3C to 5C).
Figure 5. Purkinje-specific labeling of mitochondria.
PhAMfloxed mice were crossed with a Purkinje-specific driver, Pcp2 Cre, and organotypic slice cultures were prepared from the offspring. (A) Merged image of mito-Dendra2 (green) and anti-calbindin (red). Two Purkinje cells express mito-Dendra2. (B) Single-channel image of anti-calbindin highlighting the borders of Purkinje neurons. (C) Single-channel image of mito-Dendra2 signal. (D) High magnification image of the boxed region in (C). Note the tight clusters of mitochondria in the distal dendritic branches (arrowheads). Scale bars: 10 μm.
Detection of mitochondrial defects in mutant mice
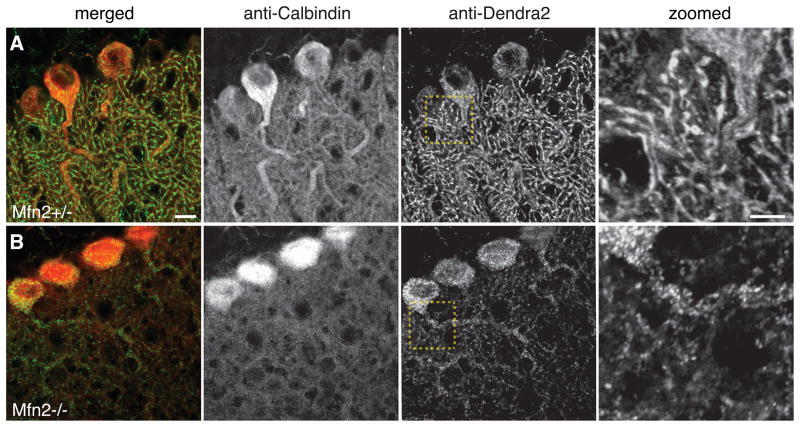
One of our motivations for constructing the PhAM mice was to facilitate the systematic evaluation of mitochondrial dynamics in mutant mouse models. To assess this possibility, we used the PhAMfloxed line to examine mitochondrial morphology in Purkinje neurons with a targeted deletion of Mfn2, which is important for mitochondrial fusion. We have previously shown that the loss of Mfn2 results in mitochondrial abnormalities as well as degeneration of Purkinje neurons (Chen et al., 2007). Consistent with our previous study, cerebellar sections of Mfn2 mutant mice show severe mitochondrial fragmentation and sparseness in the dendritic processes (Fig. 6).
Figure 6. Visualization of mitochondrial defects in Purkinje neurons lacking Mfn2.
Frozen sections of cerebellum with stained for calbindin (red) and Dendra2 (green). The top panel is from a control animal with normal Purkinje neurons. The bottom panel is from a littermate lacking Mfn2 in Purkinje neurons due to the Pcp2 Cre driver. The last column shows high magnification images of the boxed regions. Scale bar: 10 μm in the merged image and 5 μm in the magnified image.
The PhAMexcised and PhAMfloxed mouse models provide new opportunities for assessing mitochondrial dynamics in mouse tissues and cells. Other mouse models with fluorescently labeled mitochondria exist (Abe et al., 2011; Magrane et al., 2012; Misgeld et al., 2007; Sterky et al., 2011), but our models are the first to combine both photo-conversion and conditional expression in a wide spectrum of cell types. In addition, the CAG promoter provides enhanced expression of the reporter without affecting mitochondrial morphology. With strong, ubiquitous expression of mito-Dendra2, the PhAMexcised line should be useful to investigators surveying mitochondrial dynamics in diverse tissues. Mitochondrial defects in mutant mouse models can be readily screened by histological analysis. Moreover, photo-switching of mito-Dendra2 enables high-resolution analysis and direct measurement of mitochondrial fusion in live cells. The PhAMfloxed line can be combined with Cre drivers to restrict mito-Dendra2 expression to specific cells, facilitating the analysis of mitochondria in tissues with high cell diversity. Finally, our analysis in skeletal muscle indicates that these mouse lines can be used to study structural changes in mitochondria that may accompany developmental transitions. Such remodeling events may be particularly important in tissues that undergo developmentally programmed changes in metabolism, activity, or oxygenation.
MATERIALS AND METHODS
Construction of the PhAM mouse lines
The mito-Dendra2 expression cassette was assembled in a modified pBluescript shuttle plasmid (kindly provided by Dr. John Burnett). First, the CAG (cytomegalovirus/β-actin) enhancer-promoter was transferred from Rosa26 mT/mG (Muzumdar et al., 2007) with PmeI-SpeI restriction sites. Second, the floxed termination signal was excised as an EcoRI-SpeI fragment from pBS302 (Sauer, 1993) and subcloned downstream of the CAG promoter. This floxed termination signal is composed of two loxP sites flanking the SV40 polyadenylation signal sequence. Third, the mitochondrial targeting sequence of subunit VIII of cytochrome c oxidase was fused to the N-terminus of Dendra2 (Evrogen) (Chudakov et al., 2007) and cloned into the pcDNA3.1(+) vector (Invitrogen) containing the bovine growth hormone (bGH) polyadenylation signal. Fourth, the mito-Dendra2/bGH segment was cloned into the shuttle vector downstream of the floxed termination signal. Finally, the pCA mT/mG sequence from Rosa26 mT/mG was replaced with the expression construct. All plasmids were verified by DNA sequence analysis.
The targeting construct was linearized with PvuI and electroporated into low passage 129/SvEV ES cells as previously described (Chen et al., 2003). Of 94 neomycin-resistant clones, four were correctly targeted, as determined by PCR and Southern blot analysis. One ES clone was injected into C57BL/6 blastocysts to generate chimeric mice. Founder chimeric mice were bred to C57BL/6 to confirm germline transmission. The mice were then crossed with FLPeR mice (Farley et al., 2000) to remove the neomycin-resistance cassette, thereby generating the PhAMfloxed line. The PhAMfloxed mice were crossed with the Meox2-Cre mice (Tallquist and Soriano, 2000) to generate the PhAMexcised line. Both mouse lines have been deposited at The Jackson Laboratory [PhAMexcised, stock#18397, Gt(ROSA)26Sortm1.1(CAG-COX8A/Dendra2)Dcc/J); PhAMfloxed, stock#18385, Gt(ROSA)26Sortm1(CAG-COX8A/Dendra2)Dcc/J)].
Confirmation of the PhAMfloxed and PhAMexcised alleles
For Southern analysis, genomic DNAs were digested with HindIII and hybridized with the published probe from the pROSA26-5′ plasmid (Soriano, 1999). To genotype the PhAMfloxed allele by PCR, the set of three primers were used: Rosa4 5′–TCAATGGGCGGGGGTCGTT (Zong et al., 2005), R26-F 5 ′–TCCTGGCTTCTGAGGACCGC, and R26-R 5 ′–TTCCCCTGCAGGACAACGCC. The wild-type allele yields a 150 bp band while the mito-Dendra2 insertion results in a 252 bp band. Germline excision of the termination sequence was verified using the following set of primers: CAG 5′–TACAGCTCCTGGGCAACGTGCT, Stop 5′–TGGCAGCAGATCTAACGGCCG, Dendra2 5′ – GTTCACGTTGCCCTCCATGT. The lower 265 bp band is derived from the termination cassette whereas the upper 345 bp band represents Cre-mediated excision of the floxed region.
Antibodies and cell stains
The following dyes were used: wheat germ agglutinin A594 (1:250, Molecular Probes), NeuroTrace fluorescent Nissl stain A640 (1:200, Molecular Probes), DAPI (300 nM, Molecular Probes), and Alexa Fluor 546 streptavidin (1:500, Molecular Probes). Primary antibodies included: mouse anti-Map2 (1:1000, Sigma), mouse anti-calbindin (1:1500, Sigma), goat anti-HSP60 (1:200, Santa Cruz), rabbit anti-Dendra2 (1:500, Evrogen), and mouse anti-α-actinin (1:100, Sigma). Secondary antibodies included biotinylated goat anti-mouse (Vector labs), Alexa Fluor 546 donkey anti-goat, Alexa Fluor 546 donkey anti-mouse, and Alexa Fluor 488 goat-anti-rabbit (1:500, Molecular probes).
Histological analysis
For all histological sections, mice were perfused transcardially with phosphate buffered saline (PBS) followed by 10% formalin (Sigma). Tissues were embedded overnight at 4°C in 30% sucrose solution and frozen in OCT for sectioning by a cryostat. For fluorescence staining, slides were either incubated with primary antibodies overnight or overlaid with WGA or Nissl stain for 1–2 hours at room temperature.
For organotypic slices, membranes surrounding the cerebellum were trimmed and fixed overnight with 4% paraformaldehyde-lysine-periodate fixative at 4°C. Slices were permeabilized with 1% Triton-X for 15 minutes and incubated with blocking buffer (2% goat serum, 1% BSA, and 0.1% Triton-X) for 4–6 hours. Samples were incubated with primary antibodies overnight followed by secondary antibodies for 2 hours.
To stain muscles, EDL samples were fixed for 1 hour at room temperature with 10% formalin. Myofibers were mechanically teased apart and immunostained with the Vector M.O.M. kit (Vector labs) according to the manufacturer’s protocol.
Fibroblast cells
Tail fibroblasts were isolated from the wildtype or PhAMfloxed line by trypsin-EDTA digestion of skin fragments from the tail. After several days in culture with media containing DMEM, 10% fetal bovine serum, 1 mM L-glutamine, and 1X penicillin/streptomycin (Life Technologies/GIBCO), fibroblasts from hair follicles migrated onto the plate. To facilitate immortalization, these fibroblasts were transduced with retrovirus harboring SV40 large T antigen. For assessment of mitochondrial morphology, fibroblasts were plated in 8-well chamber slides. In each well, 200 cells were classified into one of three mitochondrial profiles: 100% tubular, 50% mixture of fragmented and short tubules, or completely fragmented.
Isolated cells & tissues
To isolate primary cardiomyocytes for live imaging of mitochondrial dynamics, the ventricles were rinsed with cold PBS supplemented with 10 mg/ml of glucose and mechanically minced in 0.5% collagenase PBS buffer. The tissue was digested in 20 min intervals at 37°C in a rotary shaker, and myocyte supernatants were collected and pooled between digestion intervals until minimal ventricular tissues remained. Only rod shaped ventricular myocytes were selected for imaging.
For primary myofibers, the EDL muscle was digested with 4 mg/ml collagenase in DMEM media for 1 hrs at 37°C in a rotary shaker. Digested EDL muscles were triturated several times using decreasing bore sizes of flame-heated pasteur pipettes to obtain individual myofibers for live imaging. For whole muscle imaging, the EDL was removed, placed in a coverglass bottom petri dish, and held in place using a slice anchor (Warner instruments). Whole muscles were imaged in media containing DMEM (no phenol red), 10% fetal bovine serum, 1 mM pyruvate, and 25 mM HEPES.
Mouse sperm were isolated from the cauda epididymus of 2–3 months old males. Longitudinal cuts were made along the epididymus to enable motile, mature sperm to swim out into the PBS solution. All live samples were imaged on a stage-top heated platform maintained at 37°C.
Organotypic slice cultures
Pups from postnatal days 10–12 were used for organotypic cultures. Tail samples from each animal were retained for genotyping. The cerebellum was removed and incubated in ice-cold preparation media containing 1X GBSS (Sigma) supplemented with 6.5 mg/ml of glucose. Each hemisphere was glued onto a rotating magnetic stage for sectioning by a Leica VT1200S vibratome. For each animal, approximately 4–6 sections (2–3 per hemisphere) of 330 μm thickness were collected and transferred to a petri dish with cold preparation media using a wide bore pipette. Evenly sliced sections were selected under the dissecting scope and transferred to Millicell membrane inserts (Millipore, PICM3050) in a 6 well plate. Typically, 2–4 sections were plated onto one insert for culturing by the interface method at 35°C with 5% CO2 (Stoppini et al., 1991). The culture medium is a mixture of MEM (Life Technologies, 51200), 2 mM L-glutamine, 1 mM GlutaMAX (Life Technologies, 35050), 0.5 mg/ml penicillin-streptomycin, 50% heat-inactivated horse serum, 25% Hank’s salt solution, 10 mM HEPES, and 6.5mg/ml of glucose. The media was buffered to a pH of 7.2. Slices were fed with new media on alternating days 3 times a week and equilibrated in culture for at least 10 days prior to experimentation.
Microscopy analysis
Images were acquired with a Zeiss LSM 710 confocal microscope with EC-Plan-Neofluar 40X/1.3 oil and Plan-Apochromat 63X/1.4 oil objectives. Z-stack acquisitions over-sampled each optical slice twice, and the Zen 2009 image analysis software was used for maximum z-projections. The 488 nm laser line and the 561 nm laser excited Dendra2 in the unconverted state and photo-converted state, respectively. To photo-switch Dendra2, a region was illuminated with the 405 nm line (4% laser power) for 90 bleaching iterations at a scan speed of 6.3–12.61 μs/pixel. Alexa 594 and Alexa 640 conjugated dyes were excited by the 561 nm laser and the 633 nm laser, respectively. For live imaging of primary cardiomyocytes, sperm, and myofibers, the C-Apochromat 63X/1.2W objective was used.
For EM, the EDL muscle was immobilized in an outstretched position by tying onto a toothpick splint prior to excision. Muscles were fixed in 3% paraformaldehyde, 1.5% glutaraldehyde, 100 mM cacodylate (pH 7.4), and 2.5% sucrose for 1 hour and stored in PBS. Samples were processed and imaged as described previously (Chen et al., 2007).
Supplementary Material
Images of mito-Dendra2 in PhAMexcised tissue sections. Images A–H show mito-Dendra2 signal at low magnification. A′-H′ depict the respective tissues with merged signal from mito-Dendra2 (green) and cell counterstains (red and blue.) A″-H″ show high magnification images of the boxed region. (A) cortex; (B) hippocampus; (C) cerebellum; (D) myocardium; (E) testis; (F) lung; (G) liver; (H) kidney. For A–C, counterstains included anti-Map2 (red) to label neuronal dendrites and a fluorescent Nissl stain (blue) to mark neurons; in D–H, wheat germ agglutinin (red) delineates cell borders. Scale bar is 100 μm in the low magnification images and 10 μm in the high magnification images. DG, dentate gyrus; GL, granule layer; ML, molecular layer; PC, Purkinje cell; ST, seminiferous tubules; A, alveolus; G, glomerulus.
An isolated cardiomyocyte (A) and skeletal muscle fiber (B) were imaged by differential contrast microscopy (DIC, left panels) or fluorescence microscopy (right panels). Some mitochondria have been photo-switched (red) to enhance the resolution of mitochondria in dense networks. Scale bar is 10 μm.
Acknowledgments
We thank Shirley Pease for blastocyst injections. We are grateful to Hsiuchen Chen for advice on animal work. We appreciate the Chan lab members for input on this manuscript. This work was supported by NIH grant GM062967.
LITERATURE CITED
- Abe T, et al. Establishment of conditional reporter mouse lines at ROSA26 locus for live cell imaging. Genesis. 2011;49:579–590. doi: 10.1002/dvg.20753. [DOI] [PubMed] [Google Scholar]
- Alexander C, et al. OPA1, encoding a dynamin-related GTPase, is mutated in autosomal dominant optic atrophy linked to chromosome 3q28. Nat Genet. 2000;26:211–215. doi: 10.1038/79944. [DOI] [PubMed] [Google Scholar]
- Cardullo RA, Baltz JM. Metabolic regulation in mammalian sperm: mitochondrial volume determines sperm length and flagellar beat frequency. Cell Motil Cytoskeleton. 1991;19:180–188. doi: 10.1002/cm.970190306. [DOI] [PubMed] [Google Scholar]
- Chen CM, et al. A comparison of exogenous promoter activity at the ROSA26 locus using a PhiiC31 integrase mediated cassette exchange approach in mouse ES cells. PLoS One. 2011;6:e23376. doi: 10.1371/journal.pone.0023376. [DOI] [PMC free article] [PubMed] [Google Scholar]
- Chen H, Chan DC. Mitochondrial dynamics--fusion, fission, movement, and mitophagy-- in neurodegenerative diseases. Hum Mol Genet. 2009;18:R169–176. doi: 10.1093/hmg/ddp326. [DOI] [PMC free article] [PubMed] [Google Scholar]
- Chen H, et al. Mitofusins Mfn1 and Mfn2 coordinately regulate mitochondrial fusion and are essential for embryonic development. J Cell Biol. 2003;160:189–200. doi: 10.1083/jcb.200211046. [DOI] [PMC free article] [PubMed] [Google Scholar]
- Chen H, et al. Mitochondrial fusion protects against neurodegeneration in the cerebellum. Cell. 2007;130:548–562. doi: 10.1016/j.cell.2007.06.026. [DOI] [PubMed] [Google Scholar]
- Chen H, et al. Mitochondrial fusion is required for mtDNA stability in skeletal muscle and tolerance of mtDNA mutations. Cell. 2010;141:280–289. doi: 10.1016/j.cell.2010.02.026. [DOI] [PMC free article] [PubMed] [Google Scholar]
- Chudakov DM, et al. Tracking intracellular protein movements using photoswitchable fluorescent proteins PS-CFP2 and Dendra2. Nat Protoc. 2007;2:2024–2032. doi: 10.1038/nprot.2007.291. [DOI] [PubMed] [Google Scholar]
- Delettre C, et al. Nuclear gene OPA1, encoding a mitochondrial dynamin-related protein, is mutated in dominant optic atrophy. Nat Genet. 2000;26:207–210. doi: 10.1038/79936. [DOI] [PubMed] [Google Scholar]
- Detmer SA, Chan DC. Functions and dysfunctions of mitochondrial dynamics. Nat Rev Mol Cell Biol. 2007;8:870–879. doi: 10.1038/nrm2275. [DOI] [PubMed] [Google Scholar]
- Farley FW, et al. Widespread recombinase expression using FLPeR (flipper) mice. Genesis. 2000;28:106–110. [PubMed] [Google Scholar]
- Ishihara N, et al. Mitochondrial fission factor Drp1 is essential for embryonic development and synapse formation in mice. Nat Cell Biol. 2009;11:958–966. doi: 10.1038/ncb1907. [DOI] [PubMed] [Google Scholar]
- Karbowski M, et al. Quantitation of mitochondrial dynamics by photolabeling of individual organelles shows that mitochondrial fusion is blocked during the Bax activation phase of apoptosis. J Cell Biol. 2004;164:493–499. doi: 10.1083/jcb.200309082. [DOI] [PMC free article] [PubMed] [Google Scholar]
- Magrane J, et al. Mitochondrial dynamics and bioenergetic dysfunction is associated with synaptic alterations in mutant SOD1 motor neurons. J Neurosci. 2012;32:229–242. doi: 10.1523/JNEUROSCI.1233-11.2012. [DOI] [PMC free article] [PubMed] [Google Scholar]
- Misgeld T, et al. Imaging axonal transport of mitochondria in vivo. Nat Methods. 2007;4:559–561. doi: 10.1038/nmeth1055. [DOI] [PubMed] [Google Scholar]
- Muzumdar MD, et al. A global double-fluorescent Cre reporter mouse. Genesis. 2007;45:593–605. doi: 10.1002/dvg.20335. [DOI] [PubMed] [Google Scholar]
- Ogata T, Yamasaki Y. Ultra-high-resolution scanning electron microscopy of mitochondria and sarcoplasmic reticulum arrangement in human red, white, and intermediate muscle fibers. Anat Rec. 1997;248:214–223. doi: 10.1002/(SICI)1097-0185(199706)248:2<214::AID-AR8>3.0.CO;2-S. [DOI] [PubMed] [Google Scholar]
- Sauer B. Manipulation of transgenes by site-specific recombination: use of Cre recombinase. Methods Enzymol. 1993;225:890–900. doi: 10.1016/0076-6879(93)25056-8. [DOI] [PubMed] [Google Scholar]
- Soriano P. Generalized lacZ expression with the ROSA26 Cre reporter strain. Nat Genet. 1999;21:70–71. doi: 10.1038/5007. [DOI] [PubMed] [Google Scholar]
- Sterky FH, et al. Impaired mitochondrial transport and Parkin-independent degeneration of respiratory chain-deficient dopamine neurons in vivo. Proc Natl Acad Sci U S A. 2011;108:12937–12942. doi: 10.1073/pnas.1103295108. [DOI] [PMC free article] [PubMed] [Google Scholar]
- Stoppini L, et al. A simple method for organotypic cultures of nervous tissue. J Neurosci Methods. 1991;37:173–182. doi: 10.1016/0165-0270(91)90128-m. [DOI] [PubMed] [Google Scholar]
- Tallquist MD, Soriano P. Epiblast-restricted Cre expression in MORE mice: a tool to distinguish embryonic vs. extra-embryonic gene function. Genesis. 2000;26:113–115. doi: 10.1002/(sici)1526-968x(200002)26:2<113::aid-gene3>3.0.co;2-2. [DOI] [PubMed] [Google Scholar]
- Wakabayashi J, et al. The dynamin-related GTPase Drp1 is required for embryonic and brain development in mice. J Cell Biol. 2009;186:805–816. doi: 10.1083/jcb.200903065. [DOI] [PMC free article] [PubMed] [Google Scholar]
- Waterham HR, et al. A lethal defect of mitochondrial and peroxisomal fission. N Engl J Med. 2007;356:1736–1741. doi: 10.1056/NEJMoa064436. [DOI] [PubMed] [Google Scholar]
- Zong H, et al. Mosaic Analysis with Double Markers in Mice. Cell. 2005;121:479–492. doi: 10.1016/j.cell.2005.02.012. [DOI] [PubMed] [Google Scholar]
- Zuchner S, et al. Mutations in the mitochondrial GTPase mitofusin 2 cause Charcot-Marie-Tooth neuropathy type 2A. Nat Genet. 2004;36:449–451. doi: 10.1038/ng1341. [DOI] [PubMed] [Google Scholar]
Associated Data
This section collects any data citations, data availability statements, or supplementary materials included in this article.
Supplementary Materials
Images of mito-Dendra2 in PhAMexcised tissue sections. Images A–H show mito-Dendra2 signal at low magnification. A′-H′ depict the respective tissues with merged signal from mito-Dendra2 (green) and cell counterstains (red and blue.) A″-H″ show high magnification images of the boxed region. (A) cortex; (B) hippocampus; (C) cerebellum; (D) myocardium; (E) testis; (F) lung; (G) liver; (H) kidney. For A–C, counterstains included anti-Map2 (red) to label neuronal dendrites and a fluorescent Nissl stain (blue) to mark neurons; in D–H, wheat germ agglutinin (red) delineates cell borders. Scale bar is 100 μm in the low magnification images and 10 μm in the high magnification images. DG, dentate gyrus; GL, granule layer; ML, molecular layer; PC, Purkinje cell; ST, seminiferous tubules; A, alveolus; G, glomerulus.
An isolated cardiomyocyte (A) and skeletal muscle fiber (B) were imaged by differential contrast microscopy (DIC, left panels) or fluorescence microscopy (right panels). Some mitochondria have been photo-switched (red) to enhance the resolution of mitochondria in dense networks. Scale bar is 10 μm.


