Summary
Frequent blood donors become iron deficient. HFE mutations are present in over 30% of donors. A 24-month study of 888 first time/reactivated donors and 1537 frequent donors measured haemoglobin and iron status to assess how HFE mutations impact the development of iron deficiency erythropoiesis. Donors with two HFE mutations had increased baseline haemoglobin and iron stores as did those with one mutation, albeit to a lesser extent. Over multiple donations haemoglobin and iron status of donors with HFE mutations paralleled those lacking mutations. The prevalence of HFE mutations was not increased in higher intensity donors. Thus, in general, HFE mutations do not temper donation-induced changes in haemoglobin and iron status. However, in Black donors there was an increase of H63D carriers at baseline, from 3.7% in first time/reactivated donors to 15.8% in frequent donors, suggesting that the relative effects of HFE mutations on iron absorption may vary between racial/ethnic groups. In secondary analyses, venous haemoglobin decreased more slowly in donors with ferritin ≥ 12 μg/l; and haemoglobin recovery time was shorter in donors with reticulocyte haemoglobin (CHr) ≥ 32.6 pg, indicating that these biochemical measures are better indicators of a donor’s response to phlebotomy than their HFE mutation status.
Keywords: HFE, blood donor, iron deficiency, haemoglobin, ferritin
Introduction
In the United States the minimal allowable interval between whole blood donations is 56 days and applies to all allogeneic donors without regard to sex, age, race/ethnicity or other demographic factors, as long as their haemoglobin is ≥ 125 g/l or their haematocrit is ≥ 38%. Each blood donation results in the loss of 200 and 250 mg of iron and high frequency donors are prone to depletion of iron stores and iron deficiency anaemia (Cable et al, 2011). One means for preventing iron deficiency in donors is to develop individualized donation intervals for different demographic groups. For example, the minimum inter-donation interval is longer for women than men in some countries (Karp & King, 2010).
A study of high intensity blood donors who donate blood six times per year without deferral for low haemoglobin revealed that this is a self-selected population that is resistant to development of blood donation-induced anaemia (Mast et al, 2008a). This finding was confirmed and quantified in a large multicentre study of haemoglobin deferral of blood donors that demonstrated the odds for deferral of female donors with six successful whole blood donations in the previous 12 months were less than one-half that of females with only one donation (Mast et al, 2010). While there are several potential explanations for the self-selection of these individuals, including the use of oral iron supplements, it is possible that many of them have genetic polymorphisms that allow for increased absorption of dietary iron, particularly when iron stores are depleted. One candidate is HFE, a gene that when mutated can produce hereditary haemochromatosis (Feder et al, 1996). Patients homozygous for mutations in HFE do not produce adequate amounts of hepcidin, the hormone that dampens dietary iron absorption in response to elevated iron stores (Nicolas et al, 2001;Nemeth & Ganz, 2006). Therefore, they absorb dietary iron regardless of available iron stores and may develop life-threatening iron deposits in the heart and liver.
The two most common mutations in HFE are C282Y and H63D. Carriers for these mutations are very prevalent (10% and 24%, respectively) in Whites (Adams et al, 2005). These individuals have slightly altered biochemical measures of iron metabolism in peripheral blood tests, such as ferritin, an indicator of total body iron stores, but the values remain within normal reference intervals, and they do not develop iron overload (Beutler et al, 2003;Jackson et al, 2001). Although the C282Y mutation has a greater impact on iron balance than H63D, high intensity donors that carry the H63D mutation have decreased hepcidin to ferritin ratios when compared to those without the mutation (Mast et al, 2008a). A separate study found that the prevalence of H63D was higher among female than male donors (Konig et al, 2003). These data suggest that carriers of H63D may absorb more dietary iron when iron stores are depleted than those without the mutation, potentially protecting them from blood donation-induced iron deficiency anaemia. Despite these findings, several studies have determined that the prevalence of carriers for HFE mutations in high intensity blood donors is similar to the general population, rather than increased, as would be expected, if these mutations allowed individuals to repeatedly donate blood without development of anaemia (Mast et al, 2008a;Konig et al, 2003;Boulton et al, 2000).
The REDS-II donor Iron Status Evaluation (RISE) study was a 24 month, multicentre, longitudinal study of iron metabolism and anaemia in 2425 blood donors performed to assess demographic, behavioural, genetic and donation intensity determinants that influence the development of iron deficiency and iron deficiency anaemia in blood donors. The results from this study suggest beneficial changes for how donors can be managed to prevent iron deficiency, such as altering the inter-donation interval and/or recommending use of iron supplements. As carriers of HFE mutations are prevalent within the blood donor population and there is potential for these mutations to alter dietary iron absorption, we undertook a detailed study to determine how HFE mutations impact measures of iron metabolism and haemoglobin in RISE subjects as they underwent the stress of repeated iron loss from blood donation.
Methods
Participating Blood Centres
The data presented here were collected as part of the National Heart, Lung and Blood Institute (NHLBI) Retrovirus Epidemiology Donor Study-II (REDS-II). There are six centres that participate in REDS-II: Blood Center of Wisconsin (Milwaukee, WI); the American Red Cross New England Region (Dedham, MA); Hoxworth Blood Center/University of Cincinnati Academic Health Center (Cincinnati, OH); American Red Cross Southern Region (Douglasville, GA); Blood Centers of the Pacific (San Francisco, CA); and the Institute for Transfusion Medicine (Pittsburgh, PA). The REDS-II centres represent geographically and demographically diverse populations and collectively account for over 8% of annual blood collections in the United States. To keep the identity of each blood centre anonymous within the analysis, centres are referred to with alphabetical notation (A-F) in the results. The REDS-II coordinating centre is Westat (Rockville, MD) and Blood Systems Research Institute (San Francisco, CA) serves as the REDS-II Central Laboratory.
Study Participants
Participants were recruited at all six REDS-II centres as part of the longitudinal, multicentre study called RISE conducted between December 2007 and December 2009. A detailed description of the RISE study has previously been published (Cable et al, 2011). There were four cohorts recruited in RISE: female and male first time/reactivated (first time donor or donor with no donations in the previous two years) cohorts and female and male frequent blood donor (men with at least three, and women with at least two donations in the previous year) cohorts. Participants were followed for 15 to 24 months in the longitudinal phase of the study. At enrollment, all subjects completed a survey that assessed smoking history, menstrual/reproductive history (females only), diet and use of vitamins/iron supplements. Race or ethnic group was determined by self-reported answer in the survey. All subjects were encouraged to donate frequently (males at least three and women at least two times per year) during the study period and blood samples were collected at each visit for laboratory testing. In addition, subjects were requested to return to complete a final questionnaire and provide a blood sample at the end of the study period.
Laboratory Testing
Blood samples obtained at enrollment were tested for HFE mutation status. Determination of C282Y and the H63D mutations in the HFE gene, as well as the G277S polymorphism in transferrin (TF) (Lee et al, 2001), was performed using DNA isolated from frozen whole blood samples and SyBr green based real-time polymerase chain reaction (PCR) using techniques similar to those previously published (Gill et al, 2008). For each single nucleotide polymorphism (SNP) two pairs of primers differing by only a single nucleotide were designed; one specific to the wild type sequence and another specific to the mutation sequence. The two primer pairs were then used simultaneously in separate PCR amplifications of donor DNA. After amplification, the polymorphisms were determined by assessment of the difference in amplification efficiency between the two primer pairs. If both primer pairs were equally efficient in amplification of wild type and mutation sequences (Cycle threshold difference (ΔCt) < 2 cycles), the donor was classified as heterozygous; if one primer pair had high efficiency and the other low efficiency (ΔCt > 5 cycles), the sample was determined to be homozygous for the primer sequence with high amplification efficiency. After the PCR amplification conditions were optimized, the assays were validated by analysing a coded panel of 44 blood donors and 6 haemochromatosis patient samples. Four of the haemochromatosis patients tested as homozygous for C282Y and one as homozygous for H63D. To further validate the performance of these assays, we sequenced samples obtained from Dr. Ernest Beutler (San Diego, CA). These included 13 without HFE mutations, 2 heterozygous for C282Y, 4 homozygous for C282Y, 7 heterozygous for H63D and 1 homozygous for H63D. The sequence results were 100% identical with data obtained from the real time PCR assay. PCR testing of the 2425 RISE subjects was successful for all except for 3 samples tested for the C282Y genotype and 6 samples tested for the H63D genotype, for which sequencing was performed to obtain the genotype.
Plasma ferritin, plasma soluble transferrin receptor (sTfR) and complete blood count (CBC) with reticulocyte indices were measured on enrollment samples and on additional samples obtained during blood donations throughout the study. Ferritin, a measure of total body iron stores, was determined by immunoassay (ADVIA Centaur, Siemens Healthcare Diagnostics, Deerfield, IL). sTfR, a measure of cellular iron depletion, was determined turbidimetrically (Tina-quant sTfR assay, Roche Diagnostics, Indianapolis, IN). CBC with reticulocyte indices were measured using Advia 2120 or Advia 120 Hematology Autoanalyzers (Siemens) at four of the six centres (Milwaukee, Cincinnati, New England and Pittsburgh). Reticulocyte analysis included determination of the reticulocyte haemoglobin content (CHr), a measure of iron available for haemoglobin synthesis over the previous four days that detects iron-restricted erythropoiesis (Mast et al, 2008b). Fingerstick haemoglobin or haematocrit measurements were obtained to qualify subjects for blood donation using methods that varied at different centres as previously described (Mast et al, 2010).
Statistical Analyses
Descriptive analyses include box and whisker plots; displaying the mean (solid bar), the 25th and 75th percentiles (box), and the 2.5th and 97.5th percentiles (whiskers).
The HFE genotype distribution of first time/reactivated blood donors enrolled in the RISE study were compared to that of subjects enrolled in the Haemochromatosis and Iron Overload Screening (HEIRS) study (Adams et al, 2005) using chi-square statistics. The HEIRS study screened 99,711 primary care patients for HFE genotype from five field centres in the United States and Canada and was chosen for comparison to RISE subjects because of the large number of multiethnic subjects enrolled at geographically diverse sites across North America. The comparison was adjusted for race/ethnicity because the HEIRS study oversampled minorities. The first time/reactivated RISE donors were compared to frequent RISE donors using Fisher’s exact tests.
Those with two HFE mutations (double heterozygous H63D and C282Y, and homozygous mutations) were combined into one group to increase power for some statistical analyses. The haemoglobin and iron measures of interest were CHr, venous haemoglobin, sTfR, ferritin and log (sTfR/ferritin). Baseline analysis (using enrollment visit data only) of each measure (on the log10 scale for sTfR, ferritin, and sTfR/ferritin ratio and untransformed for CHr and haemoglobin) was done using analysis of variance (ANOVA). However, ANOVA models only indirectly measured longitudinal donation effects by comparing first time/reactivated donors with frequent donors.
To directly measure longitudinal donation effects (due to both donation intensity and recovery time), multivariate repeated measures regression models were developed for each haemoglobin/iron measure. The covariates in these repeated measures models were selected from the statistically significant predictors in the baseline analysis of RISE (Cable et al, 2011). The models included longitudinal effects for donation variables that changed at each donation (i.e. dynamic variables); recovery time measured as “time since last donation (in weeks)”, and donation intensity measured as “number of donations in the past 24 months.” Additional covariates were applied as used previously and include race/ethnicity, gender, age, weight, smoking, iron supplementation, menstrual status, pregnancy history, HFE genotype, TF G277S transferrin genotype (Lee et al, 2001), and centre.
All analyses were done using SAS (SAS 9.2 (2008) SAS Institute Inc, Cary NC).
Results
Study Population
There were 887 first time/reactivated donors (481 females and 407 males) and 1538 frequent blood donors (769 females and 768 males) for a total of 2425 subjects enrolled. The demographic characteristics of enrolled subjects, including the overall prevalence of the HFE mutations, are presented in Table I. According to self-reported race and ethnicity, 76 Asians (3.1%), 116 Blacks (4.8%), 76 Hispanics (3.1%), 2,111 Whites (87.1%) and 29 (1.2%) who reported their race as ‘Other’ were enrolled in the study. Race/ethnicity data was missing for 17 (0.7%) participants. The ethnic/racial distribution of study participants reflects that of blood donors at the six REDS-II blood centres (Mast et al, 2010). In the longitudinal phase of the study, 2,155 (88.9%) subjects returned to donate blood at least one additional time and 1,340 (55.3%) returned for a final visit at the end of the study.
Table I.
Demographic and other characteristics of Baseline Retrovirus Epidemiology Donor Study-II (REDS-II) donor Iron Status Evaluation (RISE) donors (n=2,425)
| N (%) | |
|---|---|
| Race/Ethnicity | |
| Asian | 76 (3.1) |
| Black | 116 (4.8) |
| Hispanic | 76 (3.1) |
| White | 2,111 (87.1) |
| Other | 29 (1.2) |
| Missing | 17 (0.7) |
| Gender | |
| Female | 1,250 (51.6) |
| Male | 1,175 (48.4) |
| Age (years) | |
| 16 – 29 | 476 (19.6) |
| 30 – 39 | 340 (14.0) |
| 40 – 49 | 497 (20.5) |
| 50 – 59 | 626 (25.8) |
| 60+ | 486 (20.0) |
| HFE genotype | |
| Wild Type | 1,568 (64.7%) |
| Heterozygous H63D | 573 (23.6% |
| Heterozygous C282Y | 194 (8.0%) |
| Homozygous H63D | 39 (1.6%) |
| Homozygous C282Y | 7 (0.3%) |
| Double Mutation | 41 (1.7%) |
| Missing | 3 (0.1%) |
| Donor Status | |
| First-Time/Reactivated | 888 (36.6) |
| Frequent/Repeat | 1,537 (63.4) |
| Weight (kg) | |
| < 68 | 595 (24.5) |
| 68 – 78 | 623 (25.7) |
| 79 – 90 | 531 (21.9) |
| ≥ 91 | 659 (27.2) |
| Missing | 17 (0.7) |
| Smoking | |
| Current smoker | 313 (12.9) |
| Past/Non/Unknown | 2,112 (87.1) |
| Iron Supplementation | |
| Iron Supplement | 954 (39.3) |
| No iron Supplement | 1,471 (60.7) |
| Menstrual Cycle (females) | |
| Periods have stopped | 585 (46.8) |
| Still having periods | 665 (53.2) |
| Pregnancy Status (females) | |
| Ever Pregnant | 831 (66.5) |
| Unknown pregnancy status | 13 (1.0) |
| Never pregnant | 406 (32.5) |
| TF G277S Genotype | |
| Wild Type | 2,107 (86.9) |
| Hetero- or Homozygous | 254 (10.5) |
| Missing | 64 (2.6) |
| Red Cell donations in previous 2 years | |
| First-Time/Reactivated Donors | 888 (36.6) |
| ≤ 3 donations | 317 (13.1) |
| 4–9 donations | 1,011 (41.7) |
| 10+ donations | 209 (8.6) |
| Blood Centre | |
| A | 436 (18.0) |
| B | 390 (16.1) |
| C | 376 (15.5) |
| D | 392 (16.2) |
| E | 415 (17.1) |
| F | 416 (17.2) |
HFE genotype of participants
The prevalence of the different combinations of HFE mutations for first time/reactivated and frequent donors separated by race/ethnicity is presented in Table II. There were 39 donors homozygous for H63D, 7 donors homozygous for C282Y and 41 double heterozygous donors enrolled in the study. The previously reported prevalence of these mutations in the HEIRS study (Adams et al, 2005) is included in Table II for comparison with the RISE dataset. Comparison of the frequency of the HFE mutations in the individual race/ethnicity groups of the first time/reactivated RISE and HEIRS datasets revealed an overall difference in HFE frequencies (p=0.0006); 76.0% of HEIRS study subjects showed no HFE mutations, whereas only 66.7% of first time/reactivated RISE donors showed no HFE mutations. Contrasts to identify specific racial/ethnic group differences found differences between Hispanic first time/reactivated RISE donors and HEIRS subjects (p=0.02); with 67.5% and 79.9%, respectively, showing no HFE mutations. Comparison of the frequency of the HFE mutations in the individual race/ethnicity groups of the first time/reactivated RISE donors and frequent RISE donors revealed no overall difference in HFE frequencies (p=0.09). However, contrasts to identify specific racial/ethnic group differences found differences between Black donors (p=0.01); the prevalence of H63D carriers increased from 2 of 53 (3.8%) in first time/reactivated Black donors to 10 of 63 (15.8%) in frequent Black donors.
Table II.
Comparison of RISE and HEIRS HFE genotypes in first time and repeat donors, stratified by race
| Wild Type or Missing n (%) | Heterozygous H63D n (%) | Heterozygous C282Y n (%) | Homozygous H63D n (%) | Homozygous C282Y n (%) | Double Mutation n (%) | Total | |
|---|---|---|---|---|---|---|---|
| All Donors | |||||||
| RISE Study* | 1,571 (64.8) | 573 (23.6) | 194 (8.0) | 39 (1.6) | 7 (0.3) | 41 (1.7) | 2,425 |
| FT/Reactivated | 592 (66.7) | 210 (23.7) | 60 (6.8) | 10 (1.1) | 3 (0.3) | 13 (1.5) | 888 |
| Frequent/Repeat | 979 (63.7) | 363 (23.6) | 134 (8.7) | 29 (1.9) | 4 (0.3) | 28 (1.8) | 1,537 |
| HEIRS Study | 73,066 (76.0) | 15,326 (15.9) | 5,207 (5.4) | 1,242 (1.3) | 292 (0.3) | 991 (1.0) | 96,124 |
| Asian Donors | |||||||
| RISE: FT/Reactivated | 42 (93.3) | 2 (4.5) | 1 (2.2) | 0 | 0 | 0 | 45 |
| RISE: Frequent/Repeat | 31 (100.0) | 0 | 0 | 0 | 0 | 0 | 31 |
| HEIRS Study | 11,657 (91.3) | 1,070 (8.4) | 16 (0.1) | 29 (0.2) | 0 | 0 | 12,772 |
| Black Donors | |||||||
| RISE: FT/Reactivated | 49 (92.4) | 2 (3.8) | 2 | 0 | 0 | 0 | 53 |
| RISE: Frequent/Repeat | 53 (84.1) | 10 (15.9) | 0 | 0 | 0 | 0 | 63 |
| HEIRS Study | 24,930 (91.9) | 1,520 (5.6) | 608 (2.2) | 30 (0.1) | 4 (0.0) | 35 (0.1) | 27,127 |
| Hispanic Donors | |||||||
| RISE: FT/Reactivated | 27 (67.5) | 12 (30.0) | 0 | 0 | 0 | 1 (2.5) | 40 |
| RISE: Frequent/Repeat | 22 (61.1) | 11 (30.5) | 2 (5.6) | 0 | 0 | 1 (2.8) | 36 |
| HEIRS Study | 9,700 (79.9) | 2,199 (18.1) | 35 (0.3) | 154 (1.3) | 7 (0.1) | 48 (0.4) | 12,143 |
| White Donors | |||||||
| RISE: FT/Reactivated | 451 (62.6) | 188 (26.1) | 57 (7.9) | 10 (1.4) | 3 (0.4) | 11 (1.5) | 720 |
| RISE: Frequent/Repeat | 859 (61.8) | 340 (24.4) | 132 (9.5) | 29 (2.1) | 4 (0.3) | 27 (1.9) | 1,391 |
| HEIRS Study | 26,779 (60.8) | 10,537 (23.9) | 4,548 (10.3) | 1,029 (2.3) | 281 (0.6) | 908 (2.1) | 44,082 |
29 RISE donors report their Racial/Ethnic group as “Other” and 17 are missing Race/Ethnicity (and not presented in this table); 3 are missing HFE genotype (and are pooled with WT).
RISE, Retrovirus Epidemiology Donor Study-II (REDS-II) donor Iron Status Evaluation; HEIRS, Haemochromatosis and Iron Overload Screening; FT, first time donor
Impact of HFE mutation status on baseline iron status in first-time/reactivated and frequent donors
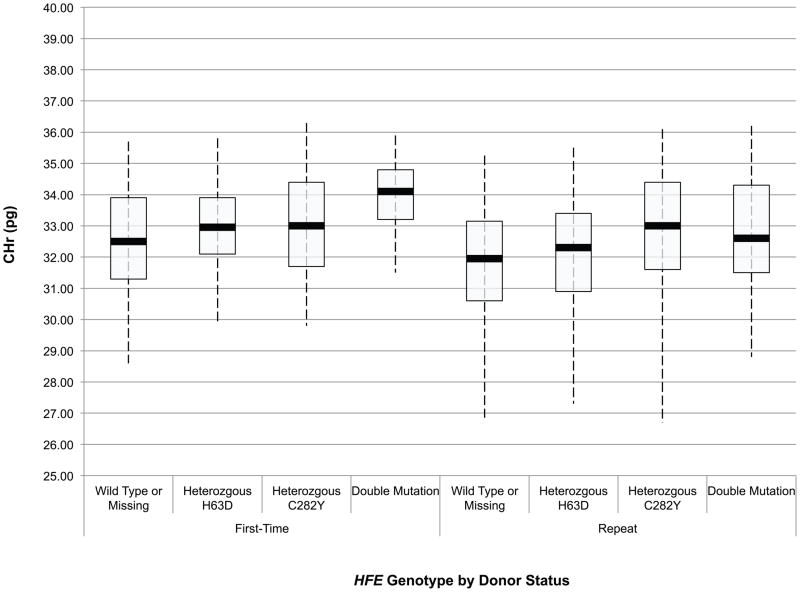
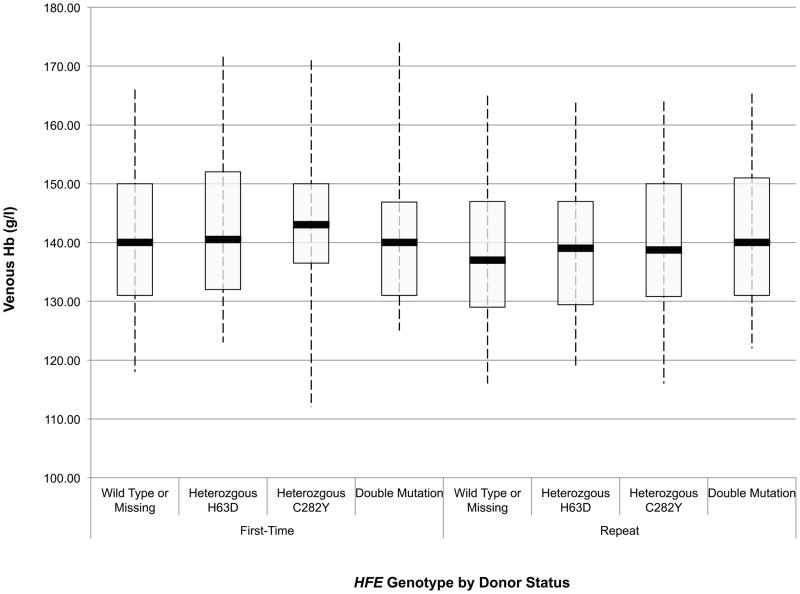
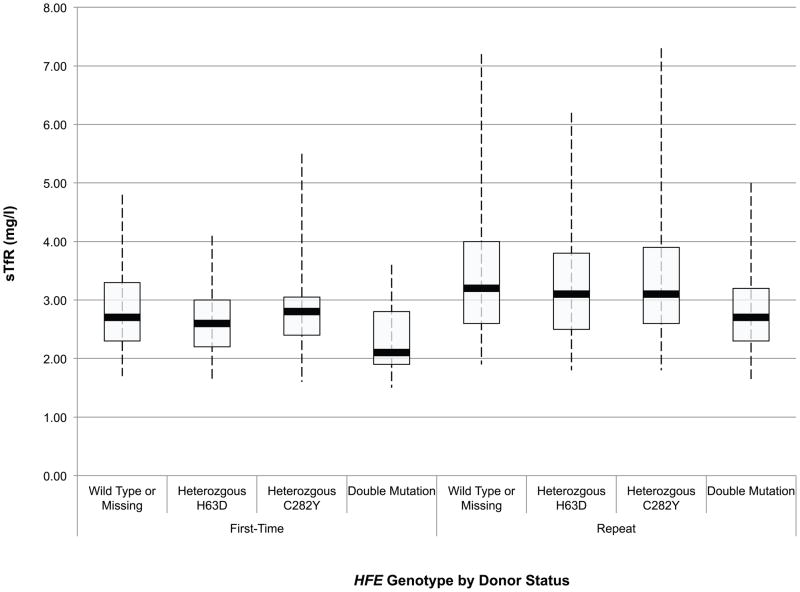
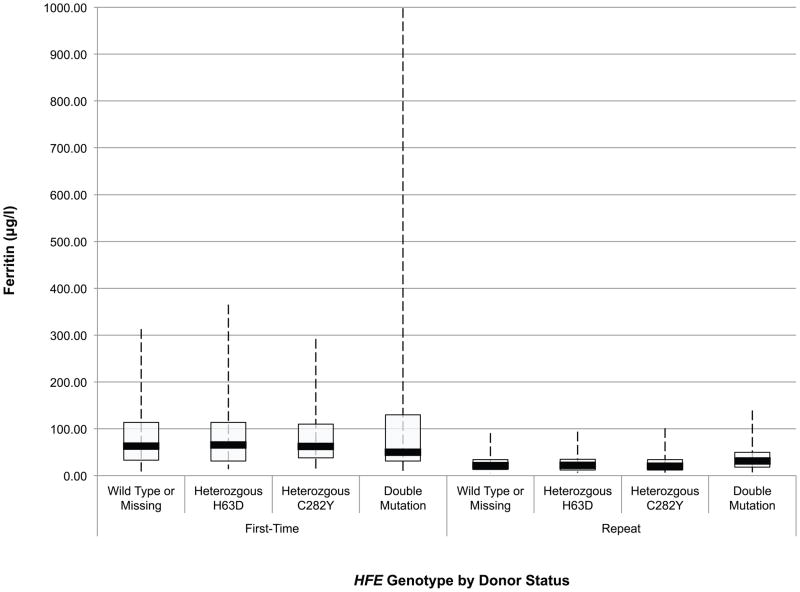
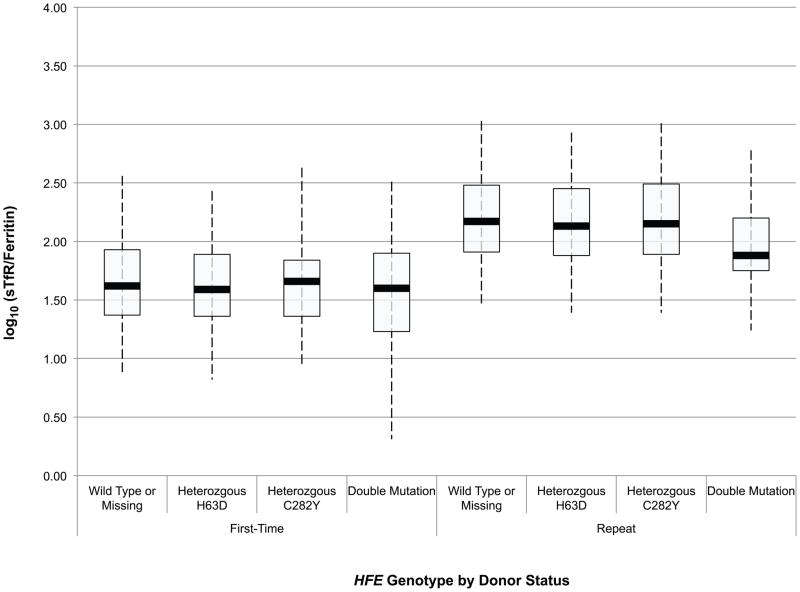
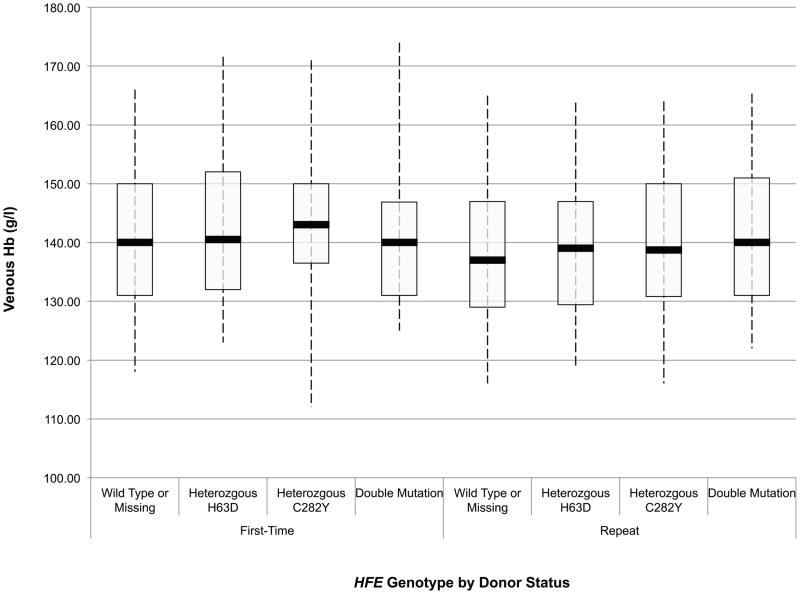
An initial assessment of the effect of HFE mutations on the haemoglobin and iron status of blood donors was obtained through ANOVA of baseline CHr, sTfR, ferritin, sTfR/ferritin and haemoglobin values in first time/reactivated and frequent donors according to their HFE genotype. These data are presented in box and whisker plots in Fig 1A-E. Comparison of these values between first time/reactivated and frequent donors that do not carry an HFE mutation showed that all are altered, demonstrating that repeated blood donation produces decreased iron stores, as evidenced by decreased ferritin (Fig 1D), increased sTfR (Fig 1C) and most notably increased log(sTfR/ferritn) (Fig 1E), and decreased haemoglobin, as evidenced by decreased CHr (Fig 1A) and decreased venous haemoglobin (Fig 1B). In general, similar changes were present for all measures of haemoglobin and iron status when comparing first time/reactivated and frequent donors with HFE mutations, suggesting that the HFE mutations do not provide a protective effect from blood donation-induced anaemia and iron deficiency. A second ANOVA adjusting for race/ethnicity, gender, menstrual status, age, weight, and centre showed similar HFE genotype by donor status differences (data not shown). As these baseline analyses were performed comparing first time/reactivated donors with frequent donors (as a surrogate for a longitudinal effect of repeated donations), additional analyses of longitudinal data were performed to examine changes of haemoglobin and iron status within individual donors as they experienced the stress of repeated blood donation.
Fig 1.
Box and whisker graphs comparing haemoglobin and iron parameters in first time/reactivated and frequent donors grouped by HFE genotype at baseline. The boxes stretch from the 25th to the 75th percentile. Median values are indicated by the horizontal line across the box. The whiskers stretch to the 5th and 95th percentile. A) CHr; B) venous haemoglobin; C) sTfR; D) ferritin; E) log(sTfR/ferritin).
Impact of HFE mutation status on iron status in longitudinal analysis
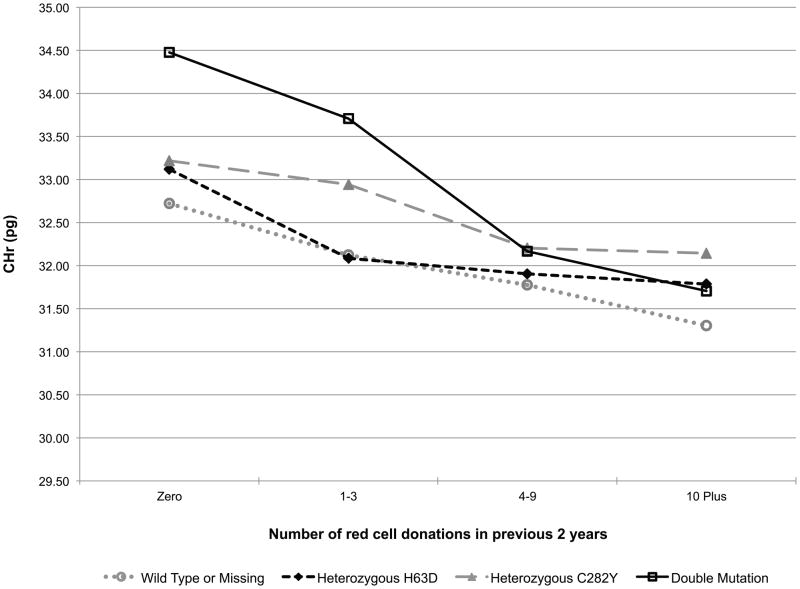
Repeated measures regression models were developed to determine the impact of HFE mutations on five primary outcome measures: 1) CHr; 2) venous haemoglobin; 3) log10 sTfR; 4) log10 ferritin; and 5) log10 (sTfR/ferritin) (Table III). In each of the regression models the HFE mutations have a significant impact on the five measures of haemoglobin and iron balance pre-donation (p-values <0.0001 for all except ferritin with p-value of 0.003). For example, after adjusting for other factors, CHr was higher by 0.40, 0.50 and 1.76 pg in carriers of H63D, carriers of C282Y and those with two mutations, respectively, when compared to wild type donors. Similarly, log10 ferritin was higher than that in wild type donors by 0.02, 0.04 and 0.13 (equivalent to increases of 5%, 10% and 35%) in carriers of H63D, carriers of C282Y and those with two mutations, respectively. The magnitude of these changes can be compared to differences between males and females in the same regression models to better understand the effects of the HFE mutations (Table III). Males have higher CHr (+0.41g) and 100% higher ferritin (0.30 log10 ferritin) compared to female donors. As a result, the impact of carrier status for the HFE mutations on these two measures are of approximately equal magnitude as the impact of gender, where having two mutations has the largest impact among the HFE mutations.
Table III.
Parameter estimates* for CHr (pg), venous haemoglobin (g/l), log10 sTfR (mg/l), log10 Ferritin (μg/l) and log10 ratio of sTfR/Ferrtin
| CHr Model estimate (SE) | Venous Haemoglobin Model estimate (SE) | log10 sTfR Model estimate (SE) | log10 Ferritin Model estimate (SE) | log10 (sTfR/Ferritin) Model estimate (SE) | ||||||
|---|---|---|---|---|---|---|---|---|---|---|
| Mean** | 31.69 (0.60) | 139.4 (1.5) | 0.45 (0.02) | 1.62 (0.05) | 1.84 (0.06) | |||||
| Intercept*** | 32.72 (0.62) | 146.6 (2.7) | 0.42 (0.03) | 1.67 (0.07) | 1.76 (0.09) | |||||
| Race/Ethnicity | ||||||||||
| p-value | 0.001 | <0.0001 | <0.0001 | 0.007 | 0.06 | |||||
| Asian | −0.39 (0.64) | 0.14 (0.11) | 0.01 (0.02) | 0.12 (0.03) | −0.11 (0.04) | |||||
| Black | −1.39 (0.32) | −0.49 (0.09) | 0.07 (0.01) | 0.03 (0.03) | 0.04 (0.04) | |||||
| Hispanic | −0.76 (0.38) | −0.20 (0.11) | −0.01 (0.02) | −0.04 (0.03) | 0.03 (0.04) | |||||
| White | 0.00 | 0.00 | 0.00 | 0.00 | 0.00 | |||||
| Other | −0.64 (0.47) | −0.20 (0.15) | 0.00 (0.02) | 0.03 (0.06) | −0.03 (0.07) | |||||
| Gender | ||||||||||
| p-value | 0.07 | <0.0001 | 0.61 | <0.0001 | 0.001 | |||||
| Female | −0.41(0.35) | −1.66 (0.20) | 0.05 (0.02) | −0.30 (0.05) | 0.34 (0.05) | |||||
| Male | 0.00 | 0.00 | 0.00 | 0.00 | 0.00 | |||||
| Age (years) | Male | Female | Male | Female | Male | Female | Male | Female | Male | Female |
| p-value | 0.0001 | 0.002 | <0.0001 | 0.03 | 0.001 | 0.14 | 0.003 | <0.0001 | 0.005 | <0.0001 |
| 16 – 29 | 0.00 | 0.00 | 0.00 | 0.00 | 0.00 | 0.00 | 0.00 | 0.00 | 0.00 | 0.00 |
| 30 – 39 | 0.38 (0.28) | 0.42 (0.26) | −0.18 (0.09) | 0.09 (0.08) | 0.00 (0.01) | −0.01 (0.01) | 0.04 (0.03) | 0.11 (0.03) | −0.03 (0.04) | −0.13 (0.03) |
| 40 – 49 | 0.58 (0.22) | 0.88 (0.22) | −0.21 (0.09) | 0.18 (0.08) | −0.01 (0.01) | −0.03 (0.01) | 0.07 (0.03) | 0.19 (0.03) | −0.08 (0.03) | −0.22 (0.03) |
| 50 – 59 | 0.47 (0.21) | 0.69 (0.24) | −0.33 (0.09) | 0.21 (0.09) | 0.00 (0.01) | −0.03 (0.01) | −0.02 (0.03) | 0.23 (0.03) | 0.02 (0.03) | −0.26 (0.04) |
| 60+ | 1.01 (0.22) | 0.63 (0.27) | −0.46 (0.10) | 0.35 (0.11) | −0.04 (0.01) | −0.04 (0.02) | 0.02 (0.03) | 0.27 (0.03) | −0.05 (0.03) | −0.30 (0.04) |
| HFE genotype | ||||||||||
| p-value | <0.0001 | <0.0001 | <0.0001 | 0.003 | <0.0001 | |||||
| Wild Type or Missing | 0.00 | 0.00 | 0.00 | 0.00 | 0.00 | |||||
| Heterozygous H63D | 0.40 (0.12) | 0.14 (0.07) | −0.02 (0.01) | 0.02 (0.02) | −0.03 (0.02) | |||||
| Heterozygous C282Y | 0.50 (0.25) | 0.09 (0.12) | 0.00 (0.01) | 0.04 (0.03) | −0.04 (0.04) | |||||
| Double Mutation | 1.76 (0.42) | 0.57 (0.17) | −0.12 (0.02) | 0.13 (0.06) | −0.25 (0.06) | |||||
| Centre | ||||||||||
| p-value | <0.0001 | <0.0001 | <0.0001 | <0.0001 | 0.002 | |||||
| A | 0.77 (0.13) | 0.15 (0.06) | 0.01 (0.01) | 0.01 (0.02) | 0.00 (0.03) | |||||
| B | — | −0.72 (0.07) | −0.02 (0.01) | 0.03 (0.02) | −0.05 (0.03) | |||||
| C | — | 0.02 (0.07) | −0.02 (0.01) | 0.00 (0.02) | −0.01 (0.03) | |||||
| D | −0.66 (0.12) | −0.16 (0.06) | −0.04 (0.01) | −0.02 (0.02) | −0.02 (0.03) | |||||
| E | 0.20 (0.12) | −0.75 (0.06) | −0.01 (0.01) | −0.07 (0.02) | 0.06 (0.03) | |||||
| F | 0.00 | 0.00 | 0.00 | 0.00 | 0.00 | |||||
| Smoking | ||||||||||
| p-value | 0.10 | <0.0001 | <0.0001 | 0.005 | <0.0001 | |||||
| Current smoker | 0.22 (0.13) | 0.39 (0.06) | −0.04 (0.01) | 0.05 (0.02) | −0.09 (0.02) | |||||
| Past/Non/Unknown smoker | 0.00 | 0.00 | 0.00 | 0.00 | 0.00 | |||||
| Weight (kg) | Male | Female | Male | Female | Male | Female | Male | Female | Male | Female |
| p-value | 0.008 | <0.0001 | 0.08 | 0.57 | 0.08 | 0.0002 | <0.0001 | 0.001 | <0.0001 | 0.23 |
| < 68 | 0.00 | 0.00 | 0.00 | 0.00 | 0.00 | 0.00 | 0.00 | 0.00 | 0.00 | 0.00 |
| 68 – 78 | −0.29 (0.31) | −0.20 (0.14) | 0.01 (0.19) | 0.01 (0.05) | 0.04 (0.02) | 0.01 (0.01) | 0.04 (0.04) | 0.04 (0.02) | 0.00 (0.05) | −0.03 (0.02) |
| 79 – 90 | −0.50 (0.30) | −0.63 (0.16) | 0.04 (0.19) | 0.08 (0.07) | 0.05 (0.02) | 0.02 (0.01) | 0.06 (0.04) | 0.05 (0.02) | −0.01 (0.05) | −0.03 (0.03) |
| ≥ 91 | −0.77 (0.29) | −1.21 (0.18) | 0.18 (0.19) | 0.07 (0.08) | 0.05 (0.02) | 0.05 (0.01) | 0.17 (0.04) | 0.11 (0.03) | −0.12 (0.05) | −0.06 (0.03) |
| Iron Supplementation | ||||||||||
| p-value | 0.23 | 0.86 | 0.19 | 0.001 | 0.001 | |||||
| Iron Supplement | 0.11 (0.09) | −0.01 (0.04) | −0.01 (0.01) | 0.04 (0.01) | −0.05 (0.02) | |||||
| No iron Supplement | 0.00 | 0.00 | 0.00 | 0.00 | 0.00 | |||||
| Pregnancy Status | ||||||||||
| p-value | 0.04 | 0.12 | 0.04 | 0.009 | 0.01 | |||||
| Ever Pregnant | −0.40 (0.15) | −0.11 (0.06) | 0.02 (0.01) | −0.05 (0.02) | 0.07 (0.03) | |||||
| Female unknown preg status | −1.87 (1.33) | −0.23 (0.22) | 0.03 (0.03) | −0.25 (0.08) | 0.28 (0.09) | |||||
| Male or never pregnant | 0.00 | 0.00 | 0.00 | 0.00 | 0.00 | |||||
| Menstrual Cycle (female) | ||||||||||
| p-value | 0.21 | 0.001 | 0.09 | <0.0001 | 0.01 | |||||
| Periods have stopped | 0.21 (0.17) | 0.22 (0.07) | 0.02 (0.01) | 0.09 (0.02) | −0.08 (0.03) | |||||
| Still having periods | 0.00 | 0.00 | 0.00 | 0.00 | 0.00 | |||||
| TF G277S Genotype | ||||||||||
| p-value | 0.34 | 0.97 | 0.93 | 0.59 | 0.97 | |||||
| Wild Type | 0.00 | 0.00 | 0.00 | 0.00 | 0.00 | |||||
| Heterozygous or Homozygous | 0.149 (0.124) | 0.007 (0.061) | −0.006 (0.008) | 0.001 (0.018) | −0.005 (0.023) | |||||
| Missing | −0.565 (0.166) | 0.212 (0.106) | −0.005 (0.010) | −0.003 (0.023) | −0.004 (0.028) | |||||
| Red Cell Donations in the previous 2 years | ||||||||||
| p-value | <0.0001 | <0.0001 | <0.0001 | <0.0001 | <0.0001 | |||||
| 0 donations | 0.00 | 0.00 | 0.00 | 0.00 | 0.00 | |||||
| 1–3 donations | −0.60 (0.16) | −0.16 (0.05) | −0.03 (0.01) | −0.15 (0.02) | 0.12 (0.02) | |||||
| 4–9 donations | −0.94 (0.17) | −0.26 (0.06) | 0.01 (0.01) | −0.34 (0.02) | 0.34 (0.02) | |||||
| 10+ donations | −1.42 (0.20) | −0.54 (0.08) | 0.04 (0.01) | −0.44 (0.02) | 0.48 (0.03) | |||||
| Time Since Last Donation | ||||||||||
| p-value | 0.01 | <0.0001 | <0.0001 | <0.0001 | <0.0001 | |||||
| 8–13 weeks | −0.26 (0.10) | −0.25 (0.04) | 0.06 (0.005) | −0.23 (0.01) | 0.29 (0.01) | |||||
| 14–19 weeks | −0.14 (0.10) | −0.08 (0.04) | 0.02 (0.005) | −0.16 (0.01) | 0.19 (0.01) | |||||
| 20–25 weeks | 0.05 (0.12) | −0.13 (0.04) | 0.02 (0.004) | −0.08 (0.01) | 0.10 (0.01) | |||||
| 26+ weeks | 0.00 | 0.00 | 0.00 | 0.00 | 0.00 | |||||
| Red Cell Donations in the previous 2 years by HFE genotype | ||||||||||
| p-value | 0.08 | 0.24 | 0.05 | 0.01 | 0.02 | |||||
| See Figure 2, Panel A | See Figure 2, Panel B | See Figure 2, Panel C | See Figure 2, Panel D | See Figure 2, Panel E | ||||||
Parameter estimates are from repeated measures regression model with the fixed effects shown in the table and with random effects for within and between donor variation.
Mean is model least square mean at 0 donations in past 2 years.
Intercept is the model prediction for the reference donor (white, male, aged 16–29 years, no HFE mutation, at centre F, non-smoker, weight less than 68 kg, not taking iron supplements, without the TF G277S genotype, and having made no donations in the previous 2 years).
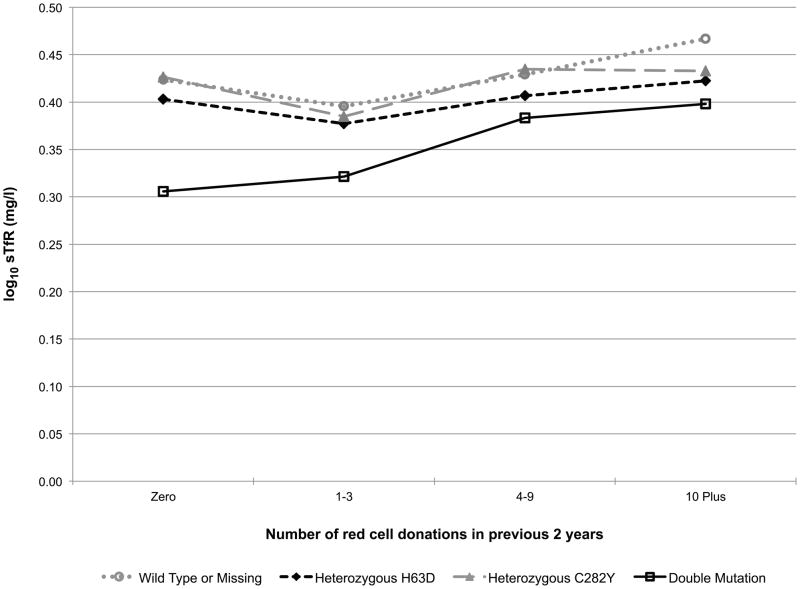
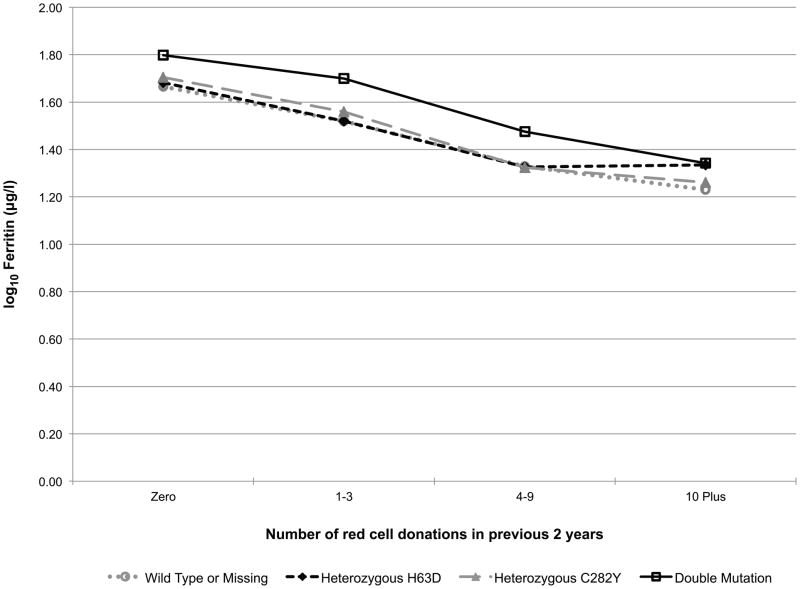
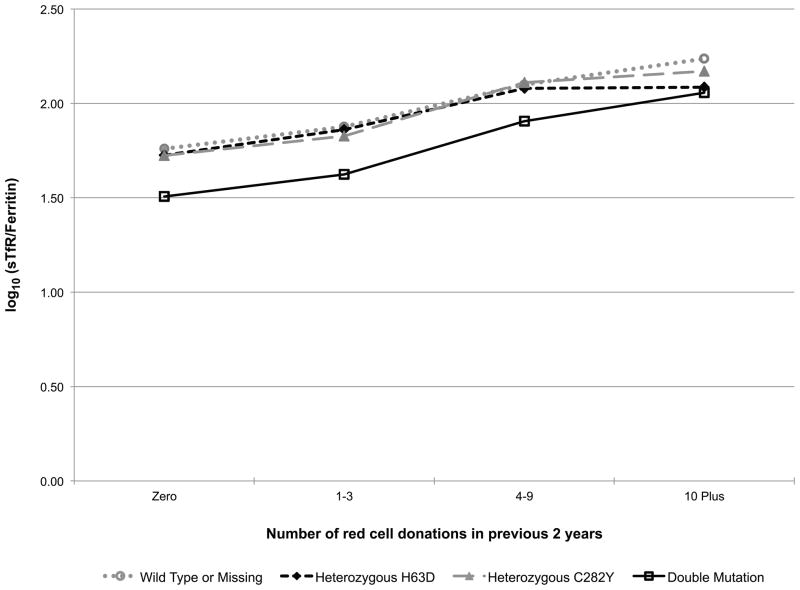
Additionally, the models included a donation intensity (“number of donations in the past 24 months”) by HFE genotype interaction to test if the longitudinal donation effect varied by HFE genotype (e.g. the iron stores of a favourable HFE genotype donor may not decline with repeated donations while the irons stores of a donor without the C282Y or H63D polymorphisms may indeed decline with repeated donations). This interaction effect is exhibited in Fig 2. In carriers of the HFE mutations each of the five measures trended roughly in parallel with those of donors without a mutation indicating that HFE carrier status does not protect donors from blood donation-associated alterations in haemoglobin and iron status (while patterns were similar, log10(ferritin) (p=0.01, Fig 2D) and log10(sTfR/ferritin) (p=0.02, Fig 2E) had statistically significant interactions, meaning trends are not parallel). Similarly, those with two mutations are not protected from blood donation-associated alterations in haemoglobin and iron status. Although these donors had greater initial measures of haemoglobin and iron stores, the impact of donation intensity was similar for all genotypes. Consistent with these findings the prevalence of HFE mutations was not increased in high intensity donors (>10 donations in the previous 24 months) participating in RISE (data not shown).
Fig 2.
Predicted changes in measures of haemoglobin and iron status with increasing donation intensity by HFE genotype. The analyses to generate the lines used information from the REDS-II donation database to determine the 24-month donation intensity for the frequent donors at each donation during the study. Individual donors contributed to different data points depending on changes in their 24-month donation intensity at the time of their study donations. A) CHr; B) venous haemoglobin; C) log(sTfR); D) log(ferritin); E) log(sTfR/ferritin).
The impact of the HFE mutations on changes in haemoglobin and iron parameters with time since last donation was also analysed. These interactions were not statistically significant in any of the haemoglobin or iron parameter models (data not shown).
Impact of iron stores on haemoglobin status
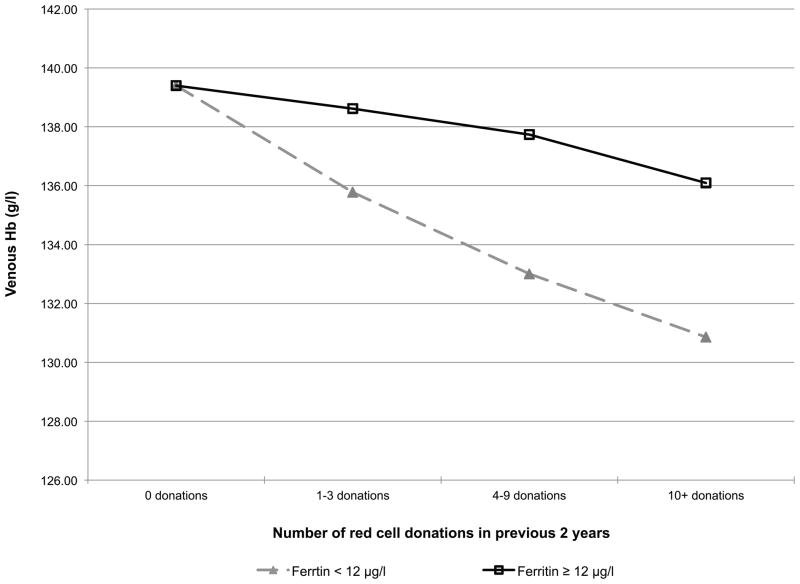
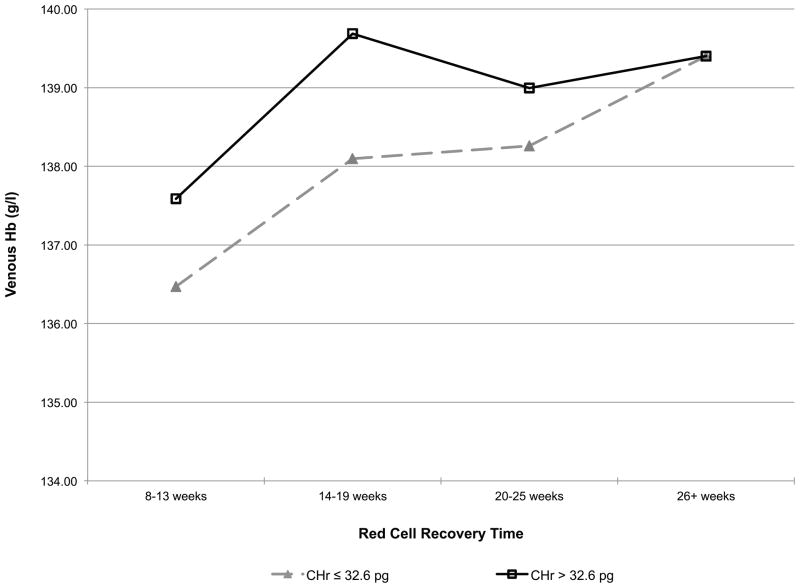
Given that donors with HFE mutations have higher iron stores and haemoglobin values than other donors, a secondary haemoglobin repeated measures regression model was postulated, where the longitudinal donation effect depends on iron stores (Fig 3). Specifically, the donation intensity by HFE interaction of Table II was replaced with a donation intensity by baseline ferritin interaction and a time since last donation by baseline CHr interaction. When the donor’s initial ferritin was ≥ 12 μg/l, venous haemoglobin decreased significantly more slowly with repeated donation than in those with ferritin <12 μg/l (Fig 3A). When the donor’s CHr was >32.6 pg, their post-donation venous haemoglobin returned to baseline more rapidly (14–19 weeks) than in those with CHr was ≤32.6 pg (26+ weeks) (Fig 3B), demonstrating that these measures of iron stores and haemoglobin, which are often elevated in those with HFE mutations, have a significant impact on an individual donor’s ability to repeatedly donate blood without iron deficient erythropoiesis or low haemoglobin deferral.
Fig 3.
A) Predicted changes in venous haemoglobin with increasing donation intensity based on ferritin. (■) ferritin <12 ng/ml; (◆) ferritin ≥ 12 ng/ml. B) Predicted venous haemoglobin recovery time following blood donation based on CHr. (■) CHr <32.6 pg; (◆) CHr ≥32.6.
Discussion
The relationship between the presence of HFE mutations and haemoglobin values and iron status was examined in a longitudinal study of individuals experiencing repeated iron loss through blood donation over a period of 15 to 24 months. It has previously been shown that individuals with iron deficiency anaemia have increased dietary iron absorption in response to their anaemia, and that the rate of dietary iron absorption in anaemic individuals is equal in those with or without HFE mutations (Beutler et al, 2003). In contrast, a study of 235 donors found that those with two HFE mutations maintained higher iron stores with frequent blood donation than donors without two HFE mutations (Boulton et al, 2000). Based on findings from these studies, we originally hypothesized that HFE mutations would slow the onset of iron deficient erythropoiesis in blood donors by allowing increased dietary iron absorption when they had depleted iron stores but had not yet developed anaemia. Thus, we performed continuous longitudinal analyses of data from the RISE study to assess the impact of HFE mutations on the gradual change in haemoglobin and iron stores. However, we were not able to confirm our hypothesis as measures of both haemoglobin and iron status changed essentially in parallel among donors with or without HFE mutations as they underwent repeated blood donation. Because of these parallel rates of change, with repeated donation those with HFE mutations will eventually succumb to iron deficient erythropoiesis in a manner similar to those without the mutations.
As expected, those with two HFE mutations had increased haemoglobin and iron stores at baseline. Perhaps more interestingly, carriers of either the C282Y or the H63D HFE mutations, who make up over 30% of the blood donor pool, also have increased haemoglobin and iron stores, albeit to a lesser extent, than those with two HFE mutations (Fig 2). These findings confirm previous reports demonstrating mildly increased ferritin and transferrin saturation in carriers of HFE mutations that is associated with a decreased prevalence of non-anaemic iron deficiency in carriers of the C282Y mutation (Beutler et al, 2003). The higher baseline levels of haemoglobin and iron stores suggest that donors with HFE mutations will initially be able to donate more frequently than other donors before development of iron deficiency erythropoiesis. This was indirectly assessed by examining how venous haemoglobin changes with increasing donation intensity, based on baseline ferritin and how long the recovery time for venous haemoglobin is following donation based on CHr at donation. These analyses indicate that donors lacking bone marrow iron stores, defined as ferritin <12 μg/l, have greater decreases in venous haemoglobin than donors with higher ferritin. Conversely, donors with high iron availability for new red blood cell synthesis, defined as CHr ≥32.6 pg, have shorter post-donation venous haemoglobin recovery time than donors with lower CHr. These findings are consistent with the presence of HFE mutations allowing first time donors to initially donate more frequently than first time donors without HFE mutations. However, there are many factors that can influence the baseline haemoglobin and iron status of blood donors besides HFE mutation status. Thus, ferritin, CHr, or perhaps other measures of iron status, are better choices for the initial assessment and monitoring iron status of frequent blood donors and for making recommendations for individualized donation frequency intervals or iron supplementation that will limit development of iron deficiency in blood donors. In this regard, diagnostic testing for plasma hepcidin has been recently developed and is undergoing study to determine situations where it will be clinically useful (Ganz et al, 2008). One such situation may be assessment of iron status in blood donors.
We have previously reported that high intensity blood donors who donate blood six times per year are a self-selected population that is resistant to the development of iron deficiency anaemia (Mast et al, 2008a;Mast et al, 2010). However, even in the large population of donors studied here, the prevalence of donors with HFE mutations was not different among the high intensity and lower intensity donors. This finding is consistent with previously published studies of smaller numbers of donors (Konig et al, 2003;Boulton et al, 2000) and confirms that it is unlikely that these mutations are responsible for potential genetic contributions to the ability of high intensity donors to repeatedly donate blood without developing iron deficiency anaemia. Another mutation studied in RISE is TF G227S. This mutation is associated with a reduction in total iron binding capacity and is a risk factor for iron deficiency anaemia in menstruating White women (Lee et al, 2001). However, it did not have an impact on haemoglobin or iron balance in the baseline or longitudinal analyses performed in RISE (Table III). Another interesting, recently identified candidate gene that may alter iron and haemoglobin status in blood donors is TMPRSS6, a membrane-associated serine protease that regulates hepcidin production and, therefore, indirectly regulates dietary iron absorption (Du et al, 2008). A polymorphism in TMPRSS6 associated with decreased iron stores and haemoglobin has been identified in four genome-wide association studies (Benyamin et al, 2009;Chambers et al, 2009;Tanaka et al, 2010;Ganesh et al, 2009). Further studies are needed to assess how this polymorphism alters risk for development of iron deficiency anaemia in frequent blood donors and whether or not it is selected for in high intensity donors.
Although the analyses performed here did not detect a significant impact of HFE mutations on iron status in the general donor population, examination of the frequency of different HFE genotypes in first time and repeat donors by race showed that H63D carriers were four-fold more prevalent in the frequent Black donors than would be expected based on the prevalence of H63D in first time/reactivated donors or in the HEIRS study (Adams et al, 2005). These data suggest that Black carriers of the H63D mutation may be more resistant to development of anaemia when under the stress of repeated blood donation than are Blacks that do not carry this mutation. There are numerous adaptive changes in iron metabolism and haemoglobin production that have occurred in different human gene pools and Blacks have lower average haemoglobin than other racial/ethnicity groups (Beutler & West, 2005). Although this is a preliminary finding that deserves further study, the selection for H63D carriers in frequent Black donors was not present in other races and suggests that H63D may interact with other genetic polymorphisms prevalent in Blacks to significantly increase dietary iron absorption and make this racial group resistant to anaemia. Unfortunately, there were not sufficient Black subjects enrolled in RISE for additional meaningful analyses of the potential significance of this finding to be conducted in the longitudinal phase of the study. Hispanic donors in RISE also had increased prevalence of H63D when compared to HEIRS, but this increase was present in both the first time/reactivated and frequent donors, and is not surprising because Hispanics have a great deal of variation in HFE genotype across geographic regions in the United States (Acton et al, 2006).
These studies of the impact of HFE mutation status on the haemoglobin and iron balance in blood donors have found that although the mutations produce initially elevated haemoglobin and iron stores, there is no effect on their rate of decline when individuals are subjected to haemoglobin and iron loss with repeated blood donation. These findings indicate that HFE mutation status of blood donors should not be used as a determinant of individualized donation intervals to prevent iron deficiency in frequent blood donors. Utilization of CHr, ferritin or other measures of iron status to assess the current haemoglobin or iron stores of donors represent are better choices for making individualized recommendations for donation intervals or iron supplementation to frequent blood donors.
Acknowledgments
Alan E. Mast designed research study, analysed the data and wrote the paper.
Tzong-Hae Lee performed genotyping studies.
Karen S. Schlumpf analysed the data and wrote the paper.
David J. Wright performed statistical analyses, analysed the data and wrote the paper.
Bryce Johnson performed statistical analyses.
Danielle M. Carrick managed the research study, analysed the data, and performed statistical analyses.
Ritchard G. Cable designed the research study.
Joseph E. Kiss designed the research study.
Simone A. Glynn designed the research study.
Whitney R. Steele managed the research study and performed statistical analyses.
Edward L. Murphy designed the research study.
Ronald Sacher designed the research study.
Michael P. Busch performed the genotyping studies and designed the research study.
The authors thank the staff at all six participating blood centres. Without their help, this study would not have been possible. Also, special thanks to Danielle Carrick and Yu Sun from Westat for their work on the baseline analyses. The Retrovirus Epidemiology Donor Study - II (REDS-II Study Group) is the responsibility of the following persons:
Blood Centres
American Red Cross Blood Services, New England Region
R. Cable, J. Rios and R. Benjamin
American Red Cross Blood Services, Southern Region/Department of Pathology and Laboratory Medicine, Emory University School of Medicine
J.D. Roback
Hoxworth Blood Center, University of Cincinnati Academic Health Center
R.A. Sacher, S.L. Wilkinson and P.M. Carey
Blood Centers of the Pacific, University of California San Francisco, Blood Systems Research Institute
E.L. Murphy, B. Custer and N. Hirschler
The Institute for Transfusion Medicine
D. Triulzi, R. Kakaiya and J. Kiss
Blood Center of Wisconsin
J.L. Gottschall and A.E. Mast
Coordinating Center: Westat, Inc
J. Schulman and M. King
National Heart, Lung, and Blood Institute, NIH
S.A Glynn
Central Laboratory: Blood Systems Research Institute
M.P. Busch and P. Norris
This work was supported by NHLBI contracts N01-HB-47168, -47169, -47170, -47171, -47172, -47174, -47175, and -57181
References
- Acton RT, Barton JC, Snively BM, McLaren CE, Adams PC, Harris EL, Speechley MR, McLaren GD, Dawkins FW, Leiendecker-Foster C, Holup JL, Balasubramanyam A. Geographic and racial/ethnic differences in HFE mutation frequencies in the Hemochromatosis and Iron Overload Screening (HEIRS) Study. Ethn Dis. 2006;16:815–821. [PubMed] [Google Scholar]
- Adams PC, Reboussin DM, Barton JC, McLaren CE, Eckfeldt JH, McLaren GD, Dawkins FW, Acton RT, Harris EL, Gordeuk VR, Leiendecker-Foster C, Speechley M, Snively BM, Holup JL, Thomson E, Sholinsky P. Hemochromatosis and iron-overload screening in a racially diverse population. The New England Journal of Medicine. 2005;352:1769–1778. doi: 10.1056/NEJMoa041534. [DOI] [PubMed] [Google Scholar]
- Benyamin B, Ferreira MA, Willemsen G, Gordon S, Middelberg RP, McEvoy BP, Hottenga JJ, Henders AK, Campbell MJ, Wallace L, Frazer IH, Heath AC, de Geus EJ, Nyholt DR, Visscher PM, Penninx BW, Boomsma DI, Martin NG, Montgomery GW, Whitfield JB. Common variants in TMPRSS6 are associated with iron status and erythrocyte volume. Nat Genet. 2009;41:1173–1175. doi: 10.1038/ng.456. [DOI] [PMC free article] [PubMed] [Google Scholar]
- Beutler E, West C. Hematologic differences between African-Americans and whites: the roles of iron deficiency and alpha-thalassemia on hemoglobin levels and mean corpuscular volume. Blood. 2005;106:740–745. doi: 10.1182/blood-2005-02-0713. [DOI] [PMC free article] [PubMed] [Google Scholar]
- Beutler E, Felitti V, Gelbart T, Waalen J. Haematological effects of the C282Y HFE mutation in homozygous and heterozygous states among subjects of northern and southern European ancestry. Br J Haematol. 2003;120:887–893. doi: 10.1046/j.1365-2141.2003.04215.x. [DOI] [PubMed] [Google Scholar]
- Boulton Collis, Inskip Paes, Garlick A study of the iron and HFE status of blood donors, including a group who failed the initial screen for anaemia. British Journal of Haematology. 2000;108:434–439. doi: 10.1046/j.1365-2141.2000.01878.x. [DOI] [PubMed] [Google Scholar]
- Cable RG, Glynn SA, Kiss JE, Mast AE, Steele WR, Murphy EL, Wright DJ, Sacher RA, Gottschall JL, Vij V, Simon TL. Iron deficiency in blood donors: analysis of enrollment data from the REDS-II Donor Iron Status Evaluation (RISE) study. Transfusion. 2011;51:511–522. doi: 10.1111/j.1537-2995.2010.02865.x. [DOI] [PMC free article] [PubMed] [Google Scholar]
- Chambers JC, Zhang W, Li Y, Sehmi J, Wass MN, Zabaneh D, Hoggart C, Bayele H, McCarthy MI, Peltonen L, Freimer NB, Srai SK, Maxwell PH, Sternberg MJ, Ruokonen A, Abecasis G, Jarvelin MR, Scott J, Elliott P, Kooner JS. Genome-wide association study identifies variants in TMPRSS6 associated with hemoglobin levels. Nat Genet. 2009;41:1170–1172. doi: 10.1038/ng.462. [DOI] [PMC free article] [PubMed] [Google Scholar]
- Du X, She E, Gelbart T, Truksa J, Lee P, Xia Y, Khovananth K, Mudd S, Mann N, Moresco EM, Beutler E, Beutler B. The Serine Protease TMPRSS6 Is Required to Sense Iron Deficiency. Science. 2008;320:1088–1092. doi: 10.1126/science.1157121. [DOI] [PMC free article] [PubMed] [Google Scholar]
- Feder JN, Gnirke A, Thomas W, Tsuchihashi Z, Ruddy DA, Basava A, Dormishian F, Domingo R, Ellis MC, Fullan A, Hinton LM, Jones NL, Kimmel BE, Kronmal GS, Lauer P, Lee VK, Loeb DB, Mapa FA, McClelland E, Meyer NC, Mintier GA, Moeller N, Moore T, Morikang E, Prass CE, Quintana L, Starnes SM, Schatzman RC, Brunke KJ, Drayna DT, Risch NJ, Bacon BR, Wolff RK. A novel MHC class I-like gene is mutated in patients with hereditary haemochromatosis. Nat Genet. 1996;13:399–408. doi: 10.1038/ng0896-399. [DOI] [PubMed] [Google Scholar]
- Ganesh SK, Zakai NA, van Rooij FJ, Soranzo N, Smith AV, Nalls MA, Chen MH, Kottgen A, Glazer NL, Dehghan A, Kuhnel B, Aspelund T, Yang Q, Tanaka T, Jaffe A, Bis JC, Verwoert GC, Teumer A, Fox CS, Guralnik JM, Ehret GB, Rice K, Felix JF, Rendon A, Eiriksdottir G, Levy D, Patel KV, Boerwinkle E, Rotter JI, Hofman A, Sambrook JG, Hernandez DG, Zheng G, Bandinelli S, Singleton AB, Coresh J, Lumley T, Uitterlinden AG, Vangils JM, Launer LJ, Cupples LA, Oostra BA, Zwaginga JJ, Ouwehand WH, Thein SL, Meisinger C, Deloukas P, Nauck M, Spector TD, Gieger C, Gudnason V, van Duijn CM, Psaty BM, Ferrucci L, Chakravarti A, Greinacher A, O’Donnell CJ, Witteman JC, Furth S, Cushman M, Harris TB, Lin JP. Multiple loci influence erythrocyte phenotypes in the CHARGE Consortium. Nat Genet. 2009;41:1191–1198. doi: 10.1038/ng.466. [DOI] [PMC free article] [PubMed] [Google Scholar]
- Ganz T, Olbina G, Girelli D, Nemeth E, Westerman M. Immunoassay for human serum hepcidin. Blood. 2008;112:4292–4297. doi: 10.1182/blood-2008-02-139915. [DOI] [PubMed] [Google Scholar]
- Gill RM, Lee TH, Utter GH, Reed WF, Wen L, Chafets D, Busch MP. The TNF (-308A) polymorphism is associated with microchimerism in transfused trauma patients. Blood. 2008;111:3880–3883. doi: 10.1182/blood-2007-08-107144. [DOI] [PMC free article] [PubMed] [Google Scholar]
- Jackson HA, Carter K, Darke C, Guttridge MG, Ravine D, Hutton RD, Napier JA, Worwood M. HFE mutations, iron deficiency and overload in 10, 500 blood donors. Br J Haematol. 2001;114:474–484. doi: 10.1046/j.1365-2141.2001.02949.x. [DOI] [PubMed] [Google Scholar]
- Karp JK, King KE. International variation in volunteer whole blood donor eligibility criteria. Transfusion. 2010;50:507–513. doi: 10.1111/j.1537-2995.2009.02392.x. [DOI] [PubMed] [Google Scholar]
- Konig D, Mattler S, Eichler H, Kluter H, Bugert P. Prevalence of the H63D and C282Y Mutations in the HFE Gene in 3, 015 Blood Donors from Southwestern Germany. Transfusion Medicine and Hemotherapy. 2003;30:66–70. [Google Scholar]
- Lee PL, Halloran C, Trevino R, Felitti V, Beutler E. Human transferrin G277S mutation: a risk factor for iron deficiency anaemia. British Journal of Haematology. 2001;115:329–333. doi: 10.1046/j.1365-2141.2001.03096.x. [DOI] [PubMed] [Google Scholar]
- Mast AE, Foster TM, Pinder HL, Beczkiewicz CA, Bellissimo DB, Murphy AT, Kovacevic S, Wroblewski VJ, Witcher DR. Behavioral, biochemical, and genetic analysis of iron metabolism in high-intensity blood donors. Transfusion. 2008a;48:2197–2204. doi: 10.1111/j.1537-2995.2008.01823.x. [DOI] [PubMed] [Google Scholar]
- Mast AE, Blinder MA, Dietzen DJ. Reticulocyte hemoglobin content. Am J Hematol. 2008b;83:307–310. doi: 10.1002/ajh.21090. [DOI] [PubMed] [Google Scholar]
- Mast AE, Schlumpf KS, Wright DJ, Custer B, Spencer B, Murphy EL, Simon TL. Demographic correlates of low hemoglobin deferral among prospective whole blood donors. Transfusion. 2010;50:1794–1802. doi: 10.1111/j.1537-2995.2010.02649.x. [DOI] [PMC free article] [PubMed] [Google Scholar]
- Nemeth E, Ganz T. Regulation of Iron Metabolism by Hepcidin. Annual Review of Nutrition. 2006;26:323–342. doi: 10.1146/annurev.nutr.26.061505.111303. [DOI] [PubMed] [Google Scholar]
- Nicolas G, Bennoun M, Devaux I, Beaumont C, Grandchamp B, Kahn A, Vaulont S. From the Cover: Lack of hepcidin gene expression and severe tissue iron overload in upstream stimulatory factor 2 (USF2) knockout mice. Proceedings of the National Academy of Sciences. 2001;98:8780–8785. doi: 10.1073/pnas.151179498. [DOI] [PMC free article] [PubMed] [Google Scholar]
- Tanaka T, Roy CN, Yao W, Matteini A, Semba RD, Arking D, Walston JD, Fried LP, Singleton A, Guralnik J, Abecasis GR, Bandinelli S, Longo DL, Ferrucci L. A genome-wide association analysis of serum iron concentrations. Blood. 2010;115:94–96. doi: 10.1182/blood-2009-07-232496. [DOI] [PMC free article] [PubMed] [Google Scholar]


