

Abstract
The domestic dog offers a remarkable opportunity to disentangle the genetics of complex phenotypes. Here, we explore a locus, previously identified in the Portuguese water dog (PWD), associated with PC2, a morphological principal component characterized as leg width versus leg length. The locus was initially mapped to a region of 26 Mb on canine chromosome 12 (CFA12) following a genome-wide scan. Subsequent and extensive genotyping of single-nucleotide polymorphisms (SNPs) and haplotype analysis in both the PWD and selected breeds representing phenotypic extremes of PC2 reduced the region from 26 Mb to 500 kb. The proximity of the critical interval to two collagen genes suggests that the phenotype may be controlled by cis-acting mechanisms.
Identification of the molecular underpinnings that give rise to morphological variation in mammals represents a formidable challenge (Chase et al. 1999; Lark et al. 2005; Wayne and Ostrander 2007). The genetic basis of many morphological traits is presumed to be polygenic, as evidenced by deviation from simple Mendelian inheritance. Individually, each genetic variant may contribute very little to altering the basic body plan of an organism (Chase et al. 1999; Lark et al. 2005). Collectively, these variants generate a quantitative effect whose sum imparts the basis of individuality (Chase et al. 2002; Lark et al. 2005). Further complicating their identification is the fact that many genetic variants responsible for complex traits are rare and tend to segregate within subpopulations (Ostrander and Kruglyak 2000). Thus, it is impractical to map complex traits using family-based approaches, which are typically underpowered.
The canine model system provides fertile ground for identifying the genetic basis that underlies complex, quantitative traits such as morphology (Lark et al. 2005; Ostrander and Wayne 2005; Wayne and Ostrander 2007). Modern day, domestic, purebred dogs display morphological diversity unparalleled by any other terrestrial species: Skeletal size, weight, and height vary tremendously from breed to breed and can be readily quantified with minimal invasiveness (Wayne 1986a,b; Wayne and Ostrander 2007). Belying their physical diversity, the underlying genetic complexity of purebred dogs is comparatively simple relative to humans. Population bottlenecks, closed breeding practices, and the use of popular sires have gradually reduced genetic diversity within breeds while exaggerating diversity between breeds (Ostrander et al. 2000; Parker et al. 2007). As a direct consequence, intrabreed linkage disequilibrium (LD) extends often on the order of megabases, at times nearly 10-fold that observed in humans (Sutter et al. 2004; Lindblad-Toh et al. 2005), whereas between breeds, LD rapidly decays (Lindblad-Toh et al. 2005). In practice, the long LD encountered in pedigree analyses is useful for coarse mapping, such as pinning quantitative trait loci (QTLs) to broad, subchromosomal regions, and multibreed comparisons facilitate fine mapping and haplotype identification, as evidenced by the recent identification of genes for a variety of diseases and morphologic traits (Zangerl et al. 2006; Parker et al. 2007, 2009; Sutter et al. 2007; Karlsson and Lind -blad-Toh 2008). Coupled with a 7.5x, high-quality genomic assembly and a dense set of identified single-nucleotide polymorphisms (SNPs) (Kirkness et al. 2003; Lindblad-Toh et al. 2005), the dog model offers the potential to map QTLs down to their causal variants.
Previously, pedigree studies using microsatellite markers were used to demonstrate the feasibility of mapping quantitative traits in PWDs, which display skeletal heterogeneity despite originating from only 30 founders (Chase et al. 1999, 2002). Using principal components analysis (PCA) to categorize radiograph measurements from 463 dogs, we previously mapped QTLs for several morphological traits. Principal component 1 (PC1) accounted for 54% of the skeletal variation observed in the PWDs and its loadings described overall skeletal size. The best marker association for PC1 was for a QTL located on chromosome 15 (Chase et al. 2002), and fine mapping at this locus revealed a single haplotype spanning the insulin growth factor 1 (IGF1) gene that cosegregated with small size in PWDs and approached fixation among many additional small-breed dogs (Sutter et al. 2007). These studies demonstrated that a genetic variant responsible for intra-breed morphological traits can also segregate among breeds that represent phenotypic extremes for the same trait. Furthermore, because LD varies among breeds, cross-breed comparisons proved integral to resolving a minimal haplotype (Sutter et al. 2007).
The initial mapping studies of Chase et al. (2002) identified PC2 as an inverse correlation between leg length and width. A QTL for PC2 mapped to chromosome 12 (CFA12) (Lark et al. 2006). Our analysis of SNPs segregating in PWDs has confirmed that association and prompted our fine mapping of the locus, which is summarized below.
MATERIALS AND METHODS
Sample collection and DNA isolation
DNA was isolated from blood samples collected from registered dogs of established breeds with at least three generations of available pedigree data. Individuals were recruited through American Kennel Club (AKC)-sanctioned dog shows, specialty events, breed clubs, and veterinary clinics. Samples were collected by licensed veterinarians or trained veterinary technicians through venipuncture of the cephalic vein using standard protocols approved by the national Human Genome Research Institute (NHGRI) Animal Care and Use Committee. In all cases, blood samples were collected into ACD or EDTA anticoagulant and shipped at room temperature to the Ostrander lab. Samples were stored at 4°C before DNA extraction. DNA isolation was performed by HealthGene, Inc. (Ontario, Canada) using standard proteinase K/phenol:chloroform isolation procedures. Quantitated DNA samples were suspended in 10 mM Tris base, 0.1 mM EDTA, aliquoted, and stored at −80°C.
Marker discovery and selection
All SNP positions given correspond to CanFam2. A total of 354 SNPs were selected for genotyping based on known markers included in the dog assembly (Lindblad-Toh et al. 2005) (http://www.broad.mit.edu/node/459, http://www.ncbi.nlm.nih.gov/projects/SNP/) or those discovered during Sanger sequencing of amplicons. Primers were designed with Primer3 (Rozen and Skaletsky 2000) using standard parameters, Tm= 60°C, and an optimal amplicon length of 500–700 bp. Segments were amplified using standard polymerase chain reaction (PCR) protocols and a 40-cycle touch-down thermocycler program at 61°C–51°C. Sanger sequencing was done using BigDye terminator sequencing kits and standard protocols (Applied Biosystems, Santa Clara, California). Traces were analyzed using PhredPhrap and Consed (Ewing and Green 1998; Ewing et al. 1998; Gordon et al. 1998). For fine mapping in the 500-kb region, 118 amplicons were designed and a total of 65,938 bp out of 416,264 bp were entirely sequenced, i.e., 16% of the region.
Phenotypic assessment of breeds
Phenotype assessment was based on tape measurement data (Sutter et al. 2008) collected from individual dogs of distinct breeds. For symmetrical left and right leg measurements, data were averaged. In total, 19 measurements (Table 1) were included for PCA from only those breeds with at least three representative members (707 dogs from 66 breeds). Analysis of measurement data was done using the nipalsPca method, part of the pcaMethods package implementable for R statistical software.
Table 1.
Factor Loadings of PC2 in a Set of 19 Measurements
| Measurements | PC2 loadings |
|---|---|
| Width/circumference | |
| chest | −0.375 |
| head | −0.374 |
| forefoot | −0.333 |
| neck girth | −0.311 |
| eye width | −0.305 |
| hindfoot | −0.275 |
| abdominal girth | −0.070 |
| Length | |
| head | −0.086 |
| body | 0.033 |
| forefoot | 0.071 |
| upper hind leg | 0.097 |
| upper fore leg | 0.150 |
| hindfoot | 0.150 |
| neck | 0.173 |
| snout | 0.185 |
| height at base of tail | 0.196 |
| height at withers | 0.222 |
| lower fore leg | 0.243 |
| lower hind leg | 0.244 |
A total of 707 dogs from 66 breeds were used for PCA. Factor loadings for PC2 indicate that leg circumference measurements are inversely correlated with length measurements.
Genotyping and association analyses
For the Illumina Golden Gate assay (Fan et al. 2006), 123 PWDs were genotyped according to the manufacturer’s protocol (Illumina Inc., San Diego, California). Genotypes were called using Beadstudio data analysis software v3.1 (Illumina Inc.). Association analysis was done using the Wald test implemented in PLINK (Purcell et al. 2007). Additional SNP genotyping was performed on 296 dogs using the SNPlex genotyping system and an ABI 3730XL genome analyzer with standard protocols (Applied Biosystems, Santa Clara, California). Genotype calls were generated using Gene-Mapper software v4.0 (Applied Biosystems). Of the 354 SNPs assayed, those with >20% missing data or a minor allele frequency of <1% were discarded, leaving 234 SNPs for further analysis. Individuals with >40% missing genotypes were also discarded from analysis, leaving 243 dogs for analyses (35 ThL dogs and 208 TiS dogs). Single-marker χ2 association was performed using PLINK (Purcell et al. 2007). Association testing of predicted haplotypes was done using Haploview (Barrett et al. 2005). The 1-Mb region defined by Haploview contains 90 SNPs. Those 90 SNPs were used to infer haplotypes using PHASE v2.1 (Stephens et al. 2001) for comparison be tween breeds.
RESULTS
A whole-genome scan of 463 PWDs using microsatellites identified a locus on CFA12 that controls PC2, the ratio of leg length to width (Fig. 1; Table 2) (Lark et al. 2006). The best-associated microsatellite, FH3585, was located at position 39,124,161 and had a p-value of 1.11 × 10⁻¹⁶. To confirm this association, an Illumina Golden Gate custom assay with 384 SNPs spanning the 26 Mb from base pairs 23,066,909 to 49,074,637 was designed; 123 PWDs for which PC2 values were available were genotyped. The best-associated SNP had a p-value of 2.50 × 10−08 and was located at position 35,077,940 bp. Seven additional contiguous SNPs located from base pairs 37,890,443 to 38,165,577 yielded significant results with p-values ranging from 5.55 × 10−05 to 6.14 × 10−07 (Fig. 2, top). Analysis of assembled haplotypes revealed that PWDs with positive PC2 scores were more homozygous for one haplotype in the 275,134-bp region spanning base pairs 37,890,443 to 38,165,577 than were PWDs with negative PC2 scores (25/31 compared to 7/30, respectively, p-value = 7.43 × 10⁻⁶). However, LD was, as expected, extensive in the breed due to the small number of founders.
Figure 1.
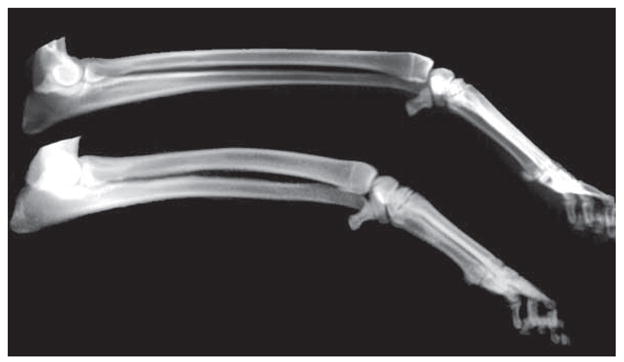
Radiographs of radius and ulna forelimb bones from PWDs with extreme PC2 values. Compare thin, longer limb bones (top) to thick, shorter limb bones (bottom).
Table 2.
Effects of the D Allele of FH3585 on Limb Length and Width in PWDs
| Traita | tstatb | p-valuec |
|---|---|---|
| Length | ||
| radius | −12.5 | <10−10 |
| tibia | −11.3 | <10−10 |
| humerus | −9.8 | <10−10 |
| femur | −6.2 | 8.22 × 10⁻¹⁰ |
| metatarsal | −5.6 | 2.14 × 10−08 |
| metacarpal | −3.8 | 9.93 × 10−05 |
| foot | −3.6 | 1.92 × 10−04 |
| Width | ||
| femur.I.D. | 2.7 | 3.15 × 10−03 |
| humerus.I.D. | 3.0 | 1.45 × 10−03 |
| tibia.I.D. | 3.2 | 7.94 × 10−04 |
| tibia.O.D. | 3.3 | 4.70 × 10−04 |
| humerus.O.D. | 3.4 | 3.54 × 10−04 |
| femur.O.D. | 4.7 | 2.15 × 10−06 |
| radius.O.D. | 5.6 | 1.62 × 10−08 |
| radius.I.D. | 5.9 | 3.04 × 10−09 |
Allele D effects on length and width were estimated using a mixed model with consanguinity between pairs of dogs as the random effect (pedigree effect) and allele count (0,1,2) as the fixed effect.
Values are residuals after removing the effect of size (PC1).
Represents the magnitude (number of standard errors) and direction of the allele effect with respect to the population as a whole.
Indicates the significance of the effect.
Figure 2.

Association analysis results from PWDs and multiple breeds. Graphs indicate χ2 test results of individual SNPs (top and bottom). (Top) Association analysis of 384 SNPs spanning 26 Mb in 123 PWDs. Positional overlap between PWDs and multiple breed analyses is indicated by the pink box. (Bottom) Expanded view of the multiple breed association analysis, which includes 234 SNPs from 243 dogs. The two best associated SNPs are indicated by asterisks. University of California at Santa Cruz browser view of the 4-Mb region genotyped in the multibreed fine mapping depicts human orthologs found within the CFA12 locus.
To reduce LD and thereby eliminate regions not associated with PC2, we genotyped dogs from several unrelated breeds. To assess breed average leg length/thickness variation, we used tape measurement data from 707 dogs of 66 distinct breeds to run PCA (Sutter et al. 2008). Although our measurements did not include leg bone diameter, they did include leg circumference, which we assumed would serve as a surrogate for leg bone diameter. As expected, factor loadings for the multibreed PC2 indicated that leg length was inversely correlated to leg circumference (Table 1). Mean PC2 values were calculated for each of the 66 breeds and those with extreme PC2 mean values were selected for fine-mapping studies (Fig. 3). For simplicity, we refer to individuals at the ends of the PC2 continuum as thin, long-legged (ThL) or thick, short-legged (TiS) dogs.
Figure 3.

Box whisker plot of PC2 by breed. Nineteen measurements from 707 dogs of various breeds were analyzed by PCA. In each box, the thick black line indicates the median PC2 value, whereas the upper and lower limits of each box represent the first and third quartiles, respectively. Dashed lines extend for data points within 1.5x the interquartile range. Open circles indicate outliers. A continuum of leg length/width ratio is observed among dogs of various breeds. Names in bold indicate breeds that were chosen for the multibreed fine mapping of the locus.
The PWD results indicated that the region of strong -est interest was between base pairs 35,077,940 and 38,165,577. We selected 354 putative SNPs listed in the CanFam assembly (Lindblad-Toh et al. 2005) as well as SNPs discovered by sequencing in the region spanning base pairs 34,414,776 to 38,676,086 (i.e., >4 Mb) and containing 30 genes (Fig. 2, bottom). In total, we genotyped 296 dogs from 32 breeds (60 dogs from 8 ThL breeds and 236 dogs from 24 TiS breeds) using the expanded marker set. Testing for association using χ2 analysis of individual SNPs revealed two SNPs at positions 38,159,975 and 38,207,563, which demonstrated highly significant associations (p-value = 2.24 × 10⁻²⁰; Fig. 2, bottom).
Using the program Haploview (Barrett et al. 2005), we identified associated haplotypes across the region. This analysis showed that seven contiguous LD blocks between base pairs 37,241,446 and 38,263,102 had significant p-values <10−13, thus reducing our region of interest to ~1 Mb. This region includes only three genes: RIMS1, MRPS9, and KCNQ5. Haplotype sharing among the different breeds was evaluated using PHASE inference (Stephens et al. 2001) and the 90 SNPs contained in the 1-Mb region. The most common haplotypes in the region were carried by 8 of 10 “chondrodysplastic” breeds, as well as the American cocker spaniel, all of whom are considered to be TiS-type breeds. Chondrodysplastic breeds are those that display fore-shortened limbs resembling disproportional dwarfism (American Kennel Club 1998; Parker et al. 2009). We also generated PHASE-inferred haplotypes using 20 SNP sliding windows at 10 SNP intervals for a total of eight windows. Only the first two windows contributed to the PHASE result that was observed with the entire region; subsequent windows indicated that an Italian greyhound, a ThL breed, shared the haplotype carried by the majority of TiS breeds. Thus, this last analysis allowed us to narrow the region of interest to between base pairs 37,241,446 and 37,657,100, which is less than 500 kb.
To further refine this 500-kb region, amplicons were designed and sequenced to discover new SNPs. These SNPs were then genotyped on a panel of 55 dogs: 22 ThL, 26 chondrodysplastic TiS, and 7 TiS nonchondrodysplastic. In total, 119 SNPs and indels were genotyped. Following quality filtering, 85 SNPs from 55 dogs were kept for association analysis using PLINK (Purcell et al. 2007). This analysis revealed 14 SNPs and one indel with p-values <10−9. Six of these SNPs were homozygous among ThL dogs (the exception being one heterozygous Italian greyhound), whereas thick-legged dogs carried all three genotypes. Those six SNPs are localized between base pairs 37,577,209 and 37,581,015, in a region where 25,884 bp was entirely sequenced (between base pairs 37,560,863 and 37,586,747) (Fig. 4). We also ran PHASE to infer haplotypes within the 26-kb region that was sequenced (Fig. 5). Two closely related haplotypes were found among 70.8% of ThL chromosomes, whereas among TiS breeds, the most common haplotype accounted for only 20% of chromosomes. These results suggest that the CFA12 genetic variant was selected to produce animals with long, thin legs.
Figure 4.

Genotyping results of 26 kb using 55 dogs. Each line represents a dog and each column represents a SNP or an indel. The first 22 dogs are ThL dogs, and the remaining 33 dogs are TiS dogs (26 “chondrodysplastic” and 7 nonchondrodysplastic). (Blue) Homozygous genotypes of the major allele among ThL dogs, (yellow) homozygous genotypes of the minor allele, (double-colored) heterozygous genotypes, (white spaces) missing genotypes. SNPs with p-values <10−9 are indicated in red, and those in homozygous regions in ThL breeds are boldfaced and underlined. Breed abbreviations: Afghan hound (AFGH), borzoi (BORZ), doberman pinscher (DOBP), greyhound (GREY), Italian greyhound (ITGY), Pharaoh hound (PHAR), saluki (SALU), whippet (WHIP), basset hound (BASS), Cardigan Welsh corgi (CARD), dachshund (DACH), dandie dinmont terrier (DDMT), Glen of Imaal terrier (GLEN), Lancashire terrier (LANC), petit basset griffon vendéen (PBGV), pekingese (PEKE), Pembroke Welsh corgi (PEMB), Scottish terrier (SCOT), Skye terrier (SKYE), Sussex spaniel (SUSX), Swedish Vallhund (SVAL), American cocker spaniel (ACKR), Bernese mountain dog (BMD), bloodhound (BLDH), bullmastiff (BULM), Staffordshire bull terrier (STAF).
Figure 5.

PHASE-inferred haplotypes for 57 dogs. PHASE inference was used to generate haplotypes from polymorphisms genotyped within the 26-kb region that was sequenced. Alleles of the three most common haplotypes (>5 chromosomes) are depicted according to position; the major allele among ThL dogs are colored blue and the minor allele yellow. Percentages indicate the number of haplotypes counted, divided by the total number of chromosomes for ThL or TiS dogs.
DISCUSSION
A pedigree-based, genome-wide microsatellite scan using PWDs indicated that a QTL on CFA12 is a major determinant of skeletal PC2 (leg length vs. leg width; Lark et al. 2006). By using a multibreed approach for fine mapping, the region of interest was initially reduced from 26 Mb to just over 3 Mb, and then finally to ~500 kb. The fine mapping results define a broad region of homozygosity found only among ThL dogs, suggesting that the CFA12 variant mapped here may function specifically to increase the ratio of leg length versus width.
Additional evidence of a leg morphology determinant on CFA12 comes from a separate study investigating the genetics of chondrodysplasia in domestic dogs. In this multibreed GWAS (genome-wide association study), a highly significant association was found on chromosome 18, corresponding to a FGF4 retrogene insertion (Parker et al. 2009). Other loci with less significant associations were identified in that study, one of them located on CFA12 (p-value = 5 ×10⁻³³) in a region corresponding to the CFA12 locus described here. Given the aforementioned homozygosity found among ThL breeds, we speculate that this genetic variant is incompatible with the FGF4 retrogene, because most chondrodysplastic dogs display the retrogene insertion and, simultaneously, rarely carry the ThL haplotype.
According to the CanFam2 assembly (Lindblad-Toh et al. 2005), the QTL defined by the initial PWD analyses contain at least 30 genes. However, two exceptional candidates, COL19A1 and COL9A1, located within this 3-Mb region, stand out: Both encode collagen genes, whose function in bone matrix formation makes them appealing candidates for regulating limb bone morphology. Col9a1-null mice display a reduction in long-bone growth that coincides with bone thickening (Dreier et al. 2008). Furthermore, TSP3/TSP5/Col9a1 combinatorial knockout mice display skeletal defects including a reduction in limb length, a phenotype attributed to disorganization of the growth plates (Posey et al. 2008). Despite reducing the critical interval nearly sixfold, we were unable to determine the actual causal variant using our multibreed approach. In fact, the strongest associations and best haplotype from our multibreed analyses indicate that the relevant genetic variant is located upstream of both collagen genes. The 500-kb region identified by our fine mapping is devoid of genes with known osteogenic function, and sequencing of the RIMS1 exons located in this region failed to reveal SNPs in strong association with PC2. On the basis of these results, it is likely that the causal mutation is hidden within intergenic sequences, perhaps affecting a cryptic distant enhancer of a neighboring gene, or the mutation could occur as a novel gain-of-function insertion, or rearrangement, as recently demonstrated by Parker et al. (2009). Ultimately then, discovery of the causal mutation will likely require sequencing of the entire 500-kb region in a panel of TiS and ThL dog breeds. Although such an endeavor would have previously been impractical, targeted sequence capture technologies coupled with next-generation sequencing should allow deep sequencing across the 500-kb region in the very near future.
PC2 highlights a trade-off in functional morphology between energy-efficient speed (long, thin [light] bones, e.g., the greyhound) and the generation of force (short, thick bones, e.g., the pit bull) (Chase et al. 2002). This trade-off appears to be ancient and is found in the red fox (Vulpes vulpes) (Kharlamova et al. 2007), a lineage that represents the outgroup of modern canids separated from Canis familiaris by 10 million years (Wayne 1993; Vila et al. 1997). This indicates an evolutionarily conserved coordinate network of growth regulation. The locus on CFA12 may be modifying part of this network along a functional continuum, regulating elongation—the endochondrial growth that takes place at the epiphysial plate—versus periosteal growth that increases bone width. It remains unclear whether one gene controls both growth zones or whether there are two closely linked loci within the large LD spanned by the 500-kb interval. Future studies using the approach exemplified here should discriminate between these two possibilities. However, the fact that one linkage group can regulate such a trade-off explains why it has been possible for breeders to rapidly change the functional morphology of dogs encompassing a range that includes so many different morphological types.
Acknowledgments
We gratefully acknowledge the National Institutes of Health grant GM063056 (K.G.L. and K.C.), the AKC Canine Health Foundation, and the Intramural Program of the National Human Genome Research Institute. Radiographs of PWDs were obtained through the Georgie Project, Karen Miller, Director. K.G.L. acknowledges gifts from the Judith Chiara Charitable Trust and the Nestle Purina Company. We thank Dr. Robert K. Wayne and members of our laboratories for helpful comments. Finally, we thank also the many dog owners who generously provided us with samples from their pets.
References
- American Kennel Club. The complete dog book. Howell; New York: 1998. [Google Scholar]
- Barrett JC, Fry B, Maller J, Daly MJ. Haploview: Analysis and visualization of LD and haplotype maps. Bioinformatics. 2005;21:263–265. doi: 10.1093/bioinformatics/bth457. [DOI] [PubMed] [Google Scholar]
- Chase K, Adler FR, Miller-Stebbings K, Lark KG. Teaching a new dog old tricks: Identifying quantitative trait loci using lessons from plants. J Hered. 1999;90:43–51. doi: 10.1093/jhered/90.1.43. [DOI] [PubMed] [Google Scholar]
- Chase K, Carrier DR, Adler FR, Jarvik T, Ostrander EA, Lorentzen TD, Lark KG. Genetic basis for systems of skeletal quantitative traits: Principal component analysis of the canid skeleton. Proc Natl Acad Sci. 2002;99:9930–9935. doi: 10.1073/pnas.152333099. [DOI] [PMC free article] [PubMed] [Google Scholar]
- Dreier R, Opolka A, Grifka J, Bruckner P, Grossel S. Collagen IX-deficiency seriously compromises growth cartilage development in mice. Matrix Biol. 2008;27:319–329. doi: 10.1016/j.matbio.2008.01.006. [DOI] [PubMed] [Google Scholar]
- Ewing B, Green P. Base-calling of automated sequencer traces using phred. II. Error probabilities. Genome Res. 1998;8:186–194. [PubMed] [Google Scholar]
- Ewing B, Hillier L, Wendl MC, Green P. Base-calling of automated sequencer traces using phred. I. Accuracy assessment. Genome Res. 1998;8:175–185. doi: 10.1101/gr.8.3.175. [DOI] [PubMed] [Google Scholar]
- Fan JB, Chee MS, Gunderson KL. Highly parallel genomic assays. Nat Rev Genet. 2006;7:632–644. doi: 10.1038/nrg1901. [DOI] [PubMed] [Google Scholar]
- Gordon D, Abajian C, Green P. Consed: A graphical tool for sequence finishing. Genome Res. 1998;8:195–202. doi: 10.1101/gr.8.3.195. [DOI] [PubMed] [Google Scholar]
- Karlsson EK, Lindblad-Toh K. Leader of the pack: Gene mapping in dogs and other model organisms. Nat Rev Genet. 2008;9:713–725. doi: 10.1038/nrg2382. [DOI] [PubMed] [Google Scholar]
- Kharlamova AV, Trut LN, Carrier DR, Chase K, Lark KG. Genetic regulation of canine skeletal traits: Trade-offs between the hind limbs and forelimbs in the fox and dog. Integr Comp Biol. 2007;47:373–381. doi: 10.1093/icb/icm023. [DOI] [PMC free article] [PubMed] [Google Scholar]
- Kirkness EF, Bafna V, Halpern AL, Levy S, Remington K, Rusch DB, Delcher AL, Pop M, Wang W, Fraser CM, Venter JC. The dog genome: Survey sequencing and comparative analysis. Science. 2003;301:1898–1903. doi: 10.1126/science.1086432. [DOI] [PubMed] [Google Scholar]
- Lark KG, Chase K, Sutter NB. Genetic architecture of the dog: Sexual size dimorphism and functional morphology. Trends Genet. 2006;22:537–544. doi: 10.1016/j.tig.2006.08.009. [DOI] [PMC free article] [PubMed] [Google Scholar]
- Lark KG, Chase K, Carrier DR, Adler FR. Genetic analysis of the canid skeleton: Morphological loci in the Portuguese water dog population. In: Ostrander EA, et al., editors. The dog and its genome. Cold Spring Harbor Laboratory Press; Cold Spring Harbor, New York: 2005. pp. 67–80. [Google Scholar]
- Lindblad-Toh K, Wade CM, Mikkelsen TS, Karlsson EK, Jaffe DB, Kamal M, Clamp M, Chang JL, Kulbokas EJ, Zody MC, et al. Genome sequence, comparative analysis and haplotype structure of the domestic dog. Nature. 2005;438:803–819. doi: 10.1038/nature04338. [DOI] [PubMed] [Google Scholar]
- Ostrander EA, Kruglyak L. Unleashing the canine genome. Genome Res. 2000;10:1271–1274. doi: 10.1101/gr.155900. [DOI] [PubMed] [Google Scholar]
- Ostrander EA, Wayne RK. The canine genome. Genome Res. 2005;15:1706–1716. doi: 10.1101/gr.3736605. [DOI] [PubMed] [Google Scholar]
- Ostrander EA, Galibert F, Patterson DF. Canine genetics comes of age. Trends Genet. 2000;16:117–124. doi: 10.1016/s0168-9525(99)01958-7. [DOI] [PubMed] [Google Scholar]
- Parker H, Kukekova A, Akey D, Goldstein O, Kirkness EF, Baysac K, Mosher DS, Aguirre G, Acland GM, Ostrander EA. Breed relationships facilitate fine mapping studies: A 7.8 Kb deletion cosegregates with collie eye anomaly across multiple dog breeds. Genome Res. 2007;17:1562–1571. doi: 10.1101/gr.6772807. [DOI] [PMC free article] [PubMed] [Google Scholar]
- Parker HG, VonHoldt BM, Quignon P, Margulies EH, Shao S, Mosher DS, Spady TC, Elkahloun A, Cargill M, Jones PG, et al. An expressed fgf4 retrogene is associated with breed-defining chondrodysplasia in domestic dogs. Science. 2009 doi: 10.1126/science.1173275. (in press) [DOI] [PMC free article] [PubMed] [Google Scholar]
- Posey KL, Hankenson K, Veerisetty AC, Bornstein P, Lawler J, Hecht JT. Skeletal abnormalities in mice lacking extracellular matrix proteins, thrombospondin-1, thrombospondin-3, thrombospondin-5, and type IX collagen. Am J Pathol. 2008;172:1664–1674. doi: 10.2353/ajpath.2008.071094. [DOI] [PMC free article] [PubMed] [Google Scholar]
- Purcell S, Neale B, Todd-Brown K, Thomas L, Ferreira MA, Bender D, Maller J, Sklar P, de Bakker PI, Daly MJ, Sham PC. PLINK: A tool set for whole-genome association and population-based linkage analyses. Am J Hum Genet. 2007;81:559–575. doi: 10.1086/519795. [DOI] [PMC free article] [PubMed] [Google Scholar]
- Rozen S, Skaletsky H. Primer3 on the WWW for general users and for biologist programmers. Methods Mol Biol. 2000;132:365–386. doi: 10.1385/1-59259-192-2:365. [DOI] [PubMed] [Google Scholar]
- Stephens M, Smith NJ, Donnelly P. A new statistical method for haplotype reconstruction from population data. Am J Hum Genet. 2001;68:978–989. doi: 10.1086/319501. [DOI] [PMC free article] [PubMed] [Google Scholar]
- Sutter NB, Mosher DS, Gray MM, Ostrander EA. Morphometrics within dog breeds are highly reproducible and dispute Rensch’s rule. Mamm Genome. 2008;19:713–723. doi: 10.1007/s00335-008-9153-6. [DOI] [PMC free article] [PubMed] [Google Scholar]
- Sutter NB, Eberle MA, Parker HG, Pullar BJ, Kirkness EF, Kruglyak L, Ostrander EA. Extensive and breed-specific linkage disequilibrium in Canis familiaris. Genome Res. 2004;14:2388–2396. doi: 10.1101/gr.3147604. [DOI] [PMC free article] [PubMed] [Google Scholar]
- Sutter NB, Bustamante CD, Chase K, Gray MM, Zhao K, Zhu L, Padhukasahasram B, Karlins E, Davis S, Jones PG, et al. A single IGF1 allele is a major determinant of small size in dogs. Science. 2007;316:112–115. doi: 10.1126/science.1137045. [DOI] [PMC free article] [PubMed] [Google Scholar]
- Vila C, Savolainen P, Maldonado JE, Amorim IR, Rice JE, Honeycutt RL, Crandall KA, Lundeberg J, Wayne RK. Multiple and ancient origins of the domestic dog. Science. 1997;276:1687–1689. doi: 10.1126/science.276.5319.1687. [DOI] [PubMed] [Google Scholar]
- Wayne RK. Cranial morphology of domestic and wild canids: The influence of development on morphological change. Evolution. 1986a;40:243–261. doi: 10.1111/j.1558-5646.1986.tb00467.x. [DOI] [PubMed] [Google Scholar]
- Wayne RK. Limb morphology of domestic and wild canids: The influence of development on morphologic change. J Morphol. 1986b;187:301–319. doi: 10.1002/jmor.1051870304. [DOI] [PubMed] [Google Scholar]
- Wayne RK. Molecular evolution of the dog family. Trends Genet. 1993;9:218–224. doi: 10.1016/0168-9525(93)90122-x. [DOI] [PubMed] [Google Scholar]
- Wayne RK, Ostrander EA. Lessons learned from the dog genome. Trends Genet. 2007;23:557–567. doi: 10.1016/j.tig.2007.08.013. [DOI] [PubMed] [Google Scholar]
- Zangerl B, Goldstein O, Philp AR, Lindauer SJ, Pearce-Kelling SE, Mullins RF, Graphodatsky AS, Ripoll D, Felix JS, Stone EM, et al. Identical mutation in a novel retinal gene causes progressive rod-cone degeneration in dogs and retinitis pigmentosa in humans. Genomics. 2006;88:551–563. doi: 10.1016/j.ygeno.2006.07.007. [DOI] [PMC free article] [PubMed] [Google Scholar]