

Abstract
The acquisition of cell motility plays a critical role in the spread of prostate cancer (PC), therefore, identifying a sensitive step that regulates PC cell migration should provide a promising target to block PC metastasis. Here, we report that a mechanosensitive Ca2+-permeable cation channel (MscCa) is expressed in the highly migratory/invasive human PC cell line, PC-3 and that inhibition of MscCa by Gd3+ or GsMTx-4 blocks PC-3 cell migration and associated elevations in [Ca2+]i. Genetic suppression or overexpression of specific members of the canonical transient receptor potential Ca2+ channel family (TRPC1 and TRPC3) also inhibit PC-3 cell migration, but they do so by mechanisms other that altering MscCa activity. Although LNCaP cells are nonmigratory, they also express relatively large MscCa currents, indicating that MscCa expression alone cannot confer motility on PC cells. MscCa in both cell lines show similar conductance and ion selectivity and both are functionally coupled via Ca2+ influx to a small Ca2+-activated K+ channel. However, MscCa in PC-3 and LNCaP cell patches show markedly different gating dynamics—while PC-3 cells typically express a sustained, non-inactivating MscCa current, LNCaP cells express a mechanically-fragile, rapidly inactivating MscCa current. Moreover, mechanical forces applied to the patch, can induce an irreversible transition from the transient to the sustained MscCa gating mode. Given that cancer cells experience increasing compressive and shear forces within a growing tumor, a similar shift in channel gating in situ would have significant effects on Ca2+ signaling that may play a role in tumor progression.
Keywords: mechanosensitive, Ca2+ channels, prostate cancer, migration, metastasis
Introduction
Prostate cancer (PC) is a progressive disease involving transformation to unlimited cell growth, immortalization to escape the limits of senescence/apoptosis, and the ability to spread to distal sites (invasion and metastasis). In order for PC to spread, tumor cells must migrate from the prostate, pass through blood vessels, penetrate into the secondary tumor site (typically bone) and migrate through its tissue to establish a metastasis.1 Cell migration is therefore necessary although not sufficient for invasion and metastasis, which also require the additional steps of barrier matrix breakdown, and tumor cell adherence, growth and angiogenesis at the secondary sites.2 Nevertheless, because metastasis will only be achieved if the tumor cell completes every step in this cascade, identifying the most sensitive and susceptible step in tumor cell migration should provide a promising target to block PC metastasis.3
A common form of cell migration known as mesenchymal or fibroblastic migration share a basic cycle of mechanical steps involving: (1) the cell’s leading edge being pushed forward as growing actin polymers poke into, and physically deform the cell membrane; (2) the front of the cell forming adhesions with the substrate/extracellular matrix (ECM); (3) the rest of the cell being pulled forward by myosin-cytoskeleton (CSK) contraction that exerts traction force against the ECM via the cell adhesions; (4) the whole cell becoming progressively stretched as the traction force, developed at the cell front, pulls against the rest of the cell; (5) the rear adhesions detaching from the ECM allowing net cell displacement and relaxation of membrane stretch.4-6 A key issue regarding this cycle concerns the mechanosensitive (MS) mechanisms that coordinate forward protrusion with rear retraction. Based on patch clamp studies of fast moving fish keratocytes, it was proposed that the mechanosensitive Ca2+ permeant cation channel (MscCa) could serve this function by its ability to “sense” and transduce membrane stretch into Ca2+ influx and thereby provide feedback between mechanisms that cause cell forward protrusion and those Ca2+-dependent mechanisms (e.g., cell contractility and adhesion disassembly) that promote rear retraction.7 More recently, a study of human fibroblasts has shown that MscCa activity, predominating in the leading edge/lamellipodium, regulates both forward protrusion and chemotaxis.8 Since the process of cell migration is conserved in both normal and cancer cells, we thought that MscCa activity might also be important for coordinating PC cell migration. To test this idea we have studied whether MscCa activity is expressed in PC cells and whether MscCa activity is required for PC cell migration. We also determine whether MscCa expression/properties differ between migratory and nonmigratory PC cells.
Results
We first characterized the morphology and motility of cells from two different human prostate cancer cell lines, as well as their subcellular distribution of endoplasmic reticulum(ER)/Ca2+ stores. Figure 1 shows photomicrographs of typical LNCaP and PC-3 cells—whereas the LNCaP cell is spindle-shaped with multiple processes (Fig. 1A), the PC-3 cell displays a highly polarized morphology with a forward protruding flat lamellipodium and a trailing tail (Fig. 1C). Figures 1B and D show confocal fluorescent images of the same cells labeled with BODIPY FL-thapsigargin to measure the subcellular distribution of ER/internal Ca2+ stores.9 The LNCaP cell exhibits a relatively uniform fluorescence extending up to and abutting the cell’s perimeter. In contrast, the PC-3 cell shows no detectable fluorescence around most of its perimeter, particularly within the regions of the lamella and lamellipodium. An earlier electron microscopy study also indicated lamellipodia are devoid of membranous organelles including the ER.10 The absence of ER/Ca2+ stores would diminish a significant role for Ca2+ release from internal Ca2+ stores as a mechanism for amplifying Ca2+ influx signals within the lamella/lamellipodia of PC-3 cells. On the other hand, a lack of Ca2+ amplification in the front of the cell compared with the rear could contribute to the [Ca2+]i gradient that increases toward the rear of migrating PC-3 cells.

Figure 1. Transmission and fluorescent confocal images of LNCaP and PC-3 cells labeled with 200 nM BODIPY FL thapsigargin to measure ER/internal Ca2+ store distribution. (A) The LNCaP cell shows a typical spindle-shaped, multipolar morphology. (B) The transmission-image outline of the LNCaP cell overlaps with the fluorescent image indicating a uniform ER distribution within the cytoplasm and ER adjacent to the surface membrane. The fluorescent image represents the maximum intensity projection reconstructed from a stack of 25 confocal sections obtained at 0.2 μm intervals. (C) The PC-3 cell shows a typical polarized morphology with a broad flat lamellipodium and a thin, trailing tether. (D) The fluorescent image indicates a lack of thapsigargin-related signal around the general perimeter of the cell, particularly from within the lamella and lamellipodium consistent with ER absence in these regions.
PC-3 and LNCaP cells also differ markedly in their motility—whereas PC-3 cells undergo random directional movements with an average speed of ~0.5 μm/min, LNCP cells show insignificant net movements/displacements of < 0.01 μm/min. However, LNCaP cells do undergo membrane pulsations that involve transient protrusion of multiple membrane mini-lamellipodia/blebs randomly around their perimeter. The difference in motility is also evident in wound closure assays—PC-3 cells are able to close a 500 μm wide “wound” (i.e., a scratch in the cell monolayer) within 24 h, whereas LNCaP cells show no evidence of “wound” closure after 72 h (Fig. S1).
Forming tight seals on LNCaP and PC-3 cells
The first step in patch clamp recording—forming a tight seal—depends upon application of pipette suction to deform and aspirate a “membrane bleb” into the pipette tip so that it can seal tightly to the walls of the pipette. We consistently observed that stronger (≥ 40 mmHg vs. 5 mmHg) and longer duration (≥ 10 sec vs. ≤ 1 sec) suction was required to form tight seals on PC-3 cells compared with LNCaP cells (Fig. 2). This was not due to differences in culture or recording conditions (i.e., both cell lines were grown in the same culture medium and recorded with similar pipettes and pipette solutions). However, it may reflect the relatively stiffer PC-3 cell membrane (i.e., the complex of the membrane bilayer and the underlying cortical cytoskeleton) compared with LNCaP as measured by atomic force microscopy (AFM).11 In particular, AFM results indicate that PC-3 cell membrane has a 5-fold larger Young’s modulus than LNCaP cell membrane.11 The stiffer membrane may also explain why seals on PC-3 cells don’t seal as tight as seals on LNCaP cells, assuming that a stiffer membrane cannot be easily deformed and pressed against the pipette walls. The requirement of stronger sealing protocols for PC-3 cells may also inadvertently induce alterations in MS channel gating, since previous studies indicate that even moderate increases in suction can irreversibly alter MS channel gating dynamics.12-14 Indeed, as described below MS channels in both PC-3 and LNCaP cells do display mechanically-fragile gating dynamics.
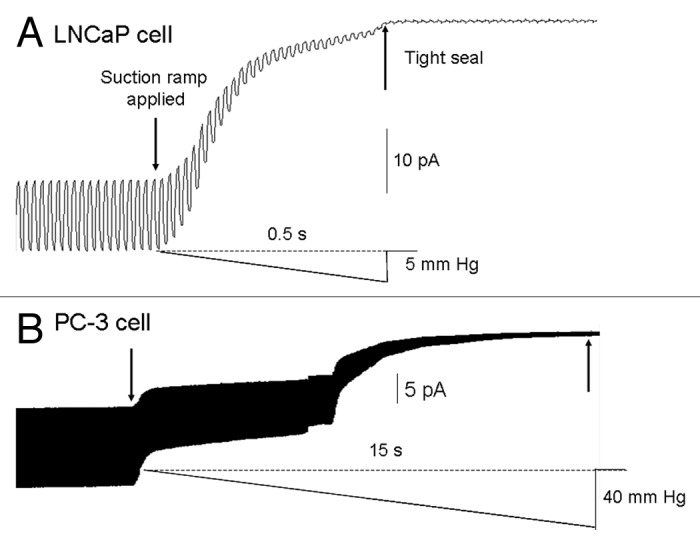
Figure 2. The typical time course for tight-seal formation on LNCaP and PC-3 cells. (A) A test pulse of 1 mV was applied to monitor the pipette resistance during the application of a suction ramp applied after first contact with the LNCaP cell surface; a tight seal of ~10 gigaohms was formed within 0.5 sec of applying the ramp that ended at 5 mmHg. (B) Sealing on PC-3 cells required a longer duration (15 sec) and stronger suction (40 mmHg) to form tight seals that were also not as tight (i.e., ~1 vs 10 GΩ) as those achieved on LNCaP cells.
Mechanosensitive currents in PC-3
The majority of PC-3 cell patches (82 out of 102) were active and expressed MS currents in response to applied suction—in the other 20% of patches, suction steps, even up to near patch-rupture suctions (~100 mmHg) were ineffective in activating currents, and these patches were considered devoid of MS channels (i.e., “MscCa null patches”). The typical “active” PC-3 cell patch did not express spontaneous current activity at resting membrane potentials (~-30 mV) and displayed a threshold for MS current activation of ~40 mmHg, a half-maximal response at ~80 mmHg, and response saturation at ~100 mmHg. The mean saturated current was around ~20 pA, consistent with an average channel density of ~10 channels/patch based on a single channel current of ~2 pA measured at the same patch potential of -100 mV. However, MS channel density on active patches could vary from 1–20 channels/patch (Fig. 3). For the majority of the active patches (79 out of 82), steps in suction activated sustained MS currents that lasted for the duration of the stimulus (Fig. 3A and B). However, a significant proportion of the active patches (~30%) also showed delays in the current turn-on and subsequent turn-off with step and ramp stimulation (Fig. 3C and D). One possible explanation for the delay in turn on is that cytoskeletal (CSK) elements “protect the membrane” from sudden increases in tension, and this protection is overcome by increasing mechanical stimulation (Fig. 3C).12-14

Figure 3. Typical MS currents in PC-3 cell patches activated by suction steps or ramps. (A) An initial suction step of 40 mmHg activated unitary currents of ~2 pA and subsequent larger steps activated larger and more sustained MS currents that lasted for the full duration of the pulse. (B) A staircase increase in suction caused a sigmoidal activation of MS current that turned on at ~40 mmHg and saturated at ~100 mmHg. (C) The responses of a different PC-3 cell patch in which the initial suction step of 40 mmHg activated a delayed (50 ms) and slow rising MS current that also showed a delayed turn-off after the step. With increasing step-size the delay time for activation was reduced without altering the delayed turn-off. (D) Same patch as in C showing the delayed turn-off after ramps. Patch potential was -100 mV and the pipette solution was 100 K+/0 Ca2+.
In contrast to the typical sustained currents described in Figure 3, a few PC-3 cell patches (3 out of 82) responded with transient currents that rapidly turned on but also rapidly decayed back toward baseline despite maintained suction (Fig. 4A and B, top trace). In the patch shown in Figure 4A, the transient currents were repetitively activated by moderate suction pulses (20 mmHg) but if stronger suctions (50 mmHg) were applied to the same patch, there was a progressive decrease in the peak current and increase in the sustained current (Fig. 4B). This shift from a transient to a smaller sustained current was not reversed by “resting” the patch for several minutes (data not shown). In another patch shown in Figure 4C, distinctly biphasic currents with equal transient and sustained components were initially recorded, but with continued repetitive stimulation the transient component “faded” leaving only the sustained component. Several possible mechanisms may account for the heterogeneous kinetic responses (i.e., sustained vs. transient) including a possible variation in membrane patch mechanics/MS properties in different regions of the polarized PC-3 cell. However, we directly tested this possibility by recording on different regions of the polarized PC-3 cells and found that similar sustained MS currents were a feature in all subcellular regions of the PC-3 cell (Fig. 5). As described below, a more likely mechanism relates to the mechanical fragility of the transient gating mode.

Figure 4. A minority (~5%) of PC-3 patches displayed mechanically-fragile, transient MS current behavior. (A) Transient MS currents activated by repetitive 20 mmHg suction pulses in a PC-3 cell patch. (B) The same PC-3 cell patch in which the first suction step of 50 mmHg activated a transient MS current but subsequent pulses activated progressively smaller peak MS currents with increased sustained unitary current activity. (C) A different PC-3 cell patch that initially responded to a train of pulses (1 sec, 40 mmHg at 0–5/s) with biphasic MS currents that displayed an initial fast transient phase followed by a sustained phase. After 30 sec of continued stimulation the transient phase was abolished leaving the sustained phase intact.

Figure 5. Similar sustained MscCa currents can be activated over all regions of polarized PC-3 cells. (A) Photomicrograph of a migrating PC-3 cell showing distinct morphological regions that include the forward protruding lamella/lamellipodium (L), the cell body with the thick nuclear region (CB), and the trailing rear tether (RT). (B) shows cell-attached patch recordings made from each region on different PC-3 cells. Over all regions ~20% of patches were null for MS currents and the mean current amplitudes of active patches for the different regions were L: 23.5 ± 3.58 pA (n = 22); CB: 24.5 ± 2.56 pA (n = 38); and RT: 26.0 ± 3.8173 (n = 22) (patch potential -100 mV, 100 K/0 Ca)
Mechanosensitive currents in LNCaP cells
LNCaP cells, which seal with “gentle” suction protocols, respond at least initially to suction steps with brief transient MS currents. This was the case in basically all the 120 LNCaP cell patches studied. Figure 6A shows the transient MS currents decayed within 200 ms of a 1 sec suction step and were half-activated at ~10 mmHg, saturated at ~30 mmHg, and peaked at ~140 pA. Therefore, compared with PC-3 cell patches, MS currents were larger (80 ± 9 pA, n = 84 vs. 23.4 ± 2.8 pA, n = 54) and more mechanosensitive (1/2-activation suction of 10 vs. 60 mmHg). The LNCaP response to ramp stimulation was also markedly different from the responses seen in PC-3 cell patches. Instead of a progressive increase in current to a saturating level (Fig. 3D), there was an initial brief current activation at the beginning of the ramp that then rapidly declined to zero despite increasing ramp pressure (Fig. 6B). Another notable feature of LNCaP patch responses was how they depended critically on both the duration and amplitude of the pulses applied in a repetitive train (Fig. 6C and D). For example, the application of brief suction pulses (100 ms/80 mmHg applied at 0.5 sec−1) produced current responses that showed no “fading” of their peak amplitude during the pulse train (Fig. 6C). However, if the duration of the pulse in the train was increased (1000 ms/80 mmHg applied at 0.5 sec−1) there was a rapid and irreversible decrease in MS currents, so that by the 8th pulse the MS peak current had decreased by ~90% (Fig. 6D). On the other hand, if the suction pulses in the train were smaller (e.g., 1000 ms/20 mmHg, see Fig. 7) the fading did not occur indicating that both the duration and magnitude of the mechanical stimulus to the patch is required to produce irreversible changes in MscCa gating mode. Considering that the suction protocols used to form seals on PC-3 cells (Fig. 2) involve suctions that exceed in duration and magnitude the suction that causes irreversible loss of transient gating in LNCaP cell patches, it seems reasonable to assume that the small, sustained MS currents recorded from most PC3 cell patches may already reflect a reduced response from that which may occur in a “mechanically-undisturbed” PC-3 cell membrane.

Figure 6. The typical transient MS current behavior recorded in LNCaP cell patches. (A) Increasing suction steps activate transient MS currents that decay to baseline within ~200 ms. A MS current of ~10 pA was activated by a 5 mmHg pulse and the response saturated at ~150 pA with a 40 mmHg pulse (patch potential -100 mV). (B) Ramps of suction applied to an LNCaP cell patch activated a transient current at the beginning of the ramp that declined back to baseline despite increasing suction, later in the ramp there with a reactivation of noisy current that turned off with the ramp. (C) A train of 100 ms pulses activate transient currents that do not decrease in amplitude during the train (i.e., no response fading). (D) the same patch as in (C) in which a train of 1 sec pulses results in a progressive decrease in the peak current response (i.e., fading) and increase in the sustained current. In this train by the 8th pulse the peak current had decreased by 90% from the initial ~150 pA to a small sustained current of ~15 pA. This fading of the current was irreversible in that resting the patch for 3 min did not result in recovery of the initial larger currents (patch potential -100 mV, pipette solution 100 mM K+/0 mM Ca2+).

Figure 7. The mechanical-induced inactivation of MS current seen in LNCaP cells is not strongly voltage dependent and currents show a similar decay time when measured at depolarized or hyperpolarized patch potentials. (A) On the patch held at 75 mV a train of 20 mmHg suction 1 sec pulses activated large, transient MS currents that decayed back to near baseline within 100 ms. (B) The same train of pulses applied to the same patch but held at -25 mV which again result in similar fast decaying currents. In this patch the MS current reversed at ~0 mV which accounts for the different amplitude currents at these potentials; note the different current scales in (A and B). The application of the smaller 20 mmHg pulses did not result in the response fading that occurred with 80 mmHg pulses described for the patch Figure 6D.
Discriminating between stretch-induced adaptation and inactivation
The transient MS currents in response to sustained stimulation could be due to either mechanically-induced resetting of the patch/channel mechanosensitivity (adaptation) or mechanically-induced inactivation.12,15,16 To make this distinction, we compared the responses to different step protocols applied to the same LNCaP cell patch.15 In the first protocol, an initial step of 30 mmHg activated a transient current that decayed to baseline, at which point the suction was stepped up to 60 mmHg (Fig. 8A). However, this step up failed to “reactivate” any increase in current, which is inconsistent with a mechanism in which the channel (or membrane complex) failed to respond because of adaptation/reduced mechanosensitivity. This was confirmed in other patches in which step ups to the near-rupture suctions of ~100 mmHg failed to reactivate significant current (data not shown). In the other type of stimulation protocol (Fig. 8B, same patch as in 8A), the second pulse of 60 mmHg was applied 1 sec after the initial pulse, and in this case an even larger peak current was activated compared with that induced by the first pulse. This increased second response indicates that the initial pulse was below the saturating stimulus and furthermore that the channels that were not activated apparently underwent inactivation without having to open (Fig. 8A). This idea of inactivation without opening is also indicated by the responses to ramp stimuli (Fig. 6B) in which only small transient currents (~5 pA) are activated at the foot of the suction ramp, compared with the large peak currents (~80 pA) that could be activated by suction steps applied to the same patch. The time for recovery from mechanically-induced “inactivation” during the two step protocol may be considered analogous to the recovery time from voltage-induced Na+ current inactivation studied with a two-step voltage protocol. However, unlike Na+ current inactivation, MS current inactivation can show little voltage dependence (Fig. 7).

Figure 8. Stimulation protocols that can distinguish MS channel adaptation (i.e., reduction in mechanosensitivity) from channel inactivation. (A) A step-up protocol in which the initial suction step to 30 mmHg activates a peak MS current of ~60 pA that decays to baseline leaving only residual current activity. A step-up directly from 30 mmHg to 60 mmHg failed to reactivate the large transient current but instead only evoked a low-level, sustained activity (~5 pA). (B) On the same patch as in A, a 30 mmHg pulse activates again a large transient current (~70 pA) with a low level of sustained current, then 1 sec after the first pulse a 60 mmHg pulse was applied and activated an even larger transient current of ~120 pA (100 K+/0 Ca2+ pipette solution, patch potential -100 mV).
Single MscCa conductance and ion selectivity are similar in PC-3 and LNCaP cells
We next asked whether the channels underlying MS currents in PC-3 and LNCaP cells display similar single channel conductance properties. Figure 9A shows unitary currents recorded from a PC-3 cell patch at different patch potentials—the currents reversed at ~0 mV, displayed weak inward rectification and showed a higher frequency of brief, channel closures at hyperpolarized compared with depolarized potentials (Fig. 9A). The single current-voltage data measured from PC-3 and LNCaP cells indicate they have similar unitary conductance (Fig. 9B). Furthermore the channels in both cell types display a similar reduction in conductance when Na+ replaced K+ as the predominant external cation (~42 pS vs. 55 pS, measured at -50 mV with 0 Ca2+) and when 1 mM external Ca2+ was present (20 pS vs. 25 pS). The various features of the single MS channel currents seen in PC cells (i.e., relatively more transient closures and increased frequency of channel openings at hyperpolarized potentials, weak cation selectivity, reversal at ~0 mV, slight inward rectification and Ca2+ permeant block) are also shared by MS cation channels in other cell types.17

Figure 9. Single MS channel currents and current-voltage relations measured in PC cell-attached patches. (A) Suction steps applied to a PC-3 cell-attached patch held at different patch potentials (-100, -50 and 50 mV) activated unitary currents that showed relatively more frequent fast channel closures and re-openings at negative compared with positive potentials. Also at the most hyperpolarized potential there were spontaneous fast inward currents that displayed the same amplitude as the stretch-activated unitary currents. (B) Single-channel current-voltage relations measured on cell-attached PC-3 patches (hollow circles) and LNCaP cell patches (solid circles) measured with 100 K+/ 0 Ca2+ pipette solution. Both single channel currents show the same weak inward rectification indicating the same or closely-related pore structures. Data points based on 20–30 patches for each PC cell type. Estimation of the zero patch potential for the I-V relation was based on the adjusted potential offset at which MS channel currents reversed with high K+ pipette solution. The offset potential was consistent with a resting potential ranging from -30 to -50 mV (uncorrected for liquid junction potential) which was similar to the range measured in the whole cell configuration.
MS channels are functionally coupled to a specific Ca2+-activated K+ channel
In addition to the MS channel inward currents at resting potentials, two outward unitary currents were evident in cell-attached patches on PC cells treated with Ca2+-ionophore to elevate their intracellular [Ca2+]. Figure 10A shows these two outward unitary currents recorded from a PC-3 cell preincubated with 5 μM ionomycin. Figure 10B shows the I-V relations of these channel currents (measured with a Na+ pipette solution) and indicate single channel conductance values at 0 mV of 10 pS (i.e., small or SK channel) and 100 pS (i.e., big or BK channel). Opening of the BK channels also occurred with strong patch depolarization even in the absence of [Ca2+]i elevation, indicating that this channel possesses an intrinsic voltage sensitivity (Fig. 10C and D; 100 mM K+/0 mM Ca2+ in the pipette). In contrast to MscCa, neither K+ channel showed direct stretch sensitivity as long as Ca2+ was absent from the pipette solution (Fig. 10D, and see below).

Figure 10. Both PC-3 and LNCaP cells express big conductance (BK) and small conductance (SK) Ca2+-activated K+ channels. (A) Cell-attached patch current traces recorded from a PC-3 cell that was bathed in 5 μM ionomycin added to normal Krebs. The unitary outward currents were recorded at approx. -10 mV with a pipette solution of 100 Na+/1Ca2+. (B) The unitary current-voltage relations of the BK and SK channels measured in the same patch. (C) A different PC-3 cell-attached patch depolarized to 100 mV expressed large amplitude, brief events that were not stretch sensitive (pipette solution was 100 K+/0 Ca2+ bathed in only normal Krebs (i.e., without ionomycin). (D) The same patch as in (C) except the patch potential was held at -100 mV. The trace shown was specifically selected to include the two types of channel activity—a low frequency (< 0.01 sec−1) random occurrence of brief, large amplitude BK channel currents and MS current that in this case showed a delay in activation of ~200 ms—otherwise BK channel openings were not observed to increase with suction.
In order to test whether Ca2+ influx via MS channels is sufficient to activate SK and/or BK channels under physiological conditions (i.e., with [Ca2+]ex ~1 mM) we recorded currents with a 100 mM Na+/1 mM Ca2+ pipette solution at a patch potential of -10 mV. Under these conditions, Na+ influx via MS cation channels should generate inward current, whereas K+ efflux through the K+-selective channels should generate outward K+ unitary currents of ~1 pA for the SK channel and ~4 pA for the BK channel (see Fig. 10B). Figure 11A shows consecutive current traces recorded from a PC-3 cell patch in which suction pulses activated an initial inward current that was followed by unitary outward currents of ~1 pA (10/10 patches). However, if MS inward currents could not be activated in the patch (i.e., null for MscCa) then outward currents were also not activated (2/2 patches). Furthermore, if the Ca2+ in the pipette was replaced with the Ca2+ chelator, EGTA, only the inward MS currents were activated (10/10 patches). Together, these results indicate that activation of the 1 pA outward unitary current depends upon Ca2+ influx via MscCa. Significantly, no patches showed either direct or delayed “stretch” activation of the 4 pA BK channel currents, even though BK channel current activity could be activated directly by depolarizing the patch potential above +50 mV. In recordings of LNCaP cell patches under the same conditions, similar MscCa- and Ca2+-dependent activation of the ~1 pA outward unitary currents was seen but with even shorter delays compared with PC-3 cells, which would be consistent with the greater Ca2+ influx associated with the larger peak MS currents in LNCaP patches (Fig. 11D). Interestingly, our results of functional coupling between MS channels and SK channels in PC cells are similar to the coupling between voltage-gated L-type Ca2+ channels and SK channels previously reported in hippocampal neurons.18 Several non-exclusive mechanisms may account for the selective functional coupling between these channels, including spatial proximity of the channels, a lower Ca2+ sensitivity of SK vs. BK channels and/or a lesser dependence on Ca2+-induced Ca2+ release from internal Ca2+ stores that may also be compromised within the patch.

Figure 11. MscCa is functionally coupled, via Ca2+ influx, to SK channel activation. (A) Consecutive current traces recorded from a PC-3 cell-attached patch at -10 mV with a pipette solution 100 Na+/1 Ca2+. Under these conditions suction pulses caused initial activation of inward currents followed by a delayed activation of single outward channel unitary currents of ~0.5 pA, significantly the latter outward currents were not activated if Ca2+ was left out of the pipette solution even though the inward currents were typically bigger presumably because of lack of Ca2+ channel block of MscCa (data not shown). According to the I-V shown in Figure 10B, the 0.5 pA outward currents recorded at -10 mV are most consistent with SKchannel activity rather than BK channels that should be ~8 time larger at ~4 pA. Consistent with this idea depolarization of the same patch to ≥ 50 mV activated brief outward unitary currents ≥ 12 pA consistent with BK channel currents. (B) LNCaP cell-attached patch current trace measured under the same recording conditions as in Figure 11 A (i.e., -10 mV 100 Na+/1 Ca2+). In this case the suction pulse activated a transient inward current followed by delayed activation of unitary outward currents of ~0.5 pA, again the inward, but not the outward currents, were activated when Ca2+ was replaced by EGTA in the the pipette solution.
MS channel blockers inhibit PC-3 cell migration
To explore the importance of MS channel activity in PC-3 cell migration, we first tested whether two distinctly different agents recognized for blocking MS channel in other cell types, were also effective blockers of MS channels expressed in prostate tumor cells. When 5 μM Gd3+, a nonspecific MS channel blocker19,20 was included in the pipette solution, MS channel activity was absent from PC-3 and LNCaP cell patches (five patches on each cell type, data not shown). A similar block of MS channel activity was seen with 3 μM GsMTx-4, a specific MS channel blocker.21 Ideally, one would also like to test the same agents on channel activity in excised patches. However, because PC-3 and LNCaP cells adhere weakly to their substrate they resisted the excision of outside-out patches. As an alternative approach, we used a pipette solution exchange method, which involved filling the very tip of the pipette with a solution without GsMTx-4, and then backfilling the pipette with the GsMTx-4 solution. Using this protocol, initial MscCa activity could be recorded immediately after sealing, and this activity progressively diminished over 2–3 min, presumably as GsMTx-4 diffused into the tip (Fig. 12).

Figure 12. MS currents in PC-3 cells are blocked by the tarantula venom peptide GsMTx-4. (A) PC-3 cell-attached patch stimulated with a suction pulse (top trace) approximately 10 sec after forming a tight seal, at this point before the peptide had reached the channel “control” MS channel activity could be measured (100 KCl and 5 Hepes solution in the pipette tip ~300 μm from the orifice). The trace below labeled “GsMTx-4” was recorded 3 min later and indicates that the MS current activity had been abolished presumably as the 3 μM GsmTx4 solution (backfilled into the pipette) equilibrated with the solution in the pipette tip. The slow outward current reflects a diffusion potential current that correlates with the time course of the suction pulse; the fast events may reflect the activity of GsMTx-4 blocked channels. (B) Same patch as in indicating the GsMTx4 blocks the ramp-induced MS current recorded before GsMTx-4 block.
We next tested Gd3+ and GsMTx-4 on PC-3 cell migration that was monitored by both time-lapse video recordings and wound-closure assays. Figure 13A shows selected video frames (30 min apart) of PC-3 cells migrating out from a cluster of eight cells. Figure 13B (left panels) shows representative PC-3 cell trajectories measured for periods of ~100 min before, during, and after exposure to Gd3+ (5 μM) and GsMTx-4 (3 μM). Histograms summarizing results from 10–20 PC-3 cells illustrate the reversible block by Gd3+ and GsMTx-4 (Fig. 13C). In addition to blocking directional migration, both agents also altered the PC-3 cell morphology. In particular PC-3 cells lost their typical polarized appearance with a single prominent ruffled lamellipodium, and instead took on a smooth, flattened “fried egg” appearance. The effect of blocking cell migration was confirmed by wound closure assays—normally migrating PC-3 cells are able to completely close a “wound” (i.e., a 500 μm wide scratch) within 24 h, but in the presence of 3 μM GsMTx-4 there was no evidence of even partial wound closure after 24 h (Fig. S1B)

Figure 13. MS channel blockers, Gd3+ and GsMTx-4, block PC-3 cell migration. (A) Selected video frames taken 30 min apart showing PC-3 cells migrating out of a cluster. (B) Representative trajectories (monitored every 5 min) before, during, and after application of 5 μM Gd3+ (left panel) and 3 μM GsMTx-4 (right panel) to the solution bathing the cells. (C) Histograms based on 25 or more cells (mean ± SEM) showing reversible block of PC-3 cell migration by Gd3+ (left histogram) and GsMTx-4. (right histogram).
[Ca2+]i dynamics in migrating PC cells
To address how MscCa activity might regulate cell migration we measured the spatial and temporal [Ca2+]i dynamics in migrating PC-3 cells in the absence and presence of MscCa blockers. Figure 14 shows selected video frames from time-lapse fluorescence videos of migrating PC-3 cell loaded with fura-2, and indicates that as the migrating PC-3 cell became progressively extended it developed a [Ca2+]i gradient increasing from the front to the rear of the cell (Fig. 14A). This [Ca2+]i gradient was a common trait that developed in over 200 migrating PC-3 cells as their rear portion became extended as a thin tether and the whole cell became stretched. Significantly, when the cells retracted their tether and shortened their overall length, the gradient dissipated and could even reverse if the cell recommenced migrating in the opposite direction (Fig. 14B). Some migrating PC-3 cells (~10%) also exhibited fast [Ca2+]i transients that spread rapidly (≤ 2 min) throughout the cell at an average frequency of 2 ± 0.8 transients/h (range 1–4 transients/h in 15 cells). In some, but not all cases, the transients immediately preceded retraction of the rear tether (see Fig. 14B and C). GsMTx-4, at the same concentration that blocked cell migration (Fig. 13) also prevented or abolished the development of [Ca2+]i gradients and transients in PC-3 cells (e.g., see Fig. 14D). The [Ca2+]i elevations in PC-3 cells were dependent on Ca2+ influx and were blocked with 10 mM BAPTA in the bathing solution (data not shown). A similar block was observed when internal [Ca2+]i stores were depleted with 5 μM thapsigargin (data not shown) indicating a role for Ca2+-induced Ca2+ release from internal stores. A recent study of motile cardiac fibroblasts has also reported short lived (10 ms–4 sec) high [Ca2+]i microdomains (“Ca2+ flickers”) localized to regions of ~5 μm in diameter, and that occur with a relatively higher frequency (~2/s) in the front of the cell.8 However, our recordings of PC-3 cells made under similar conditions8 (see Materials and Methods) failed to resolve similar Ca2+ flickers even within the large flat lamella/lamellipodia characteristic of migrating PC-3 cells. Interestingly, we did observe localized regions of elevated [Ca2+]i associated with membrane protrusive activity in the non-migratory LNCaP cells (Fig. 15).

Figure 14. Intracellular Ca2+ concentration ([Ca2+]i) gradients and Ca2+ transients in migrating PC-3 cells. (A) Selected fluorescence microscopy video frames using Fura-2 to monitor [Ca2+]i changes in a single PC-3 cell as it migrates from left to right. The four panel left to right represent specific frames capture at 0, 70, 140 and 210 min (i.e., the total time the cell was monitored was 3.5 h). As the PC-3 cell extends its lamellipodia and moves toward the right a [Ca2+]i gradient develops within the cell with higher Ca2+ in the rear compared with the front of the cell. The color bar indicates low [Ca2+]i is blue and high [Ca2+]i is red. (B) [Ca2+]i imaging of two PC-3 cell initially migrating in opposite directions and with opposite [Ca2+]i gradients (30 min frame) (arrows). In the next frame (125 min) cell #1 had reversed its migration direction and there is an accompany reversal of [Ca2+]i gradient. The same cell expressed a brief Ca2+ transient (136 min frame) with a total duration less that one frame (i.e., 1 min) and which was followed by retraction of its tether (145 min) and continued cell movement in the different direction (186 min). The original video recording was made over 4.8 h period. (C) Fast Ca2+ transients in a migrating PC-3 cell. Images from left to right show two different PC-3 cells, in which the migrating cell (#1) undergoes [Ca2+]i transients while the stationary cell (#2) does not. For all images a 100X 1.3 NA objective was used. (D) GsMTx-4 reversibly blocked migration and reduced [Ca2+]i elevations in PC-3 cells. Fura-2 fluorescent images of PC-3 cells, before, after 5 min exposure to 3 μM GsmTx-4 solution, and 30 min following the GsmTx-4 solution washout. These images were taken with a 20X 0.75 objective.

Figure 15. LNCaP cells show Ca2+ transients that are blocked by GsMTX-4. (A) [Ca2+]i imaging of an LNCaP cell showing two Ca2+ transients at 20 min and at 22–23 min after beginning the recording. The lower graph is a line scan of [Ca2+]i levels (340/380 ratio) in the same cell showing two bursts of [Ca2+]i transients. (B) Line scan on another LNCaP cell in which 3 μM GsmTx-4 was applied (dashed line), causing a reversible decrease in the [Ca2+]i, as well as blocking the Ca2+ transients. (C) [Ca2+]i imaging of an LNCaP cell where the arrows indicate the fast and reversible formation of protrusions accompanied by transient local [Ca2+]i elevations.
TRPC expression in prostate tumor cells
Because specific members of the canonical transient receptor channel family (TRPC1, 5 and 6) have been implicated in forming MscCa22-26 and reductions in TRPC1 expression have been shown to block cell migration in several cell types,27-32 we measured the endogenous expression of specific TRPCs in PC-3 and LNCaP cells, and tested the effects of changing TRPC expression (i.e., suppression and overexpression) on MscCa activity and PC-3 cell migration. Figure 16 compares the protein expression pattern of TRPC1 (~80 kDa), TRPC3 (~100 kDa), TRPC4 (~110 kDa), TRPC5 (100 kDa) and TRPC6 (120 kDa) in PC-3 and LNCaP cells. The western blot results indicate a higher abundance of TRPC1 and TRPC3 in LNCaP vs. PC3 cells, barely detectable levels of TRPC4 in PC-3 vs LNCaP cells, low levels of TRPC6 and undetectable levels of TRPC5 in both cells (Fig. 16). The higher abundance of specific TRPC proteins in LNCaP vs PC-3 cells indicate the related channel(s) may also be more highly expressed in LNCaP cells. However, western blot analysis does not distinguish between protein expressed in plasma membrane vs internal cell membrane, nor identify the proportion of functionally active channels in the membrane patch.

Figure 16. Protein immunoblot (Western) measurement of expression of specific canonical transient receptor potential (TRPC) family members (TRPC1, 3, 4, 5, and 6) in PC-3 and LNCaP cells. (A) Western blots showing the expression of a ~80 kDa band labeled by an anti-TRPC1 antibody with different loading amounts of PC-3 and LNCaP cell membranes (10, 20 and 40 μg) run in the absence and presence of the TRPC1 antigenic/blocking peptide (+BP). LNCaP cells expressed a significantly higher abundance of the TRPC1 protein compared with PC-3 cells. (B) Westerns blots showing the expression of a ~100 kDa band labeled by an anti-TRPC3 antibody with different amounts of loaded PC-3 and LNCaP cell membrane proteins (10, 20 and 80 μg) in the absence and presence of the TRPC3 antigenic/blocking peptide (+BP). LNCaP cells expressed significantly higher abundance of TRPC3 protein which was clearly detectable with the lowest protein sample (i.e., 10 μg). In comparison, for PC-3 cells TRPC3 was only detectable in the highest protein loaded lane (i.e., 80 μg). (C) Expression of a ~110 kDa band labeled by an anti-TRPC4 antibody. Again, TRPC4 was present in high abundance in LNCaP cells and detectable at 10 μg protein loaded lane but could not be unequivocal as a specific lane in PC-3 cells even at the highest protein loading level (80 μg). (D) Expression of a 100 kDa band labeled by an anti-TRPC5 antibody was detected in Xenopus oocyte membrane (used as a positive control for the TRPC5 antibody) but a similar band was not detected in either PC-3 and LNCaP cell lanes loaded with the same 60 μg protein/lane. (D, right) Western blots showing a 120 kDa band labeled by anti-TRPC6 antibody was weakly but equally expressed in PC-3 and LNCaP cells membranes.
TRPC1 and TRPC3 regulate PC-3 cell morphology and motility
PC-3 cell sublines in which TRPC1 or TRPC3 protein expression were permanently suppressed, as measured by Westerns (Fig. S2), showed significant differences in their morphology and motility compared with the parent PC-3 cell line (Figs. S3 and S4). To begin with the cells failed to develop the polarized morphology characteristic of the parent cell (Fig. S3) and also failed to undergo significant migratory behavior as measured by either wound closure assay (Fig. S4A) or time-lapse video microscopy (data not shown). On the other hand, the cells of the TRPC6-suppressed PC-3 subline were indistinguishable from the untransfected parent cell line in both their morphology and motility (Fig. S4). Therefore, we considered the TRPC6-suppressed PC-3 subline as a good control for nonspecific, off-target effects of siRNA transfection and selection. Interestingly, cells of the PC-3 subline in which TRPC1 (but not TRPC3) was permanently overexpressed (Fig. S2) also failed to develop a polarized morphology and migrate (Fig. S4B). This sensitivity of PC-3 cell morphology and polarization to either down- or upregulation of TRPC1 expression indicates that an optimal level of TRPC expression is required to support directional migration. The observation that MscCa block has similar effects on morphology and migration as TRPC1 (or TRPC3) suppression indicates that Ca2+ signals mediated by a common or multiple types of Ca2+ channels are required for cell polarization and migration. The apparent dialog between Ca2+ channel expression and cell morphology is not unique to Ca2+ channels since overexpression of a K+ selective MS channel, TREK-1, has also been reported to induce morphological changes that involve the formation of filipodia-like structures in neuronal growth cones. However, in this case the changes in morphology can occur independent of the channels ion conductance.33
Changes in TRPC1 or TRPC3 expression do not alter endogenous MscCa currents
The effects of suppression of either TRPC1 or TRPC3 in blocking PC-3 cell migration were similar to the effects of the Gd3+ and GsmTx-4, and these observations alone might suggest the Ca2+ channels they affect are related. However, unlike the MscCa blockers that can abolish MscCa activity in PC-3 cells, neither TRPC1 nor TRPC3 suppression (or TRPC1 overexpression) significantly altered MscCa activity (Fig. 17A and C). Perhaps the most compelling result on this issue was the finding that similar amplitude MS currents could be recorded in PC-3 cell sublines in which TRPC1 protein levels were manipulated in opposite directions over the parent PC-3 cell line (TRPC1 suppressed: 21 ± 2.5 pA vs. TRPC1 overexpressed; 25.3 ± 3.7 pA). A similar lack of effect on MS currents was seen comparing cells in which TRPC3 expression was suppressed or increased (Fig. 17). Finally, because in patch recordings LNCaP cells express significantly larger MS currents than PC-3 cells, LNCaP cells could provide a more sensitive assay for any reduction in the endogenous MscCa currents. However, again neither TRPC1 nor TRPC3 suppression reduced the size of MscCa currents compared with scrambled controls (Fig. 17B and D). These negative results from TRPC manipulations do not support the idea that either TRPC-1 or TRPC-3 is directly involved in forming MscCa in PC cells.

Figure 17. Peak MS currents measured in PC-3 and LNCaP cell sublines in which specific TRPCs had been permanently suppressed or overexpressed are compared with the MS currents measured in the parent cell line (wild type) and the subline transfected with a scrambled RNA. (A) Histogram of MS currents measured in PC-3 cells in wild type and permanently transfected with scrambled RNA and siRNA blocking TRPC1 and TRPC3 expression. There was no significant change in MS currents compared with wild type and scrambled control. MS currents were measured as the peak current in response to an 80 mmHg suction step at -100 mV patch potential with 100 K+/0 Ca2+. The means and SEMs for each condition were PC-3 WT: 23.4 ± 2.82 n = 54; Scrambled-RNA: 19.0 ± 3.56 n = 12; siRNA-TRPC1: 21.4 ± 2.5 n = 35; siRNA-TRPC3: 18.6 ± 1.28 n = 45. (B) Peak MS currents measured in LNCaP parent cell line (WT) and the indicated permanently transfected sublines.
Discussion
Our results indicate that MscCa is expressed in the two most commonly studied human prostate cancer cell lines—PC-3, a highly motile and invasive cell line originally isolated from a patient’s bone metastasis34,35—and LNCaP, a weakly migratory, noninvasive cell line originally isolated from a patient’s lymph node metastasis.36,37 Our results also indicate that distinctly different chemicals, Gd3+ and the peptide GsMTx-4,19-21 block MscCa activity in PC cells and also abolish PC-3 cell migration. These findings are consistent with their actions on migration of other cell types in which Gd3+ blocks locomotion in fish keratocytes,7 mammalian fibroblasts38 and protozoan amoebas,39 and GsMTx-4 blocks directional migration in transformed MDCK-F cells.31 The block of both fibroblastic/mesenchymal and amoeboid modes of migration is significant in relation to the future therapeutic potential of agents targeting MscCa because individual tumor cells can switch between migratory modes and thereby evade the effects of agents that only target activities (e.g., metalloproteases, calpain and integrins) critical for mesenchymal but not for amoeboid modes of migration.40-42
The finding that nonmigratory LNCaP cells also express large MscCa currents indicates that MscCa expression alone cannot confer motility on a cell. There may be several nonexclusive mechanisms for this. For example, in LNCaP cells MscCa may not be expressed at optimal levels, show appropriate subcellular surface distributions, possess appropriate channel properties (e.g., gating or conductance), and/or be functionally coupled to the appropriate downstream Ca2+-sensitive mechanism(s) that support migration. Considering each of these possibilities, our patch studies do indicate that MscCa is relatively evenly distributed over the surface of LNCaP cells and does not show surface polarization over migrating PC-3 cells; MscCa also displays a similar single channel conductance and ion selectivity in both cell types and Ca2+ influx via MscCa activates SKCa2+ channels in PC-3 and LNCaP cells. The MscCa-SK channel coupling may be particularly significant because specific KCa2+ channel blockers have been shown to affect the function of a variety of cell types including prostate tumor cells.43-45
Despite the shared features of MscCa in PC cells, there is also a marked difference in the gating of the channel when recorded from PC-3 compared with LNCaP cell patches—whereas PC-3 cell patches express predominately a sustained MS current in which single MscCa remain open during mechanical stimulation—LNCaP cell patches express rapidly inactivating MS currents in which MscCa close within ~200 ms of a suction step. However, this gating difference, rather than reflecting an intrinsic difference in MscCa, appears to be induced by the stronger mechanical force/suction required to achieve tight seals on the stiffer PC-3 cell membrane. For PC-3 cells, the greater suction likely acts to switch the mechanically-fragile gating mechanism from a transient to a sustained mode. Although this switch, as studied here, appears to be an inadvertent consequence of the patch recording technique, the demonstrated plasticity/flexibility in MscCa gating mode does open up the possibility that a switch might also be induced under other mechanical circumstances, and in these cases have physiological/pathological functional consequences via the potentially profound changes caused in Ca2+ signaling. For example, it has been shown that mechanical force applied to stationary cells or cell fragments can trigger persistent locomotion and this switch requires the presence of external Ca2+.46-49 Furthermore, accumulating evidence indicates that mechanical forces (e.g., compression and fluid shear stresses) that develop within a growing tumor can promote tumor cells to advance to the invasive stage.50 If in one or more of these cases, the applied mechanical forces impact on the MscCa gating mechanism then a switch in gating could contribute to a switch in the cell’s phenotype.
The importance of Ca2+ in regulating cell motility, and more recently in promoting tumor metastasis has also been the focus of attention51-56 Intracellular Ca2+ transients and sustained [Ca2+]i gradients, as reported here in PC-3 cells, have been previously shown to determine the rate of cell locomotion in a wide variety of cell types, as well as regulating neurite extension and steering nerve growth cones.57-61 In a particularly notable study of locomoting amoebae,62 brief, spatially-discrete pulses of [Ca2+]i were detected at the cell front, together with a more sustained elevated [Ca2+]i in the cell rear. By removing external Ca2+, or by adding the Ca2+ channel blocker, La3+, the Ca2+ pulses were abolished along with cell locomotion, but without immediately reducing the elevated rear [Ca2+]I that appeared to be more dependent upon Ca2+ release from internal stores.62 Furthermore, it was shown that gentle mechanical stimulation applied to the cell front could increase the frequency of Ca2+ pulses and induce pseudopod extension toward the stimulating probe.62 These results on a protozoa now seem quite prescient in relation to recent observations made on migrating human fibroblasts in which brief, spatially confined [Ca2+]i pulses (‘Ca2+ flickers’) were observed at highest frequency at the front of the cell, and occurred on top of a background of a sustained [Ca2+]i gradient that increased toward the cell rear.8 Similar, to the amoeba, the Ca2+ flickers were abolished by removal of external Ca2+ or by the addition of Ca2+ channel blockers (Gd3+ and streptomycin), and their frequency was modulated by direct mechanical stimulation applied to the front of the cell.8 Therefore, here we have two markedly different cell types—spanning over a billion years of evolution, and using distinctly different modes of migration (‘amoeboid’ vs ‘mesenchymal’)—that both utilize a mechanosensitive Ca2+ influx pathway that is preferentially activated at the cell front to steer cell migration. At this time it remains unclear whether the apparent absence or inability to resolve similar Ca2+ flickers in the lamellipodia of PC-3 cells reflects a real cell-type specific difference or a resolution problem. Although, similar recording conditions were used in our study (see Materials and Methods), it could be relevant that the Ca2+ flickers resolved in cardiac fibroblasts were enhanced by Ca2+-induced Ca2+ release from IP3-sensitive stores,8 and at least our imaging results of the ER indicate that internal Ca2+ membrane stores are essentially absent in the lamella/lamellipodia of PC-3 cells (Fig. 1).
A key issue for further understanding the role of MscCa in tumor cells depends upon the identification of the membrane protein(s) that form MscCa and the accompanying facility this would provide to genetically manipulate MscCa expression. To date several different membrane proteins have been implicated in forming MscCa, and in some cases the same proteins have been shown to regulate cell migration. First, TRPM7, a member of the transient receptor potential melastatin channel subfamily, has been proposed to form the MscCa mediating Ca2+ flickers in cardiac fibroblasts.8 Support for this proposal are the findings that reduction in TRPM7 expression using siRNA blocked MscCa activity measured by patch clamp and abolished Ca2+ flickers.8 Also reinforcing this idea is an earlier study that had shown that channels believed to be formed by TRPM7 were activated by integrin engagement as well as by directly applied membrane stretch.63 Interestingly, TRPM7 has also been shown to be localized to focal adhesion complexes64 where Ca2+ flickers predominate, and another study using optical tweezers to selectively pull on actin stress fibers were able to ignite Ca2+ flickers at or near focal adhesions.65 In the case of Ca2+ flickers that have been seen in cells undergoing amoeboid type migration,62 presumably the ignition force at the cell front may be generated by hydrostatic pressure via acto-myosin gel contraction, which pushes out and blebs the cell membrane.66,67 Regarding the expression and role or TRPM7 in PC cells, using a commercially-available anti-TRPM7 antibody, we have so far been unable to detect in Westerns the presence of endogenous TRPM7 in either PC-3 or LNCaP cells. Nevertheless, in a preliminary set of experiments (Maroto Kurosky and Hamill) we have transfected cells with an siRNA designed to target TRPM7 and found that the mean peak MS current was reduced (45.5 ± 5.15 pA, n = 33) compared with the MS current measured in scrambled-RNA transfected controls (63.4 ± 8.07 pA, n = 20). However, it is also worth noting that the scrambled-RNA transfection on its own significantly reduced the MS current compared with the MS current measured in the parent/untransfected LNCaP cells studied at the same time (104.3 ± 9.98 pA, n = 21). These results indicate that MS current expression can be very sensitive to nonspecific effects (i.e., of transfection and antibiotic selection) and further point to the critical importance of choosing adequate controls for siRNA experiments.
Specific members of the transient receptor canonical class (TRPCs) have also been proposed to form MscCa22-26 and multiple independent studies have shown that suppression of TRPC1 blocks migration in different cell types.27-32 The present results indicate that suppression of TRPC1 or TRPC3 (but not TRPC6) blocks PC-3 cell migration, as does TRPC1 (but not TRPC3) overexpression. However, our results also indicate that neither suppression nor overexpression of TRPC1 or TRPC3 alters MscCa activity in PC cells, and therefore the effects on PC-3 cell migration must be occurring by mechanisms not directly dependent on MscCa activity. For example, it has been shown that TRPC1 can form a homotetrameric channels in the ER that are activated by agonists coupled to the IP3 signaling cascade.68 In this case, a similar channel mechanism may underlie it’s role in regulating Ca2+ signals important for PC-3 cell migration.
The most recent membrane protein proposed to form MscCa involves members of a novel membrane protein family, named Piezo, which was originally identified as a protein (Fam-38A) induced in senile plaque-associated astrocytes, and also implicated in integrin activation.69 Significantly, the MS channels associated with overexpression of Piezo 1 express a single channel conductance of ~25 pS, similar to the conductance of the MscCa in PC cells when recorded under similar conditions. Furthermore, GsMTx-4 blocks the MS currents associated with Piezo-1 overexpression.70 Piezo homologs are known to be widely expressed in animals, plants and protozoa and Piezo 1 is expressed in human bladder, colon, kidney, lung and skin, tissues which are tissues/cells known to be mechanosensitive and/or express MscCa.17,20 Another family member, Piezo 2, generates a rapidly inactivating MS currents,69 which is similar to the rapidly inactivating MscCa currents recorded in LNCaP cells. It remains to be determined whether Piezo 1 and Piezo 2 are differentially expressed in PC cells and what role(s) they play in regulating cell migration.
Materials and Methods
Cultures
The human PC cell lines PC-3,34 and LNCaP36 were purchased from American Type Culture Collection. All cell lines were cultured in RPMI 1640 medium with 25 mM Hepes and glutamine, 8% FCS, 1 mM Na pyruvate, 4.5 g/L glucose and antibiotics at 37°C in a humidified 95% O2-5% CO2 atmosphere (GIBCO, Life Sciences Technologies)
Patch-clamp recording
Standard cell-attached, patch-clamp recording was used to record single-channel currents.71 A custom-built pressure clamp was used to apply a suction to achieve a tight seal and stimulate the patch after seal formation.72,73 MS channel conductance and single channel current-voltage relations was characterized in four different pipette solutions: (in mM and all at pH 7.4): 100Na+/0Ca2+: 100 NaCl, 2 EGTA (NaOH), 5 Hepes (NaOH); 100K+/0Ca2+: 100 mM KCl, 2 EGTA (KOH) 5 Hepes (KOH); 100Na+/1Ca2+: 100 NaCl, 1 CaCl2, 5 Hepes (NaOH); 100K+/1Ca2+: 100 KCl, 1 CaCl2, 5 Hepes (KOH). The pipette solutions were made hypotonic to facilitate seal formation but did not cause activation of MS channels in the absence of applied suction.71 In some experiments in which a less hypotonic pipette solutions were tested (e.g., 140 mM NaCl) MS channels displayed similar MS gating properties. The standard bath solution contained in mM: 150 NaCl, 2.5 KCl, 2 CaCl2, 1 MgCl2 and 10 Hepes (NaOH) at pH 7.4. In some experiments, Gd3+ or GsMTx-4 (1–5 μM) was added to the pipette solution (100K+/0Ca2+ but with no EGTA added). In order to monitor MscCa activity before exposure to the agents, the pipette tip was filled by capillary action with agent-free pipette solution (~300 μm from the orifice), and then backfilled with the agent-containing solution. Patch currents were filtered at 500 Hz with an 8-pole Bessel filter and digitized at 1 kHz on an IBM clone using pCLAMP (Axon Instruments). Chemicals in general were purchased from Sigma except for GsmTx-4 (Peptides International). Fluorescent agents were purchased from Invitrogen/Molecular Probes.
Videomicroscopy and Ca2+-imaging
Cell migration was monitored at 37°C by time-lapse videomicroscopy using Nomarski optics with an epifluorescent microscope (Nikon). Fura-2 AM (5 μM, 20 min) was loaded for calcium imaging assays. Images were captured at 340 and 380 nm, at 30 sec and/or 1 min intervals. The advantage of ratiometric fura-2 measurements is that they permit the monitoring of free [Ca2+]i independent of uneven dye distribution (e.g., due to changes in cell thickness and/or dye accumulation in organelles). In particular, in Figure 14 the relatively low [Ca2+] seen in the PC-3 cell nucleus ([Ca2+]n) compared with the cytosol ([Ca2+]c) cannot be due to low nuclear dye presence because (i) the raw fluorescence images excited by 340 and 380 nm actually showed higher nuclear fluorescence indicating higher dye presence and (ii) the nucleus provides a relatively large free volume for fura-2 to occupy, which is corrected for by the ratiometric measurements. In this case the low relatively [Ca2+]n may be because the PC-3 cell nuclear environment changes dye properties. Images acquired with Metafluor (Universal Imaging Corp.) and a Photometrics Coolsnap HQ camera (Roper Scientific). Metamorph (Version 6.2, Universal Imaging Corp.) and Excel 2000 (Microsoft Excel) were used for analysis. Conversion of pixels to micrometers was based on a calibrated slide.
Confocal fluorescence
A Zeiss LSM 510 META confocal system configured on an Axiovert 200M inverted microscope (63X 1.4 objective) was used to acquire the images (543 nm excitation, green He/Ne laser) later processed with Metamorph. The distribution of endoplasmic reticulum/internal Ca2+ stores in PC cells was studied by 10 min incubation with 200 nM BODIPY FL-thapsigargin (excitation 488, emission 510–600).
Wound assays
Wound/scratch assays were performed on sub-confluent PC cells (90%) seeded on 35 mm dishes. Three scratches (~500 µm across) per dish were made using a sterile 200 µl pipette tip. As indicated, 3 µM GsMTx-4 or 5 μM Gd3+ were added to the culture and replaced by fresh solution after 24 h. The same procedure was used in controls.
Western blots
Cell lysates collected in cold buffer (mM: 10 Tris, 150 NaCl, 5 EDTA, 1 PMSF; 1M KI, 2.5 μl/ml protease inhibitor cocktail, Sigma, and 1.5% OG) were shaken 15 min at 4°C and centrifuged (14,000 RPM, 4°C, 30 min). The supernatants stored at -80°C, and protein concentrations determined by bicinchonic acid assay (BIO-RAD). Samples were resolved in an 8% SDS/PAGE gel, transferred to a PVDF membrane, and developed by ECL. Blots were incubated overnight with the primary antibody in the cold room. Polyclonal antibodies (Ab) generated against TRPC1, TRPC3, TRPC4, TRPC5 and TRPC6 were purchased from Alomone; a polyclonal Ab generated against TRPM7 was purchased from Abcam. We also generated an anti-TRPC1 Ab against the T1e3 epitope (CVGIFCEQQSNDTFHSFIGT) that lies between the S5 and S6 membrane spanning domains, the proposed pore region of the channel.74,75 The reactivity of the anti-TRPC1 Ab to the 80 kDa protein was identical to that of a commercial anti-TRPC1 Ab raised against the peptide QLYDK GYTSK EQKDC (amino acid residues 557–571 intracellular terminus of hTRPC1, accession# P48995, lot# AN-02 Alomone Labs). For Westerns, the specificity of each Ab was tested with the antigenic (control) peptides.
TRPC and TRPM7 suppression by siRNA
To generate PC-3 and LNCaP cells sublines in which specific TRPCs were permanently suppressed, short hairpin RNA (shRNA) constructs were purchased from Genscript designed to target TRPC1, TRPC3 or TRPC6. In addition we transfected cells with a scrambled RNA control to allow for transfection and off-target effects on PC cell MS currents. Transfection was performed using Fugene HD transfection reagent according to the manufacture instructions Roche. In brief, 0.25 ug of each plasmid diluted in low serum medium (Optimem, Gibco) and mixed with the transfection reagent, was incubated at RT for 15–20 min and added to subconfluent cultures in 24 wells. Antibiotic selection started immediately after splitting the cells. Dilutions of 1:15 were performed in the presence of the respective antibiotic for each plasmid shRNA-TRPC1/neomycin(G418) (800 ug/ml), shRNA-TRPC3/ hygromycin (200 ug/ml) or shTRPC6/puromycin (2 ug/ml.). Selected clones were expanded into cell lines and maintained using half of the initial antibiotic concentration. Suppression of selected TRPCs was confirmed by western blots. A shRNA construct targeting TRPM7 was also purchased from Genscript and transfection and antibiotic selection of TRPM7-suppressed LNCaP cells was performed using the above procedures. However, in the case of TRPM7, the polyclonal Ab targeting this protein (Abcam) could not resolve this protein in either PC-3 or LNCaP parent cells.
Overexpression of TRPCs
The human cDNAs for TRPC1 and TRPC3 (provided by Dr. Craig Montell) and TRPC6 (provided by Dr. Adrian Wolstenholme) were incorporated into the vector, pXOOM.76 Cell transfection was as described above using the antibiotic gentamicin for clone selection. Selected PC3 TRPC1-, TRPC3- and TRPC6-XOOM clones were tested for protein overexpression using western blots. Because our migration assays (wound closure and time lapse) results indicate that TRPC1-XOOM PC-3 cell line fail to migrate, unlike previous studies that found TRPC1 overexpression increases migration in other cells types, we verified the inhibitory result with different PC-3 cell sublines transfected with two other TRPC1 constructs TREx-His TRPC1 and TRPC1-YC6.1 (Invitrogen).
Conclusions
MscCa—which is typically measured in patch clamp experiments on millisecond time scales and traditionally thought to function in rapid sensory/transduction events—can also perform as a versatile mediator of Ca2+ signals that regulate migratory events that span time scale of seconds to several hours.5 MscCa appears to achieve this feat by performing in at least three distinct Ca2+ signaling roles:
(1) As a short range, brief, stochastic signal (i.e., Ca2+ flickers) that can promote activation of high threshold Ca2+-sensitive mechanisms important for the regulation of protrusive forces and/or transmission of traction forces at discrete sites mainly at the cell’s leading edge.8
(2) As a long-term global signal (i.e., generating and maintaining [Ca2+]i gradients) that can act to promote cell polarization and directional movement by maintain differential localization of Ca2+-sensitive activities at the front and rear of the cell.51
(3) As a conveyor signal (Ca2+ waves) that can transmit information across the cell to coordinate Ca2+-sensitive protrusive mechanisms with Ca2+-sensitive retraction mechanisms.7
The future challenge will be to understand how these different MscCa-mediated Ca2+ signals interact in terms of their initiation, amplification and propagation, and how each signal coordinates the various biochemical signaling pathways to regulate cell migration and chemotaxis. Finally, the exact roles played by the different membrane channel proteins, TRPM7 TRPCs and Piezos, in mediating these multiple interacting Ca2+ signals needs to be resolved.
Supplementary Material
Acknowledgments
We thank the Dr Leoncio Vergara of the UTMB optical imaging laboratory and Dr Bo Xu for preparing the TRPC1 Ab. This project was supported by grant PC030021 from the USAMRMC (Prostate Cancer Research Program) and grant CA106629 from the National Cancer Institute.
Glossary
Abbreviations:
- ECM
extracellular matrix
- CSK
cytoskeleton
- GsMTx-4
Grammostola venom peptide-4
- MscCa
mechanosensitive permeable cation channel
- PC
prostate cancer
- TRPC
transient receptor potential canonical channel
Disclosure of Potential Conflicts of Interest
No potential conflicts of interest were disclosed.
Supplemental Material
Supplemental materials may be found here: www.landesbioscience.com/journals/channels/article/21063
Footnotes
Previously published online: www.landesbioscience.com/journals/channels/article/21063
References
- 1.Pienta KJ, Loberg R. The “emigration, migration, and immigration”of prostate cancer. Clin Prostate Cancer. 2005;4:24–30. doi: 10.3816/cgc.2005.n.008. [DOI] [PubMed] [Google Scholar]
- 2.Chambers AF, Groom AC, MacDonald IC. Dissemination and growth of cancer cells in metastatic sites. Nat Rev Cancer. 2002;2:563–72. doi: 10.1038/nrc865. [DOI] [PubMed] [Google Scholar]
- 3.Kassis J, Lauffenburger DA, Turner T, Wells A. Tumor invasion as dysregulated cell motility. Semin Cancer Biol. 2001;11:105–17. doi: 10.1006/scbi.2000.0362. [DOI] [PubMed] [Google Scholar]
- 4.Lauffenburger DA, Horwitz AF. Cell migration: a physically integrated molecular process. Cell. 1996;84:359–69. doi: 10.1016/S0092-8674(00)81280-5. [DOI] [PubMed] [Google Scholar]
- 5.Sheetz MP, Felsenfeld D, Galbraith CG, Choquet D. Cell migration as a five-step cycle. Biochem Soc Symp. 1999;65:233–43. [PubMed] [Google Scholar]
- 6.Ridley AJ, Schwartz MA, Burridge K, Firtel RA, Ginsberg MH, Borisy G, et al. Cell migration: integrating signals from front to back. Science. 2003;302:1704–9. doi: 10.1126/science.1092053. [DOI] [PubMed] [Google Scholar]
- 7.Lee J, Ishihara A, Oxford G, Johnson B, Jacobson K. Regulation of cell movement is mediated by stretch-activated calcium channels. Nature. 1999;400:382–6. doi: 10.1038/22578. [DOI] [PubMed] [Google Scholar]
- 8.Wei C, Wang X, Chen M, Ouyang K, Song LS, Cheng H. Calcium flickers steer cell migration. Nature. 2009;457:901–5. doi: 10.1038/nature07577. [DOI] [PMC free article] [PubMed] [Google Scholar]
- 9.Gerasimenko OV, Gerasimenko JV, Rizzuto RR, Treiman M, Tepikin AV, Petersen OH. The distribution of the endoplasmic reticulum in living pancreatic acinar cells. Cell Calcium. 2002;32:261–8. doi: 10.1016/S0143416002001938. [DOI] [PubMed] [Google Scholar]
- 10.Abercrombie M, Heaysman JEM, Pegrum SM. The locomotion of fibroblasts in culture. IV. Electron microscopy of the leading lamella. Exp Cell Res. 1971;67:359–67. doi: 10.1016/0014-4827(71)90420-4. [DOI] [PubMed] [Google Scholar]
- 11.Faria EC, Ma N, Gazi E, Gardner P, Brown M, Clarke NW, et al. Measurement of elastic properties of prostate cancer cells using AFM. Analyst. 2008;133:1498–500. doi: 10.1039/b803355b. [DOI] [PubMed] [Google Scholar]
- 12.Hamill OP, McBride DW., Jr. Rapid adaptation of single mechanosensitive channels in Xenopus oocytes. Proc Natl Acad Sci U S A. 1992;89:7462–6. doi: 10.1073/pnas.89.16.7462. [DOI] [PMC free article] [PubMed] [Google Scholar]
- 13.Small DL, Morris CE. Delayed activation of single mechanosensitive channels in Lymnaea neurons. Am J Physiol. 1994;267:C598–606. doi: 10.1152/ajpcell.1994.267.2.C598. [DOI] [PubMed] [Google Scholar]
- 14.Hamill OP, McBride DW., Jr. Induced membrane hypo/hyper-mechanosensitivity: a limitation of patch-clamp recording. Annu Rev Physiol. 1997;59:621–31. doi: 10.1146/annurev.physiol.59.1.621. [DOI] [PubMed] [Google Scholar]
- 15.Hamill OP, McBride DW., Jr. Molecular mechanisms of mechanoreceptor adaptation. News Physiol Sci. 1994;9:53–9. [Google Scholar]
- 16.Honoré E, Patel AJ, Chemin J, Suchyna T, Sachs F. Desensitization of mechano-gated K2P channels. Proc Natl Acad Sci U S A. 2006;103:6859–64. doi: 10.1073/pnas.0600463103. [DOI] [PMC free article] [PubMed] [Google Scholar]
- 17.Hamill OP, Martinac B. Molecular basis of mechanotransduction in living cells. Physiol Rev. 2001;81:685–740. doi: 10.1152/physrev.2001.81.2.685. [DOI] [PubMed] [Google Scholar]
- 18.Marrion NV, Tavalin SJ. Selective activation of Ca2+-activated K+ channels by colocalized Ca2+ channels in hippocampal neurons. Nature. 1998;395:900–5. doi: 10.1038/27674. [DOI] [PubMed] [Google Scholar]
- 19.Yang XC, Sachs F. Block of stretch-activated ion channels in Xenopus oocytes by gadolinium and calcium ions. Science. 1989;243:1068–71. doi: 10.1126/science.2466333. [DOI] [PubMed] [Google Scholar]
- 20.Hamill OP, McBride DW., Jr. The pharmacology of mechanogated membrane ion channels. Pharmacol Rev. 1996;48:231–52. [PubMed] [Google Scholar]
- 21.Suchyna TM, Tape SE, Koeppe RE, 2nd, Andersen OS, Sachs F, Gottlieb PA. Bilayer-dependent inhibition of mechanosensitive channels by neuroactive peptide enantiomers. Nature. 2004;430:235–40. doi: 10.1038/nature02743. [DOI] [PubMed] [Google Scholar]
- 22.Maroto R, Raso A, Wood TG, Kurosky A, Martinac B, Hamill OP. TRPC1 forms the stretch-activated cation channel in vertebrate cells. Nat Cell Biol. 2005;7:179–85. doi: 10.1038/ncb1218. [DOI] [PubMed] [Google Scholar]
- 23.Hamill OP, Maroto R. TRPC family of ion channels and mechanotransduction. In Martinac B, ed. Sensing with Ion channels. Berlin: Springer-Verlag, 2008:121-160. [Google Scholar]
- 24.Gottlieb P, Folgering J, Maroto R, Raso A, Wood TG, Kurosky A, et al. Revisiting TRPC1 and TRPC6 mechanosensitivity. Pflugers Arch. 2008;455:1097–103. doi: 10.1007/s00424-007-0359-3. [DOI] [PubMed] [Google Scholar]
- 25.Spassova MA, Hewavitharana T, Xu W, Soboloff J, Gill DL. A common mechanism underlies stretch activation and receptor activation of TRPC6 channels. Proc Natl Acad Sci U S A. 2006;103:16586–91. doi: 10.1073/pnas.0606894103. [DOI] [PMC free article] [PubMed] [Google Scholar]
- 26.Gomis A, Soriano S, Belmonte C, Viana F. Hypoosmotic- and pressure-induced membrane stretch activate TRPC5 channels. J Physiol. 2008;586:5633–49. doi: 10.1113/jphysiol.2008.161257. [DOI] [PMC free article] [PubMed] [Google Scholar]
- 27.Huang JB, Kindzelskii AL, Clark AJ, Petty HR. Identification of channels promoting calcium spikes and waves in HT1080 tumor cells: their apparent roles in cell motility and invasion. Cancer Res. 2004;64:2482–9. doi: 10.1158/0008-5472.CAN-03-3501. [DOI] [PubMed] [Google Scholar]
- 28.Rao JN, Platoshyn O, Golovina VA, Liu L, Zou T, Marasa BS, et al. TRPC1 functions as a store-operated Ca2+ channel in intestinal epithelial cells and regulates early mucosal restitution after wounding. Am J Physiol Gastrointest Liver Physiol. 2006;290:G782–92. doi: 10.1152/ajpgi.00441.2005. [DOI] [PubMed] [Google Scholar]
- 29.Maroto R, Hamill OP. MscCa regulation of tumor cell migration and metastasis. Curr. Tops Membr. 2007;59:485–409. doi: 10.1016/S1063-5823(06)59019-2. [DOI] [PubMed] [Google Scholar]
- 30.Louis M, Zanou N. Van Schoor, M., and Gailly, P. TRPC1 regulates myoblast migration and differentiation. J Cell Sci. 2008;121:3951–9. doi: 10.1242/jcs.037218. [DOI] [PubMed] [Google Scholar]
- 31.Fabian A, Fortmann T, Dieterich P, Riethmüller C, Schön P, Mally S, et al. TRPC1 channels regulate directionality of migrating cells. Pflugers Arch. 2008;457:475–84. doi: 10.1007/s00424-008-0515-4. [DOI] [PubMed] [Google Scholar]
- 32.Bomben VC, Turner KL, Barclay TT, Sontheimer H. Transient receptor potential canonical channels are essential for chemotactic migration of human malignant gliomas. J Cell Physiol. 2011;226:1879–88. doi: 10.1002/jcp.22518. [DOI] [PMC free article] [PubMed] [Google Scholar]
- 33.Lauritzen I, Chemin J, Honoré E, Jodar M, Guy N, Lazdunski M, et al. Cross-talk between the mechano-gated K2P channel TREK-1 and the actin cytoskeleton. EMBO Rep. 2005;6:642–8. doi: 10.1038/sj.embor.7400449. [DOI] [PMC free article] [PubMed] [Google Scholar]
- 34.Kaighn ME, Narayan KS, Ohnuki Y, Lechner JF, Jones LW. Establishment and characterization of a human prostatic carcinoma cell line (PC-3) Invest Urol. 1979;17:16–23. [PubMed] [Google Scholar]
- 35.Yang M, Jiang P, Sun FX, Hasegawa S, Baranov E, Chishima T, et al. A fluorescent orthotopic bone metastasis model of human prostate cancer. Cancer Res. 1999;59:781–6. [PubMed] [Google Scholar]
- 36.Horoszewicz JS, Leong SS, Kawinski E, Karr JP, Rosenthal H, Chu TM, et al. LNCaP model of human prostatic carcinoma. Cancer Res. 1983;43:1809–18. [PubMed] [Google Scholar]
- 37.Fisher JL, Schmitt JF, Howard ML, Mackie PS, Choong PFM, Risbridger GP. An in vivo model of prostate carcinoma growth and invasion in bone. Cell Tissue Res. 2002;307:337–45. doi: 10.1007/s00441-001-0503-x. [DOI] [PubMed] [Google Scholar]
- 38.Munevar S, Wang YL, Dembo M. Regulation of mechanical interactions between fibroblasts and the substratum by stretch-activated Ca2+ entry. J Cell Sci. 2004;117:85–92. doi: 10.1242/jcs.00795. [DOI] [PubMed] [Google Scholar]
- 39.Lombardi ML, Knecht DA, Lee J. Mechano-chemical signaling maintains the rapid movement of Dictyostelium cells. Exp Cell Res. 2008;314:1850–9. doi: 10.1016/j.yexcr.2008.02.001. [DOI] [PubMed] [Google Scholar]
- 40.Sahai E, Marshall CJ. Differing modes of tumour cell invasion have distinct requirements for Rho/ROCK signalling and extracellular proteolysis. Nat Cell Biol. 2003;5:711–9. doi: 10.1038/ncb1019. [DOI] [PubMed] [Google Scholar]
- 41.Wolf K, Friedl P. Molecular mechanisms of cancer cell invasion and plasticity. Br J Dermatol. 2006;154(Suppl 1):11–5. doi: 10.1111/j.1365-2133.2006.07231.x. [DOI] [PubMed] [Google Scholar]
- 42.Carragher NO, Walker SM, Scott Carragher LA, Harris F, Sawyer TK, Brunton VG, et al. Calpain 2 and Src dependence distinguishes mesenchymal and amoeboid modes of tumour cell invasion: a link to integrin function. Oncogene. 2006;25:5726–40. doi: 10.1038/sj.onc.1209582. [DOI] [PubMed] [Google Scholar]
- 43.Parihar AS, Coghlan MJ, Gopalakrishnan M, Shieh CC. Effects of intermediate-conductance Ca2+-activated K+ channel modulators on human prostate cancer cell proliferation. Eur J Pharmacol. 2003;471:157–64. doi: 10.1016/S0014-2999(03)01825-9. [DOI] [PubMed] [Google Scholar]
- 44.Kessler W, Budde T, Gekle M, Fabian A, Schwab A. Activation of cell migration with fibroblast growth factor-2 requires calcium-sensitive potassium channels. Pflugers Arch. 2008;456:813–23. doi: 10.1007/s00424-008-0452-2. [DOI] [PubMed] [Google Scholar]
- 45.Wulff H, Kolski-Andreaco A, Sankaranarayanan A, Sabatier JM, Shakkottai V. Modulators of small- and intermediate-conductance calcium-activated potassium channels and their therapeutic indications. Curr Med Chem. 2007;14:1437–57. doi: 10.2174/092986707780831186. [DOI] [PubMed] [Google Scholar]
- 46.Verkhovsky AB, Svitkina TM, Borisy GG. Self-polarization and directional motility of cytoplasm. Curr Biol. 1999;9:11–20. doi: 10.1016/S0960-9822(99)80042-6. [DOI] [PubMed] [Google Scholar]
- 47.Isshiki M, Ando J, Yamamoto K, Fujita T, Ying Y, Anderson RG. Sites of Ca(2+) wave initiation move with caveolae to the trailing edge of migrating cells. J Cell Sci. 2002;115:475–84. doi: 10.1242/jcs.115.3.475. [DOI] [PubMed] [Google Scholar]
- 48.Décave E, Rieu D, Dalous J, Fache S, Brechet Y, Fourcade B, et al. Shear flow-induced motility of Dictyostelium discoideum cells on solid substrate. J Cell Sci. 2003;116:4331–43. doi: 10.1242/jcs.00726. [DOI] [PubMed] [Google Scholar]
- 49.Fache S, Dalous J, Engelund M, Hansen C, Chamaraux F, Fourcade B, et al. Calcium mobilization stimulates Dictyostelium discoideum shear-flow-induced cell motility. J Cell Sci. 2005;118:3445–57. doi: 10.1242/jcs.02461. [DOI] [PubMed] [Google Scholar]
- 50.Butcher DT, Alliston T, Weaver VM. A tense situation: forcing tumour progression. Nat Rev Cancer. 2009;9:108–22. doi: 10.1038/nrc2544. [DOI] [PMC free article] [PubMed] [Google Scholar]
- 51.Brundage RA, Fogarty KE, Tuft RA, Fay FS. Calcium gradients underlying polarization and chemotaxis of eosinophils. Science. 1991;254:703–6. doi: 10.1126/science.1948048. [DOI] [PubMed] [Google Scholar]
- 52.Doyle A, Marganski W, Lee J. Calcium transients induce spatially coordinated increases in traction force during the movement of fish keratocytes. J Cell Sci. 2004;117:2203–14. doi: 10.1242/jcs.01087. [DOI] [PubMed] [Google Scholar]
- 53.Nebl T, Fisher PR. Intracellular Ca2+ signals in Dictyostelium chemotaxis are mediated exclusively by Ca2+ influx. J Cell Sci. 1997;110:2845–53. doi: 10.1242/jcs.110.22.2845. [DOI] [PubMed] [Google Scholar]
- 54.Schwab A, Finsterwalder F, Kersting U, Danker T, Oberleithner H. Intracellular Ca2+ distribution in migrating transformed epithelial cells. Pflugers Arch. 1997;434:70–6. doi: 10.1007/s004240050364. [DOI] [PubMed] [Google Scholar]
- 55.Giannone G, Rondé P, Gaire M, Haiech J, Takeda K. Calcium oscillations trigger focal adhesion disassembly in human U87 astrocytoma cells. J Biol Chem. 2002;277:26364–71. doi: 10.1074/jbc.M203952200. [DOI] [PubMed] [Google Scholar]
- 56.Prevarskaya N, Skryma R, Shuba Y. Calcium in tumour metastasis: new roles for known actors. Nat Rev Cancer. 2011;11:609–18. doi: 10.1038/nrc3105. [DOI] [PubMed] [Google Scholar]
- 57.Calabrese B, Manzi S, Pellegrini M, Pellegrino M. Stretch-activated cation channels of leech neurons: characterization and role in neurite outgrowth. Eur J Neurosci. 1999;11:2275–84. doi: 10.1046/j.1460-9568.1999.00648.x. [DOI] [PubMed] [Google Scholar]
- 58.Gomez TM, Robles E, Poo M, Spitzer NC. Filopodial calcium transients promote substrate-dependent growth cone turning. Science. 2001;291:1983–7. doi: 10.1126/science.1056490. [DOI] [PubMed] [Google Scholar]
- 59.Jacques-Fricke BT, Seow YQ, Gottlieb PA, Sachs F, Gomez TM. Ca2+ influx through mechanosensitive channels inhibits neurite outgrowth in opposition to other influx pathways and release from intracellular stores. J Neurosci. 2006;26:5656–64. doi: 10.1523/JNEUROSCI.0675-06.2006. [DOI] [PMC free article] [PubMed] [Google Scholar]
- 60.Pellegrino M, Pelligrini M. Mechanosensitive channels in neurite outgrowth. Current Topics in Membranes. 2007; 59: 112-127. [DOI] [PubMed] [Google Scholar]
- 61.Gottlieb PA, Barone T, Sachs F, Plunkett R. Neurite outgrowth from PC12 cells is enhanced by an inhibitor of mechanical channels. Neurosci Lett. 2010;481:115–9. doi: 10.1016/j.neulet.2010.06.066. [DOI] [PMC free article] [PubMed] [Google Scholar]
- 62.Taylor DL, Blinks JR, Reynolds G. Contractile basis of ameboid movement. VII. Aequorin luminescence during ameboid movement, endocytosis, and capping. J Cell Biol. 1980;86:599–607. doi: 10.1083/jcb.86.2.599. [DOI] [PMC free article] [PubMed] [Google Scholar]
- 63.Numata T, Shimizu T, Okada Y. TRPM7 is a stretch- and swelling-activated cation channel involved in volume regulation in human epithelial cells. Am J Physiol Cell Physiol. 2007;292:C460–7. doi: 10.1152/ajpcell.00367.2006. [DOI] [PubMed] [Google Scholar]
- 64.Su LT, Agapito MA, Li M, Simonson WT, Huttenlocher A, Habas R, et al. TRPM7 regulates cell adhesion by controlling the calcium-dependent protease calpain. J Biol Chem. 2006;281:11260–70. doi: 10.1074/jbc.M512885200. [DOI] [PMC free article] [PubMed] [Google Scholar]
- 65.Hayakawa K, Tatsumi H, Sokabe M. Actin stress fibers transmit and focus force to activate mechanosensitive channels. J Cell Sci. 2008;121:496–503. doi: 10.1242/jcs.022053. [DOI] [PubMed] [Google Scholar]
- 66.Yanai M, Kenyon CM, Butler JP, Macklem PT, Kelly SM. Intracellular pressure is a motive force for cell motion in Amoeba proteus. Cell Motil Cytoskeleton. 1996;33:22–9. doi: 10.1002/(SICI)1097-0169(1996)33:1<22::AID-CM3>3.0.CO;2-K. [DOI] [PubMed] [Google Scholar]
- 67.Blaser H, Reichman-Fried M, Castanon I, Dumstrei K, Marlow FL, Kawakami K, et al. Migration of zebrafish primordial germ cells: a role for myosin contraction and cytoplasmic flow. Dev Cell. 2006;11:613–27. doi: 10.1016/j.devcel.2006.09.023. [DOI] [PubMed] [Google Scholar]
- 68.Alfonso S, Benito O, Alicia S, Angélica Z, Patricia G, Diana K, et al. Regulation of the cellular localization and function of human transient receptor potential channel 1 by other members of the TRPC family. Cell Calcium. 2008;43:375–87. doi: 10.1016/j.ceca.2007.07.004. [DOI] [PubMed] [Google Scholar]
- 69.Coste B, Mathur J, Schmidt M, Earley TJ, Ranade S, Petrus MJ, et al. Piezo1 and Piezo2 are essential components of distinct mechanically activated cation channels. Science. 2010;330:55–60. doi: 10.1126/science.1193270. [DOI] [PMC free article] [PubMed] [Google Scholar]
- 70.Bae C, Sachs F, Gottlieb PA. The mechanosensitive ion channel Piezo1 is inhibited by the peptide GsMTx4. Biochemistry. 2011;50:6295–300. doi: 10.1021/bi200770q. [DOI] [PMC free article] [PubMed] [Google Scholar]
- 71.Hamill OP, Marty A, Neher E, Sakmann B, Sigworth F. Improved patch clamp techniques for high current resolution from cells and cell-free membrane patches. Pflugers Arch. 1981;391:85–100. doi: 10.1007/BF00656997. [DOI] [PubMed] [Google Scholar]
- 72.McBride DW, Jr., Hamill OP. Pressure-clamp: a method for rapid step perturbation of mechanosensitive channels. Pflugers Arch. 1992;421:606–12. doi: 10.1007/BF00375058. [DOI] [PubMed] [Google Scholar]
- 73.Hamill OP, McBride DW Jr. Pressure/patch-clamp methods. In: Boulton AA, Baker GB, Walz W, eds, Patch Clamp Techniques and Protocols. New Jersey: Humana Press, 1995: 75-87. [Google Scholar]
- 74.Wes PD, Chevesich J, Jeromin A, Rosenberg C, Stetten G, Montell C. TRPC1, a human homolog of a Drosophila store-operated channel. Proc Natl Acad Sci U S A. 1995;92:9652–6. doi: 10.1073/pnas.92.21.9652. [DOI] [PMC free article] [PubMed] [Google Scholar]
- 75.Xu SZ, Beech DJ. TrpC1 is a membrane-spanning subunit of store-operated Ca(2+) channels in native vascular smooth muscle cells. Circ Res. 2001;88:84–7. doi: 10.1161/01.RES.88.1.84. [DOI] [PubMed] [Google Scholar]
- 76.Jespersen T, Grunnet M, Angelo K, Klaerke DA, Olesen SP. Dual-function vector for protein expression in both mammalian cells and Xenopus laevis oocytes. Biotechniques. 2002;32:536–8, 540. doi: 10.2144/02323st05. [DOI] [PubMed] [Google Scholar]
Associated Data
This section collects any data citations, data availability statements, or supplementary materials included in this article.