

Abstract
We investigated and compared three approaches for shotgun protein identification by combining MS and MS/MS information using LTQ-Orbitrap high mass accuracy data. In the first approach, we employed a unique mass identifier method where MS peaks matched to proteins identified from an MS/MS database search are first subtracted before the MS peaks are used as unique mass identifiers for protein identification. In the second method, we used an accurate mass and time tag method by building a potential mass and retention time database from previous MudPIT analyses. For the third method, we used a peptide mass fingerprinting-like approach in combination with a randomized database for protein identification. We show that we can improve protein identification sensitivity of low abundance proteins by combining MS and MS/MS information. Furthermore, “one-hit wonders” from MS/MS database searching can be further substantiated by MS information and the approach improves the identification of low abundance proteins. The advantages and disvantages for the three approaches are then discussed.
Keywords: Mass spectrometry, tandem mass spectrometry, MudPIT, LTQ-Orbitrap, one-hit wonders, accurate mass and time tag, decoy databases
Introduction
Shotgun proteomics refers to the global analysis of the digested products of protein mixtures such as tissues, cells, or protein complexes1,2. Multi-dimensional protein identification technology is a popular approach for shotgun proteomic as it combines high resolution separation with tandem mass spectrometry (MS/MS)3,4. In general, protein mixtures resulting are proteolytically reduced to peptides. Peptide separation by multidimensional high pressure liquid chromatography is directly coupled to a tandem mass spectrometer followed by database searching using a computer algorithm such as SEQUEST5, Mascot6, or OMSSA7. This approach has become a powerful method for identifying and quantifying proteins8–11.
One inherent disadvantage to the shotgun protein identification method outlined above is the dependency on the acquisition of tandem mass spectra. For current technologies, it is still impossible to perform tandem mass spectrometry on every single ion in a chromatographic window with a +/− 3 amu precursor isolation window, although the current generation of tandem mass spectrometers has increased acquisition of MS/MS by a factor of 5–10. This limitation leads to undersampling of complex peptide mixtures and thus usually one needs to perform multiple MudPIT analyses to increase acquisition of measurable peptide species12,13. It would be desirable to utilize data from the first round of mass spectrometry (MS1 or simply MS) to supplement protein identification and this usually requires high mass accuracy mass spectrometers.
One type of instrument that has high mass accuracy capability is the Fourier transform ion cyclotron resonance mass spectrometer (FT-ICR-MS). FT-ICR-MS has the ability to measure peptide masses at low ppm levels14. This creates the possibility of using the mass of a single peptide as a unique identifier for protein identification provided that the mass of the amino acid composition of the peptide is unique in a database. By using this concept, Smith and colleagues have developed and refined an accurate mass tag (and later accurate mass and time tag, AMT) approach for MS-based high throughput proteomics study using FT-ICR-MS14–17. Strittmatter et al.18 also experimented with the use of LC Time-of-fight (TOF) MS for AMT tag protein identification, since current TOF instrument can provide resolutions of larger than 10,000 and 2–5 ppm mass accuracies. For the AMT approach developed by Smith and colleagues using either FT-ICR-MS or TOF-MS, the protein identifications are obtained from MS information. Recently, an attempt was made to apply AMT to the more recent hybrid instruments such as the LTQ-FT or LTQ-Orbitrap19.
Another common MS-based method for protein identification is peptide mass fingerprinting (PMF)20–23. This method is most commonly applied to purified or highly enriched proteins often isolated by 2-dimensional gel electrophoresis. PMF is most effective when attempting to identify single proteins but an iterative approach has been used to improve the identification of single mixtures of proteins24,25. PMF has also been combined with 2-Dimensional chromatography of intact proteins in studies of cell lysates26. Giddings et al developed an interesting variation of PMF to identify Open Reading Frames (ORFs) in bacterial genomes27. Statistical or probability based approaches for PMF analysis help to assess the quality of matches but no PMF approaches have attempted to assess the false discovery rate associated with analysis21, 27–29.
The linear ion trap-Orbitrap is a hybrid Fourier Transform mass spectrometer that combines the efficiency and sensitivity of the linear ion trap with the high mass accuracy and high resolution of the Orbitrap mass analyzer30,31. The LTQ-Orbitrap has been shown to be able to routinely achieve sub 5-ppm mass accuracy at a dynamic range of more than 500032 and thus should be suitable for a protein identification approach using the accurate mass and time tags.
Here we investigated and compared three methods for shotgun protein identification by combining MS and MS/MS information using LTQ-Orbitrap high mass accuracy data. The intent was to extend the amount of information that could be obtained from a MudPIT type of experiment and provide additional supporting information from MS/MS based “one hit wonders”. In the first approach, we employed a unique mass identifier method where orphaned m/z values (no MS/MS for the m/z value) were matched to sequences in a database after the proteins identified by MS/MS were removed from the database. In the second approach, we used an accurate mass and time tag method by building a potential mass and time tag database from previous MudPIT analyses. The third method used a PMF method using the orphaned m/z values that incorporated a randomized database to assess the false discovery rate. We show an improvement in protein identification sensitivity of low abundance proteins by combining MS and MS/MS information and add additional information to substantiate “one hit wonders”. Finally, the advantages and disadvantages for the three approaches are discussed.
Experimental Procedures
Yeast whole cell lysate experiment
A protease-deficient Saccharomyces cerevisiae strain BJ546033 was purchased from American Type Culture Collection (Manassas, VA). The strain was grown to mid log phase (OD 0.6) in YPD, and cells collected by centrifugation were lysed as described previously3. The lysed cells were separated into three fractions (soluble, lightly and heavily washed), and the soluble fraction was used in this study. The soluble fraction of cells was digested by a method slightly modified from the one described previously3. Urea was added to the soluble fraction of the cell lysate to denature the proteins. Proteins were then reduced with TCEP, alkylated using iodoacetamide (IAM), and subsequently digested with trypsin. The digestion process was stopped by adding formic acid to a final concentration of 1%. The protein digest was aliquoted and stored at −80 °C prior to use.
The protein digest was pressure-loaded onto a fused silica capillary desalting column containing 5 cm of 5 um Polaris C18-A material (Metachem, Ventura, CA) packed into a 250-um i.d. capillary with a 2 um filtered union (UpChurch Scientific, Oak Harbor, WA). The desalting column was washed with buffer containing 95% water, 5% acetonitrile, and 0.1% formic acid. After desalting, a 100-um i.d capillary with a 5-um pulled tip packed with 10 cm 3-um Aqua C18 material (Phenomenex, Ventura, CA) followed by 3 cm 5-um Partisphere strong cation exchanger (Whatman, Clifton, NJ) was attached to the filter union and the entire split-column (desalting column-filter union-analytical column) was placed inline with an Agilent 1100 quaternary HPLC (Palo Alto, CA) and analyzed using a modified 13-step separation described previously3. The buffer solutions used were 5% acetonitrile/0.1% formic acid (buffer A), 80% acetonitrile/0.1% formic acid (buffer B), and 500 mM ammonium acetate/5% acetonitrile/0.1% formic acid (buffer C). Step 1 consisted of a 100 min gradient from 0–100% buffer B. Steps 2–12 had the following profile: 3 min of 100% buffer A, 2 min of X% buffer C, a 10 min gradient from 0–15% buffer B, and a 97 min gradient from 15–45% buffer B. The 2 min buffer C percentages (X) were 10, 15, 20, 25, 30, 35, 40, 45, 50, 60, 70% respectively for step 2 to step 12 analyses. The final step, the gradient contained: 3 min of 100% buffer A, 20 min of 100% buffer C, a 10 min gradient from 0–15% buffer B, and a 107 min gradient from 15–70% buffer B.
As peptides eluted from the microcapillary column, they were electrosprayed directly into an LTQ-Orbitrap mass spectrometer (ThermoFisher, San Jose, CA) with the application of a distal 2.5 kV spray voltage. A cycle of one full FT scan mass spectrum (400–2000 m/z, resolution of 60,000) followed by 5 data-dependent MS/MS acquired in the linear ion trap with normalized collision energy (setting of 35%) was repeated continuously throughout each step of the multidimensional separation. Application of mass spectrometer scan functions and HPLC solvent gradients were controlled by the XCalibur data system.
Overall data analysis outlines
The general outline is shown in [Supplementary Figure 1]. We investigated three data analysis flows to more fully utilize the data generated by the new generation of hybrid mass spectrometers that produce large numbers of tandem mass spectra and high mass accuracy precursor ions. In the first approach [Supplementary Figure 1A], we employed a unique mass identifier method where “orphaned” m/z values (i.e. m/z values with no associated MS/MS) that match to proteins identified from the MS/MS database search are first subtracted before the m/z values are used as unique mass identifiers for protein identification. In the second method [Supplementary Figure 1B], we used an accurate mass and time tag method by building a potential mass and retention time database from previous MudPIT analyses. For the third method [Supplementary Figure 1C], we used a peptide mass fingerprinting approach together with randomized databases using the m/z values obtained from high mass accuracy precursor scans of a regular MudPIT analysis. The details of these three approaches are given below.
Approach One: MS peak subtraction and unique identifiers
MS and MS/MS data are collected on an LTQ-Orbitrap mass spectrometer in the format of the instrument’s raw file. Each raw mass spectrometry data file obtained from the LTQ-Orbitrap is converted to an MS2 file using RawExtract, an in-laboratory software program ([Supplementary Figure 1A])34, which contains the MS/MS measurements. Each raw file is also processed by using the software ICR-2LS (Anderson, G.A., http://ncrr.pnl.gov/software/) to give a list of deisotoped MS measurements (m/z’s). A regular database search using the SEQUEST algorithm is then performed on MS2 (MS/MS data) to obtain a list of identified proteins P1, as described in the section “Analysis of tandem mass spectra”. The deisotoped m/z’s are then matched to predicted tryptic peptides (allowing up to 1 internal R or K, see [Supplementary Figure 2]) from the list of identified proteins P1. The remaining m/z’s are further matched to predicted singly modified tryptic peptides from the identified proteins set, P1, and then subtracted from the orphaned m/z list. We considered common post-translational modifications ([Supplementary Table 1]) including: (1) Phosphorylation (Serine, Threonine, Tyrosine); (2) N-terminal acetylation; (3) Oxidation (Methionine, Tryptophan); (4) Lysine acetylation; (5) Arginine mono-methylation; (6) Arginine di-methylation. Finally the remaining m/z’s are used as unique identifiers by matching to predicted tryptic peptides from the remaining proteins in the database. This will generate a second list of identified proteins P2. The two protein lists P1 and P2 are then pooled together to give the combined identified proteins PT.
Approach Two: MRT database construction and accurate mass and time tagging
Tandem mass spectra data from previous replicate MudPIT runs were analyzed using the procedure outlined in the section “Analysis of tandem mass spectra”, with the additional action of recording the retention time for each identified peptide. To be able to assess false positive rates for the AMT method, reverse peptide identifications are built into the potential Mass and Retention Time (MRT) database. The protein identification false positive rate is set at 5% for each individual MudPIT experiment.
After the MRT database is constructed, accurate mass and time tagging is performed as follows. Each raw file is processed by using the software ICR-2LS to give a list of deisotoped MS measurements (m/z’s). The deisotoped MS peaks are then used as accurate mass and time tags for protein identification by matching to the potential MRT database. Under this experiment, we allowed a 5 ppm mass tolerance and 5% retention time tolerance when performing accurate mass and time tagging. AMT will generate a list of identified proteins P2. The MS/MS data are processed as usual to give the list of identified proteins P1. The two protein lists P1 and P2 are pooled together to give the combined identified proteins PT.
Approach Three: Peptide mass fingerprinting using MudPIT-based MS data
In this approach we use a randomized protein database to analyze the MS data for protein identification by peptide mass fingerprinting under a specific false positive rate. For protein identification from tandem mass spectra, estimation of false positive rates using a reversed protein database is becoming a standard method.4 However, for protein identification using peptide mass mapping randomized protein databases are not used to assess false discovery rates but may be a good choice as we show below.
Randomized databases are generated as follows ([Supplementary Figure 3A]). The target protein database is first read and the amino acid frequencies and protein length information are recorded. Two randomized protein sequence databases are then generated, both conserving the amino acid frequencies of the target protein database. The first randomized protein database R1 is comprised of N (N should be reasonably large. We choose N = 10,000) randomized proteins, each of length L0 ( L0 = 500 in this study). The second randomized database R2 has the same number of protein entries as the target database, with each protein entry having the same length for its corresponding entry in the target database. The first randomized database R1 is used to estimate μ and σ of the number of m/z hits of the collected m/z list to a randomized protein. R2 is used to estimate false discovery rate ([Supplementary Figure 3B]).
For each MudPIT run, all deisotoped MS1 peaks are first matched to predicted tryptic peptides from the randomized database R1, allowing up to one internal tryptic site for each predicted tryptic peptide ([Supplementary Figure 3B]). For each protein entry in R1, the number of redundant matching MS1 peaks (peaks matched to same tryptic peptides within the protein entry, referred to as “redundant MZ hits”) and unique matching peaks (peaks matched to different tryptic peptides within the protein entry, referred as “unique MZ hits”) are recorded. The distribution of unique MZ hits for Replicate 1 follows a normal distribution while the distribution of redundant MZ hits does not (data not shown). The normal distribution (of unique MZ hits) enables us to assess the significance of protein identification by MS mass mapping. For this purpose, the mean and standard deviation of the number of unique MZ hits are calculated. For Replicate 1 with a 5 ppm mass tolerance, the mean of unique MZ hits is 42.8789 with a standard deviation of 8.4879.
After mean and standard deviation of the number of m/z hits of the collected m/z list to a randomized protein were obtained, we used the following protein identification scoring formula
| (1) |
where x is the number of non-redundant m/z hits, L is the length of the protein, L0 is the common length of the randomized protein database R1, μ is mean of unique MZ hits to the randomized protein database R1, and σ is the standard deviation of unique MZ hits to the randomized protein database R1.
A z score is then calculated for each protein entry according to the number of unique MZ hits according to [Equation (1)]. The distributions of z scores for R2 and the target database for Replicate 1 are shown in [Figure 1]. The distribution of z scores for R2 follows a standard normal distribution with mean z scores of 0.0298 (≅ 0) and a standard deviation of 0.9926 (≅ 1). However, the distribution of z scores for the target database does not follow a standard normal distribution. The mean z score for the target database is −0.0439 with a standard deviation of 1.6309 – we have more protein entries in the two tails. By using a certain z score cut off, we obtained a list of proteins from the target database and the randomized database R2. The false discovery rate can then be estimated by the proportion of protein hits to R2 in this list of identified proteins.
Figure 1.
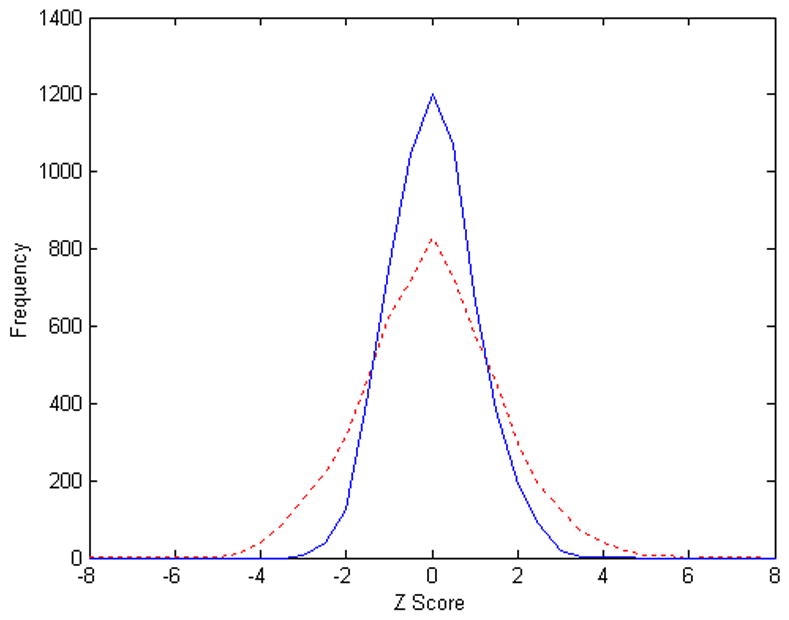
Scoring MZ Hits using randomized databases (Replicate 1). Blue solid line, distribution of z scores computed from unique MZ hits to the randomized yeast database R2; Red dash line, distribution of z scores computed from unique MZ hits to the yeast database (target database).
Analysis of tandem mass spectra
Tandem mass spectra were analyzed using the following software analysis protocol. MS/MS were searched with the SEQUEST algorithm5 against a yeast protein sequence database concatenated to a decoy database in which the sequence for each entry in the original database was reversed4. All searches were parallelized and performed on a Beowulf computer cluster consisting of 100 1.2 GHz Athlon CPUs35. No enzyme specificity was considered for any search. SEQUEST results were assembled and filtered using the DTASelect (version 2.0) program36,37. DTASelect 2.0 uses a quadratic discriminant analysis to dynamically set XCorr and ΔCn thresholds for the entire dataset to achieve a user-specified false positive rate. The false positive rates are estimated by the program from the number and quality of spectral matches to the decoy (reverse) database.
Retention time normalization
For multi-dimensional LC-MS/MS experiments, the retention time could be difficult to normalize. On the other hand, since we perform five MS/MS measurements following every MS measurement, peptide identifications from MS/MS experiments provide useful information for retention time normalization.
For experiment e1 and experiment e2, each with a collection of peptide identifications from the SEQUEST search, the mean difference of retention time for all pairs of matching peptides between the two experiments can be calculated using the following formula:
| (2) |
where n is the number of matching peptide pairs between the two experiments, and t(pe1, pe 2)i indicates the retention time difference for the i-th pair (pe1, pe2) of all the matching peptides. Using experiment e1 as a reference, the retention times for experiment e2 can then be normalized by adding μt to every retention time entry. The result of normalization of retention time of Replicate 5 using Replicate 4 as a reference is given in [Supplementary Figure 4].
Experimental Results and Discussions
We performed six replicate 13-step MudPIT analyses on soluble yeast proteins. We used half of the dataset (Replicates 4, 5, and 6) for the construction of the potential MRT database, and the other half (Replicates 1, 2, and 3) for testing the scoring schemes. The MS and MS/MS information for Replicates 1, 2, and 3 are given in [Supplementary Table 2]. The false positive rates of identified proteins are controlled to be under 5%. Actual false positive rates might vary from case to case since sometimes it is impossible to control a false positive rate to be close to 5% under a specific filtering criterion.
Protein identification by MS/MS database search
The first protein identification set P1 is obtained from MS/MS database search by using SEQUEST followed by the validation program DTASelect 2.0. The protein identification false positive rate was set at 5% (at protein level) for each individual experiment for Replicates 1, 2, and 3. Under the above filtering criteria, we identified 1307, 1372, and 1347 proteins for Replicate 1, 2, and 3, respectively. When 2 peptides are required for an identification, we identified 860, 904, and 894 proteins from Replicate 1, 2, and 3, respectively. When the data from Replicates 1, 2, and 3 are pooled together and filtered by DTASelect2.0 requiring 2 peptides for each protein, we obtained 1119 proteins at a 0.44% false positive rate. The data are summarized in [Table 1]. For proteins identified by SEQUEST, roughly 34% of proteins are identified by a single peptide (P1, “one-hit wonder”).
Table 1. SEQUEST ID summary at 5% FP.
P1: Proteins identified by one single peptide; P2: Proteins identified by two or more peptides. The number in the parentheses of P1 proteins indicate the number of proteins that can be further verified by more peptides from the AMT approach.
| Replicate 1 | Replicate 2 | Replicate 3 | |
|---|---|---|---|
| # Proteins | 1307 | 1372 | 1347 |
| P1 | 447(76) | 468(72) | 453(72) |
| P2 | 860 | 904 | 894 |
| FP | 4.85% | 4.96% | 4.75% |
Potential MRT database construction
Protein identifications by SEQUEST from Replicates 4, 5, and 6 were used to construct the potential MRT database. To be able to assess the false positive rates of the accurate mass and time tagging approach, we built the reverse peptide/protein hits into the MRT database. The false positive rate was set at 5% (protein level) for each individual experiment. [Table 2] gives a summary of the MRT database constructed from three replicate MudPIT runs. As estimated from reverse protein hits, the false positive rate for the whole potential MRT database was 1.38% at the peptide level, and 7.29% at the protein level. The overall false positive rate (7.29%) was higher than each individual experiment (5%) since the true positive proteins tend to overlap while the false positive proteins tend to be different.
Table 2.
MRT database summary.
| #Forward | #Reverse | FP | |
|---|---|---|---|
| Copies | 15516 | 130 | 0.84% |
| Peptides | 8837 | 122 | 1.38% |
| Proteins | 1673 | 122 | 7.29% |
Protein identification by peak subtraction and unique identifiers
From the set of identified proteins by SEQUEST, we generated theoretical tryptic peptides by requiring fully tryptic termini and allowing up to one internal tryptic site (see [Supplementary Figure 2]). Theoretical (M+H)+’s are then calculated for each theoretical peptide. From the set of deisotoped m/z’s obtained from MS1 measurements, we can calculate observed (M+H)+ by using the formula MPlusH = mz · z − z + 1, where mz indicates the measured m/z and z indicates the charge of the ion. The observed (M+H)+’s are then matched to theoretical (M+H)+’s by allowing a given ppm mass tolerance. The matched (M+H)+’s are removed from the set of observed (M+H)+’s.
For the generation of predicted modified tryptic peptides, the nine common post-translational modifications in [Supplementary Table 1] are considered. The N-terminal acetylation refers to the N-terminal modification of proteins, not peptides. For each tryptic peptide, all nine modifications are considered, but the number of modification is restricted to one modification for each predicted modified peptide. For example, if the tryptic peptide is MTALLEDQK and the peptide is located at the beginning of the protein, then the following modifications will be considered and we will have four modified peptides (one for each modification): (1) N-terminal acetylation; (2) Oxidation on M; (3) Phosphorylation on T; (4) Acetylation on K.
Theoretical (M+H)+’s are then calculated for these predicted modified tryptic peptides and matched to the observed (M+H)+’s by allowing a given ppm mass tolerance. The matched (M+H)+’s are then removed from the observed (M+H)+’s.
The remaining observed (M+H)+’s are then used as unique identifiers for protein identifications by matching to predicted tryptic peptides from the un-identified proteins in the database. To safeguard from false positive identifications, a selection criterion is applied to obtain the final list of protein identifications: a protein must be identified by at least by two unique m/z measurements (two distinct peptides) to be included in the protein identification set P2. By applying these procedures using a 5 ppm mass tolerance, we identified 28, 63, and 28 proteins (P2) from Replicate 1, 2, and 3, respectively. Some statistical details of peak matching are given in [Supplementary Table 3].
Protein identification by accurate mass and time tagging
We explored accurate mass and time tagging as outlined in [Supplementary Figure 1C]. For this approach, all of the deisotoped MS1 peaks were used to search for matching peptides and proteins from the potential MRT database. A peak is disqualified for peptide and protein identification if it matches to two or more different peptides in the potential MRT database under a specified mass tolerance (5 ppm in this study) and retention time tolerance (5% in this study). More proteins and peptides are identified with increasing mass tolerance. However, the false positive rates also increase with relaxation of mass tolerance. We used a 5 ppm mass tolerance as the Orbitrap mass analyzer can routinely achieve 5-ppm mass accuracy32. We found that the false positive rates increased gradually when the retention time tolerance is relaxed, as shown in [Figure 2]. A 5% retention time tolerance provided a reasonable false positive rate.
Figure 2.

Effect of retention time tolerance on protein identification using the accurate mass and time tag approach.
At 5 ppm mass tolerance and 5% retention time tolerance, we obtained 922, 1007, and 973 protein identifications at the false positive rate of 3.15%, 2.48%, and 2.67%, for Replicate 1, 2, and 3, respectively. When pooled together, these three replicates generated 1196 protein identifications containing 4.68% false positives.
When the proteins identified by AMT were combined with SEQUEST search results, we found that AMT results can further substantiate SEQUEST protein identifications. For SEQUEST-identified proteins with single peptides (“one-hit wonders”), 17.00%, 15.38%, and 15.89% proteins received additional peptide identifications from AMT, for Replicate 1, 2, and 3, respectively ([Table 1]). When the AMT-identified proteins and SEQUEST-identified proteins are pooled together and further filtered with the requirement of at least two distinct peptide identifications for each protein, we obtained 1240 proteins with a false positive rate of 0.48% (i.e., 6 decoy matches). This is not achievable by using MS/MS data or MS data alone. By combining MS and MS/MS information we can improve protein identification sensitivity at high confidence level.
Protein identification by using peptide mass mapping
We also investigated the use of randomized protein databases for the estimation of false positive rate for protein identification using MS mass mapping. As described in the [Experimental Procedures] section, the target protein database is first read, and the amino acid frequencies and protein length information are recorded. Two randomized databases R1 and R2 are then generated ([Supplementary Figure 3A]). Matches of MS1 peaks from each MudPIT runs to the target database as well as the randomized databases R1 and R2 are recorded.
A z score is then calculated for each protein entry according to the number of unique MZ hits according to [Equation (1)]. Using a z score cutoff of 3.0 (or chance probability of 0.001349), we identified 192 proteins from the target database and 9 proteins from the decoy database R2 for Replicate 1. Thus, the false positive rate at this z score cutoff for this specific experiment is 4.21%. Under the same z score cutoff of 3.0, we identified 194 and 170 proteins from Replicate 2 and 3, respectively. By varying the z score cutoff, we can obtain protein identifications for different false positive rates, as shown in [Table 3] for Replicate 1 and [Supplementary Table 4] for Replicates 2, and 3.
Table 3.
Protein identified from Replicate 1 by using PMF with randomized databases under various z score cutoffs.
| z scores cutoff | Chance Probability | Protein ID Yeast DB | Protein ID Random DB | Actual FP | Predicted Random ID | Predicted FP |
|---|---|---|---|---|---|---|
| 3.5 | 0.000233 | 112 | 2 | 1.79% | 1.40 | 1.25% |
| 3 | 0.001349 | 192 | 9 | 4.69% | 8.09 | 4.21% |
| 2.8 | 0.002555 | 246 | 19 | 7.72% | 15.32 | 6.23% |
| 2.6 | 0.004661 | 315 | 44 | 13.97% | 27.95 | 8.87% |
| 2.4 | 0.008197 | 391 | 80 | 20.46% | 49.15 | 12.57% |
| 2.2 | 0.013903 | 483 | 122 | 25.26% | 83.36 | 17.26% |
| 2 | 0.02275 | 582 | 183 | 31.44% | 136.41 | 23.44% |
| 1.8 | 0.03593 | 708 | 266 | 37.57% | 215.44 | 30.43% |
| 1.6 | 0.054799 | 867 | 382 | 44.06% | 328.57 | 37.90% |
| 1.4 | 0.080757 | 1048 | 536 | 51.15% | 484.22 | 46.20% |
| 1.2 | 0.11507 | 1257 | 725 | 57.68% | 689.96 | 54.89% |
| 1 | 0.158655 | 1486 | 967 | 65.07% | 951.30 | 64.02% |
We found that the actual false positive rate is very close to the predicted false positive rate, as shown in [Table 3]. The column “Predicted Random ID” is calculated by the product of the chance probability and the number of protein entries in the randomized database R2 (5996 as in this study). This further substantiates the validity of using randomized databases for the assessment of false positive rate using PMF approach.
A validation of our PMF-like approach for protein identification using MudPIT data was also supplied as supplementary material to this paper. The MudPIT-based PMF scoring might be further improved with more sophisticated schemes by using other information about the nature of each match, such as peptide length or missed tryptic sites.
Comparison of different scoring schemes
Comparison of protein identification using different scoring schemes is given in [Table 4]. SEQUEST search of MS/MS data identified 1566 proteins at 5.0% protein level false positive rate from three replicate MudPIT runs Replicate 1, 2, and 3. By using MS peaks not matched to proteins identified from MS/MS database search as unique identifiers, we identified 92 more proteins.
Table 4.
Comparison of different scoring schemes. Numbers in the parenthesis indicate the false positive rates for the identified proteins.
| Rep 1 | Rep 2 | Rep 3 | Total | |
|---|---|---|---|---|
| SEQUEST | 1307 (4.85%) | 1372 (4.96%) | 1347 (4.75%) | 1566 (4.98%) |
| SS1 (5 ppm, >= 2 Unique Peptides) | 28 (NA) | 63 (NA) | 28 (NA) | 105 (NA) |
| SS2 (5 ppm, 5% RT) | 922 (3.15%) | 1007 (2.48%) | 973 (2.67%) | 1196 (4.68%) |
| SS3 (5 ppm, z >= 3.5) | 112 (1.79%) | 101 (1.98%) | 83 (1.20%) | 159 (3.14%) |
“NA” means “not available”.
For peptide mass fingerprinting (PMF) using high mass accuracy MudPIT 2D-LC/MS data, we use the concept of decoy databases. By using randomized databases, we are able to assess the false positive rate of protein identification using PMF. Under this approach, we identified 271 proteins at 3.32% false positive rate by using PMF alone from the three MudPIT runs. Among these 271 proteins, 114 proteins are also identified by the SEQUEST search, with 157 new proteins identified by PMF.
The big overlap of identified proteins between PMF and SEQUEST further statistically validated the PMF method. Under a hypergeometric model, with a population size N=5996 (the size of the number of proteins in the yeast database) and number of successes k = 1566 in population (number of proteins identified by SEQUEST), a sample size n = 271 (number of proteins identified by PMF) and number of successes x = 114 in sample (overlap between SEQUEST and PMF), according to the following hypergeometric formula
the probability of the null hypothesis that the match occurred by chance is 3.83 × 10⁻⁹. The 157 proteins identified by PMF but not SEQUEST are of lower protein abundance comparing to those identified by both PMF and SEQUEST (see below).
For accurate mass and time tagging, at 5ppm mass tolerance and 5% retention time tolerance, we identified 1196 proteins at 4.68% false positive rate. When these proteins were compared with the 1566 proteins by SEQUEST, 103 proteins were found to be unique. When the proteins from SEQUEST and AMT are pooled together and filtered with an additional criterion of at least two distinct peptide identifications for a protein identification, we obtained 1240 proteins with a false positive rate of 0.48% (or 6 decoys). This is unachievable by using either MS/MS database search or MS-based approaches alone. By combining MS and MS/MS information, we can improve protein identification sensitivity with high confidence.
In total, the three approaches identified 342 extra proteins [Supplementary Figure 5]. This is a 21.8% improvement comparing to SEQUEST identification. These extra proteins are found to be consistently of lower abundance. The average abundance for proteins identified from SEQUEST is 2.63 × 10⁴ copies per cell38, while the average abundances are 2.87 × 10³, 3.95 × 10³, and 2.63 × 10³ copies per cell for proteins identified by unique mass identifiers, AMT, and PMF, respectively. Especially, for the 271 proteins identified by PMF, the average abundance of the 114 proteins that overlap with those of SEQUEST is 4.78× 10⁴ copies per cell, which is on average 18 fold more abundant than those identified by PMF only. The data shows that our methods improve identification of low abundance proteins.
The unique identifier approach will probably work better when the genome of the studied organism is relatively small15. When the genome is large, it is difficult to use accurately measured masses as unique identifiers for protein identification, since the larger the genome, the more peptides will have the same (or close) precursor masses. The AMT approach, however, is more powerful since it utilizes retention time as second dimensional information for protein identification. The AMT approach can also leverage identifications from previous experiments. Especially, “one-hit wonders” from a specific experiment can be further substantiated by accurately measured precursor masses of previously identified peptides as we showed here. Identifications by the AMT approach, however, are only limited to previous experiments and thus are not suitable for discovering unknown peptides. The PMF-like approach, instead, can identify proteins previously not identified. As we showed here, more than half of the proteins identified by the PMF-like approach were not identified by MS/MS database search. These proteins consistently have lower abundance levels comparing to those identified by MS/MS database search. The PMF-like approach, however, can not identify as many proteins as the MS/MS database search, as shown by [Table 4] as well as our supplementary results on the 17 proteins mixture. Nevertheless, the PMF-like approach could be a protein identification method complementary to MS/MS database search.
Conclusions
In this study we investigated and compared three approaches to extend identifications from shotgun experiments by combining MS and MS/MS information using LTQ-Orbitrap high mass accuracy data. In the first approach MS peaks are first subtracted before being used as unique mass identifiers for protein identification. In the second approach we explored the use of LTQ-Orbitrap data for AMT tagging. For the third method we introduce the concept of decoy (randomized) databases for large scale peptide mass fingerprinting. Comparing the different methods, the approach of combining MS/MS database search and AMT tagging is most promising from our data. In conclusion, by combining MS and MS/MS information, we can improve protein identification sensitivity with high confidence. One-hit wonders from MS/MS database search can be further verified by MS information and the approach improves the identification of low abundance proteins.
Supplementary Material
Supplementary Figure 1 (A) Analysis flow for MS peaks subtraction and protein identification by using unique identifiers;
Supplementary Figure 1 (B) Analysis flow for protein identification using AMT;
Supplementary Figure 1 (C) Analysis flow for protein identification using peptide mass fingerprinting.
Supplementary Figure 2. Tryptic termini statistics for peptides identified from SEQUEST search.
Supplementary Figure 3 Peptide mass fingerprinting using randomized databases. (A) Generation of randomized protein databases from target protein database;
Supplementary Figure 3 Peptide mass fingerprinting using randomized databases. (B) Overall scoring outline for PMF using randomized protein databases.
Supplementary Figure 4. Retention time normalization, Replicate 4 vs Replicate 5. A. Before normalization, mean difference = 11.9116%, SD of difference is 8.0956%; B. After normalization, mean difference = 0, SD is the same.
Supplementary Figure 5. Venn diagram showing extra protein identified using MS information.
Supplementary Table 1. Common amino acid modifications used in this study.
Supplementary Table 2. Summary of MS and MS/MS data from Replicates 1, 2, and 3. a. Number of m/z values after deisotoped. b. Number of tandem mass spectra; c. Percentage of m/z values that have tandem mass spectra data.
Supplementary Table 3. Assignments of MS1 peaks to proteins from the yeast database. a. Percentage of MS1 peaks assigned to predicted tryptic peptides from identified proteins; b. Percentage of MS1 peaks assigned to predicted modified tryptic peptides from identified proteins; c. Percentage of MS1 peaks assigned to predicted tryptic peptides from other proteins in the yeast protein sequence database; d. Percentage of remaining MS1 peaks.
Supplementary Table 4. Protein identification by AMT with randomized databases on Replicates 2 and 3.
Supporting Table 5. Proteins identified from target database by PMF-like approach at z score cutoff of 3.
Acknowledgments
BL is supported by CFFT computational fellowship BALCH05X5. JRY acknowledges support from NIH 5R01MH067880-02, NIH P41 RR11823-10, and NIH R01 HL079442. The authors want to thank Drs. Daniel Cociorva, Meng-Qiu Dong, Daniel McClatchy, Tao Xu for helpful reading of the manuscript.
References
- 1.McDonald WH, Yates JR., III Shotgun proteomics: integrating technologies to answer biological questions. Curr Opin Mol Ther. 2003;5:302–309. [PubMed] [Google Scholar]
- 2.Aebersold R, Mann M. Mass spectrometry-based proteomics. Nature. 2003;422:198–207. doi: 10.1038/nature01511. [DOI] [PubMed] [Google Scholar]
- 3.Washburn MP, Wolters D, Yates JR., III Large-scale analysis of the yeast proteome by multidimensional protein identification technology. Nature Biotechnology. 2001;19:242–247. doi: 10.1038/85686. [DOI] [PubMed] [Google Scholar]
- 4.Peng J, Elias JE, Thoreen CC, Licklider LJ, Gygi SP. Evaluation of multidimensional chromatography coupled with tandem mass spectrometry (LC/LC-MS/MS) for large-scale protein analysis, the yeast proteome. J Proteome Res. 2003;2:43–50. doi: 10.1021/pr025556v. [DOI] [PubMed] [Google Scholar]
- 5.Eng J, McCormack A, Yates J., III An Approach to Correlate Tandem Mass Spectral Data of Peptides with Amino Acid Sequences in a Protein Database. J Am Soc Mass Spectrom. 1994;5:976–989. doi: 10.1016/1044-0305(94)80016-2. [DOI] [PubMed] [Google Scholar]
- 6.Perkins DN, Pappin DJ, Creasy DM, Cottrell JS. Probability-based protein identification by searching sequence databases using mass spectrometry data. Electrophoresis. 1999;20:3551–3567. doi: 10.1002/(SICI)1522-2683(19991201)20:18<3551::AID-ELPS3551>3.0.CO;2-2. [DOI] [PubMed] [Google Scholar]
- 7.Geer LY, Markey SP, Kowalak JA, Wagner L, Xu M, Maynard DM, Yang X, Shi W, Bryant SH. Open mass spectrometry search algorithm. J Proteome Res. 2004;3:958–964. doi: 10.1021/pr0499491. [DOI] [PubMed] [Google Scholar]
- 8.McDonald WH, Yates JR., III Shotgun proteomics biomarker discovery. Dis Markers. 2002;18:99–105. doi: 10.1155/2002/505397. [DOI] [PMC free article] [PubMed] [Google Scholar]
- 9.Peng J, Schwartz D, Elias JE, Thoreen CC, Cheng D, Marsischky G, Roelofs J, Finley D, Gygi SP. A proteomics approach to understanding protein ubiquitination. Nat Biotechnol. 2003;21:921–926. doi: 10.1038/nbt849. [DOI] [PubMed] [Google Scholar]
- 10.Wang R, Prince JT, Marcotte EM. Mass spectrometry of the M. smegmatis proteome: protein expression levels correlate with function, operons, and codon bias. Genome Res. 2005;15:1118–1126. doi: 10.1101/gr.3994105. [DOI] [PMC free article] [PubMed] [Google Scholar]
- 11.Cantin GT, Venable JD, Cociorva D, Yates JR., III Quantitative phosphoproteomic analysis of the tumor necrosis factor pathway. J Proteome Res. 2006;5:127–134. doi: 10.1021/pr050270m. [DOI] [PMC free article] [PubMed] [Google Scholar]
- 12.Liu H, Sadygov RG, Yates JR., III A model for random sampling estimation of relative protein abundance in shotgun proteomics. Anal Chem. 2004;76:4193–4201. doi: 10.1021/ac0498563. [DOI] [PubMed] [Google Scholar]
- 13.Durr E, Yu J, Krasinska KM, Carver LA, Yates JR, Testa JE, Oh P, Schnitzer JE. Direct proteomic mapping of the lung microvascular endothelial cell surface in vivo and in cell culture. Nat Biotechnol. 2004;22:985–992. doi: 10.1038/nbt993. [DOI] [PubMed] [Google Scholar]
- 14.Zimmer JS, Monroe ME, Qian WJ, Smith RD. Advances in proteomics data analysis and display using an accurate mass and time tag approach. Mass Spectrom Rev. 2006;25:450–482. doi: 10.1002/mas.20071. [DOI] [PMC free article] [PubMed] [Google Scholar]
- 15.Lipton MS, Pasa-Tolic L, Anderson GA, Anderson DJ, Auberry DL, Battista JR, Daly MJ, Fredrickson J, Hixson KK, Kostandarithes H, Masselon C, Markillie LM, Moore RJ, Romine MF, Shen Y, Stritmatter E, Tolic N, Udseth HR, Venkateswaran A, Wong KK, Zhao R, Smith RD. Global analysis of the Deinococcus radiodurans proteome by using accurate mass tags. PNAS. 2002;99:11049–11054. doi: 10.1073/pnas.172170199. [DOI] [PMC free article] [PubMed] [Google Scholar]
- 16.Belov ME, Anderson GA, Wingerd MA, Udseth HR, Tang K, Prior DC, Swanson KR, Buschbach MA, Strittmatter EF, Moore RJ, Smith RD. An automated high performance capillary liquid chromatography-Fourier transform ion cyclotron resonance mass spectrometer for high-throughput proteomics. J Am Soc Mass Spectrom. 2004;15:212–232. doi: 10.1016/j.jasms.2003.09.008. [DOI] [PubMed] [Google Scholar]
- 17.Pasa-Tolic L, Masselon C, Barry RC, Shen Y, Smith RD. Proteomic analyses using an accurate mass and time tag strategy. BioTechniques. 2004;37:621–639. doi: 10.2144/04374RV01. [DOI] [PubMed] [Google Scholar]
- 18.Strittmatter EF, Ferguson PL, Tang K, Smith RD. Proteome analyses using accurate mass and elution time peptide tags with capillary LC time-of-flight mass spectrometry. J Am Soc Mass Spectrom. 2003;14:980–991. doi: 10.1016/S1044-0305(03)00146-6. [DOI] [PubMed] [Google Scholar]
- 19.May D, Fitzgibbon M, Liu Y, Holzman T, Eng J, Kemp CJ, Whiteaker J, Paulovich A, McIntosh M. A platform for accurate mass and time analyses of mass spectrometry data. J Proteome Res. 2007;6:2685–2694. doi: 10.1021/pr070146y. [DOI] [PubMed] [Google Scholar]
- 20.Yates JR, III, Speicher S, Griffin PR, Hunkapiller T. Peptide mass maps: a highly informative approach to protein identification. Anal Biochem. 1993;214:397–408. doi: 10.1006/abio.1993.1514. [DOI] [PubMed] [Google Scholar]
- 21.Pappin DJ, Hojrup P, Bleasby AJ. Rapid identification of proteins by peptide-mass fingerprinting. Curr Biol. 1993;3:327–332. doi: 10.1016/0960-9822(93)90195-t. [DOI] [PubMed] [Google Scholar]
- 22.James P, Quadroni M, Carafoli E, Gonnet G. Protein identification by mass profile fingerprinting. Biochem Biophys Res Commun. 1993;195:58–64. doi: 10.1006/bbrc.1993.2009. [DOI] [PubMed] [Google Scholar]
- 23.Henzel WJ, Billeci TM, Stults JT, Wong SC, Grimley C, Watanabe C. Identifying proteins from two-dimensional gels by molecular mass searching of peptide fragments in protein sequence databases. Proc Natl Acad Sci U S A. 1993;90:5011–5015. doi: 10.1073/pnas.90.11.5011. [DOI] [PMC free article] [PubMed] [Google Scholar]
- 24.Jensen ON, Podtelejnikov AV, Mann M. Identification of the components of simple protein mixtures by high-accuracy peptide mass mapping and database searching. Anal Chem. 1997;69:4741–4750. doi: 10.1021/ac970896z. [DOI] [PubMed] [Google Scholar]
- 25.Lim H, Eng J, Yates JR, III, Tollaksen SL, Giometti CS, Holden JF, Adams MW, Reich CI, Olsen GJ, Hays LG. Identification of 2D-gel proteins: a comparison of MALDI/TOF peptide mass mapping to mu LC-ESI tandem mass spectrometry. J Am Soc Mass Spectrom. 2003;14:957–970. doi: 10.1016/s1044-0305(03)00144-2. [DOI] [PubMed] [Google Scholar]
- 26.Lubman DM, Kachman MT, Wang H, Gong S, Yan F, Hamler RL, O’Neil KA, Zhu K, Buchanan NS, Barder TJ. Two-dimensional liquid separations-mass mapping of proteins from human cancer cell lysates. J Chromatogr B. 2002;782:183–196. doi: 10.1016/s1570-0232(02)00551-2. [DOI] [PubMed] [Google Scholar]
- 27.Giddings MC, Shah AA, Gesteland R, Moore B. Genome-based peptide fingerprint scanning. Proc Natl Acad Sci U S A. 2003;100:20–25. doi: 10.1073/pnas.0136893100. [DOI] [PMC free article] [PubMed] [Google Scholar]
- 28.Eriksson J, Fenyo D. A model of random mass-matching and its use for automated significance testing in mass spectrometric proteome analysis. Proteomics. 2002;2:262–270. doi: 10.1002/1615-9861(200203)2:3<262::aid-prot262>3.0.co;2-w. [DOI] [PubMed] [Google Scholar]
- 29.Henzel WJ, Watanabe C, Stults JT. Protein identification: the origins of peptide mass fingerprinting. J Am Soc Mass Spectrom. 2003;14:931–942. doi: 10.1016/S1044-0305(03)00214-9. [DOI] [PubMed] [Google Scholar]
- 30.Makarov A. Electrostatic axially harmonic orbital trapping: a high-performance technique of mass analysis. Anal Chem. 2000;72:1156–1162. doi: 10.1021/ac991131p. [DOI] [PubMed] [Google Scholar]
- 31.Schwartz JC, Senko MW, Syka JE. A two-dimensional quadrupole ion trap mass spectrometer. J Am Soc Mass Spectrom. 2002;13:659–669. doi: 10.1016/S1044-0305(02)00384-7. [DOI] [PubMed] [Google Scholar]
- 32.Makarov A, Denisov E, Lange O, Horning S. Dynamic range of mass accuracy in LTQ Orbitrap hybrid mass spectrometer. J Am Soc Mass Spectrom. 2006;17:977–982. doi: 10.1016/j.jasms.2006.03.006. [DOI] [PubMed] [Google Scholar]
- 33.Jones EW. Tackling the protease problem in Saccharomyces cerevisiae. Methods Enzymol. 1991;194:428–453. doi: 10.1016/0076-6879(91)94034-a. [DOI] [PubMed] [Google Scholar]
- 34.McDonald WH, Tabb DL, Sadygov RG, MacCoss MJ, Venable J, Graumann J, Johnson JR, Cociorva D, Yates JR., III MS1, MS2, and SQT-three unified, compact and easily parsed file formats for the storage of shotgun proteomic spectra and identifications. Rapid Commun Mass Spectrom. 2004;18:2162–2168. doi: 10.1002/rcm.1603. [DOI] [PubMed] [Google Scholar]
- 35.Sadygov RG, Eng J, Durr E, Saraf A, McDonald H, MacCoss MJ, Yates JR., III Code Developments to Improve the Efficiency of Automated MS/MS Spectra Interpretation. J Proteome Res. 2002;2:211–215. doi: 10.1021/pr015514r. [DOI] [PubMed] [Google Scholar]
- 36.Tabb DL, McDonald WH, Yates JR., III DTASelect Contrast: tools for assembling comparing protein identifications from shotgun proteomics. J Proteome Res. 2002;1:21–26. doi: 10.1021/pr015504q. [DOI] [PMC free article] [PubMed] [Google Scholar]
- 37.Cociorva D, Yates JR., III DTASelect 2.0: Improving the Confidence of Peptide and Protein Identifications. 54th ASMS Annual Meeting Proceedings.2006. [Google Scholar]
- 38.Ghaemmaghami S, Huh WK, Bower K, Howson RW, Belle A, Dephoure N, O’Shea EK, Weissman JS. Global analysis of protein expression in yeast. Nature. 2003;425:737–741. doi: 10.1038/nature02046. [DOI] [PubMed] [Google Scholar]
Associated Data
This section collects any data citations, data availability statements, or supplementary materials included in this article.
Supplementary Materials
Supplementary Figure 1 (A) Analysis flow for MS peaks subtraction and protein identification by using unique identifiers;
Supplementary Figure 1 (B) Analysis flow for protein identification using AMT;
Supplementary Figure 1 (C) Analysis flow for protein identification using peptide mass fingerprinting.
Supplementary Figure 2. Tryptic termini statistics for peptides identified from SEQUEST search.
Supplementary Figure 3 Peptide mass fingerprinting using randomized databases. (A) Generation of randomized protein databases from target protein database;
Supplementary Figure 3 Peptide mass fingerprinting using randomized databases. (B) Overall scoring outline for PMF using randomized protein databases.
Supplementary Figure 4. Retention time normalization, Replicate 4 vs Replicate 5. A. Before normalization, mean difference = 11.9116%, SD of difference is 8.0956%; B. After normalization, mean difference = 0, SD is the same.
Supplementary Figure 5. Venn diagram showing extra protein identified using MS information.
Supplementary Table 1. Common amino acid modifications used in this study.
Supplementary Table 2. Summary of MS and MS/MS data from Replicates 1, 2, and 3. a. Number of m/z values after deisotoped. b. Number of tandem mass spectra; c. Percentage of m/z values that have tandem mass spectra data.
Supplementary Table 3. Assignments of MS1 peaks to proteins from the yeast database. a. Percentage of MS1 peaks assigned to predicted tryptic peptides from identified proteins; b. Percentage of MS1 peaks assigned to predicted modified tryptic peptides from identified proteins; c. Percentage of MS1 peaks assigned to predicted tryptic peptides from other proteins in the yeast protein sequence database; d. Percentage of remaining MS1 peaks.
Supplementary Table 4. Protein identification by AMT with randomized databases on Replicates 2 and 3.
Supporting Table 5. Proteins identified from target database by PMF-like approach at z score cutoff of 3.