Abstract
We describe Census, a quantitative software tool compatible with many labeling strategies as well as with label-free analyses, single-stage mass spectrometry (MS1) and tandem mass spectrometry (MS/MS) scans, and high- and low-resolution mass spectrometry data. Census uses robust algorithms to address poor-quality measurements and improve quantitative efficiency, and it can support several input file formats. We tested Census with stable-isotope labeling analyses as well as label-free analyses.
Keywords: mass spectrometry, quantification, label free, metabolic labeling
In recent years, global quantification using mass spectrometry has garnered a significant level of interest due to the emergence of fields that rely on large scale profiling of peptides/proteins (proteomics) and small molecules (metabolomics). In the field of proteomics, the identification of large numbers of peptides has become commonplace with the advent of new instrumentation(1–7) and informatics tools(8–11), however, progress with regards to the quantification process has been hampered by the extreme analytical challenges.
In general, peptide/protein quantification by mass spectrometry is achieved via either stable isotope labeling or a label free approach. Stable isotope labeling has become the core technology for high throughput peptide quantification efforts employing mass spectrometry. Quantification is typically achieved by comparison of an unlabeled or “light” peptide (i.e., comprised of naturally abundant stable isotopes) to an internal standard that is chemically identical with the exception of atoms that are enriched with a “heavy” stable isotope. While the stable isotope labeling approach has been the most commonly employed over the past several years, label free approaches have been gaining momentum recently due to the inherent simplicity, increased throughput, and low cost. Several strategies for label free differential expression analysis have emerged and can generally be divided into two groups; those that are fundamentally based on identification of peptides prior to quantification and those that rely on first stage MS data alone.
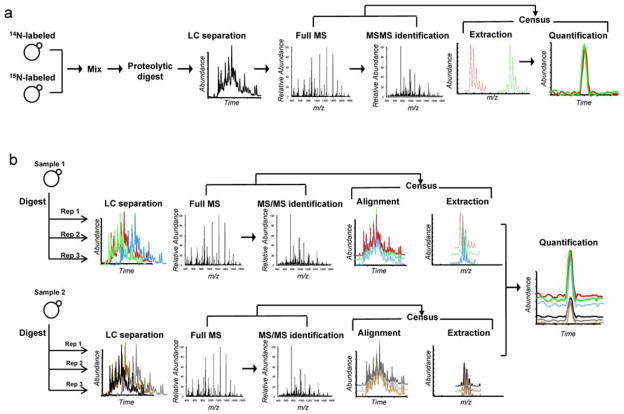
In this paper we describe a new software tool for quantitative analysis called Census and discuss its impact on our ability to analyze quantitative mass spectrometry proteomic data. What makes Census differentiated most from other quantitative tools is its flexibility to handle most types of quantitative proteomics labeling strategies such as 15N, SILAC, iTRAQ, etc. as well as label free experiments with multiple statistical algorithms to improve quality of results (Fig. 1). Census is based on a program previously written in our lab called RelEx(12), but has been re-written with many new features that significantly improve the accuracy and precision of resulting measurements and drastically improves computational performance (Supplementary Information online and Table 1). Census is capable of quantification from either MS or MS/MS scans and is thus able to process data generated from data-independent acquisition(13), SRM, or MRM analyses. Other features incorporated into Census include the ability to use high resolution and high mass accuracy MS data for improved quantification, as well as the ability to perform quantitative analyses based on both spectral counting and an LC-MS peak area approach utilizing chromatogram alignment. To minimize false positive measurements and improve protein/peptide ratio accuracy Census incorporates multiple algorithms such as weighted peptide measurements, dynamic peak finding, and post analysis statistical filters. Census also has a feature to detect singleton peptides (i.e., where one isotopomer signal is below the detection limit). Census currently supports several input file formats including MS1/MS2, DTASelect, mzXML, and pepXML (Instrument independent file formats, Supplementary Figure 1 online).
Figure 1.
Schematic detailing the quantitative analysis capabilities of Census. (a) shows a schematic of the isotopic labeling strategy and (b) shows our approach to isotope free analysis. These capabilities allows Census to process a wide variety of different types of experimental data including data-independent, SRM and MRM experiments derived from low and high resolution instrumentation utilizing either isotopic labeling or a label free methodology.
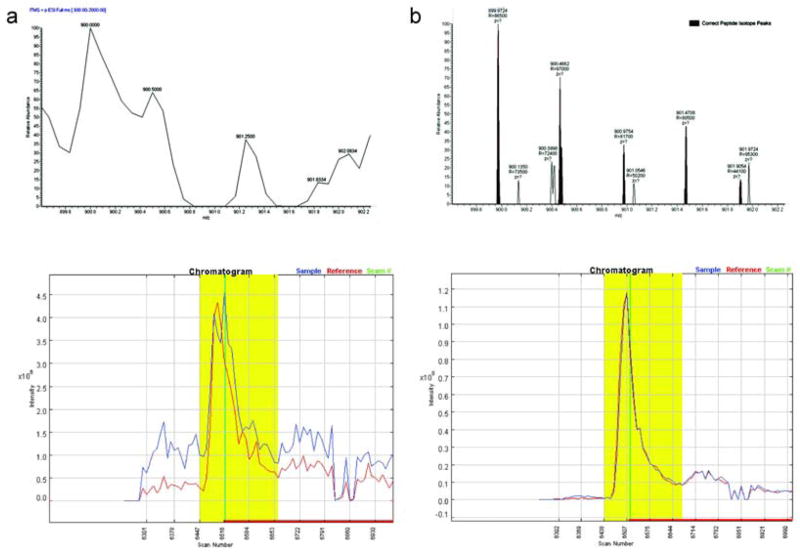
It is often impossible to distinguish isotopes in low resolution mass spectrometry data for large peptides or peptides with high charge states. Thus, it is common to simply sum up all ion intensities within the predicted isotope distribution’s m/z range. However, Census can take advantage of high resolution, and high accuracy data by accurately predicting peptide molecular weights and corresponding m/z values and employing a mass accuracy tolerance. By using this strategy, noisy peaks or co-eluting peptides can be excluded. The mass accuracy tolerance can be user-defined in the Census configuration file. To achieve this, Census employs two extraction methods: “whole isotope envelope” and “individual isotopes”. The first method is employed with low resolution data and extracts all peaks within the m/z range defined by the isotope envelope with greater than 5% of the calculated isotope cluster base peak abundance. The second method is employed with high resolution data and extracts individual isotopes using a mass accuracy tolerance. Noise peaks are easily excluded by these approaches, and as result, the correlation becomes high and the chromatograms are simple and track each other quite well (Fig. 2).
Figure 2.
Use of high mass accuracy for improved quantification. (a) was generated from LTQ MS scans using the “whole isotopic envelope” method for extraction and (b) was generated from Orbitrap MS scans using the “individual isotope” extraction method and a mass accuracy tolerance of 5 ppm. The green line in the chromatogram represents the identified scan, a close up of which is shown directly above the chromatograms.
Quantification using tandem mass spectrometry has been used extensively over the past three decades due to several key benefits including a reduction in chemical noise, increased specificity, and increased sensitivity (when trapping MS instruments are employed) over single stage MS. In addition, the presence of multiple fragment ions has potential benefits for quantitative analysis, where ion intensities from several transitions can be summed to produce signal to noise enhancements (14) or averaged to obtain more accurate measurements(15). Typically these experiments are performed in a directed fashion where precursor and MS/MS transitions are pre-determined. One of the difficulties inherent to this approach is the selection of fragment ions that are to be monitored. Alternatively, full MS/MS scans can be acquired and chromatograms can be reconstructed. Census facilitates automated quantification from tandem mass spectra by optimizing the process of chromatogram reconstruction. To do this, Census incorporates a filtering strategy that considers theoretical fragment ions and removes those that fall below a dynamic threshold. Remaining chromatograms are summed to increase sensitivity while selectivity is maintained by the filtering process. This strategy effectively filters noisy fragment ion chromatographic profiles in an automated fashion and can help to improve quantification of noisy or low abundant peptides (Supplementary Fig. 4 online).
As an initial evaluation of Census, we examined a collection of unlabeled and metabolically 15N labeled yeast standards that were mixed in known ratios (i.e., 1:1, 5:1, and 10:1) (Supplementary Table 2 and Data online). The ratios measured by Census were generally accurate for each of the standards analyzed (i.e., average ratios were 1.07, 5.30, and 12.27 for the 1:1, 5:1, and 10:1 standards respectively).
In addition, we compared two different approaches for calculating protein ratios. For the first approach, we simply used the mean of all peptide measurements. The second strategy employed a weighted average where the individual peptide weights were determined by the inverse square of the standard deviation of the measurement (Supplementary Information online). A comparison of these approaches shows the simple average approach underestimates the actual abundance for a large number of measurements whereas the weighted average provides more accurate protein abundance measurements (Supplementary Fig. 6 online). Census displays the weighted average for the protein abundance in a peptide distribution plot. This example shows how lower quality measurements (i.e., peptide ratios with low determinant factors) have less impact on the calculated protein abundance than high quality peptide measurements (i.e., high determinant factors).
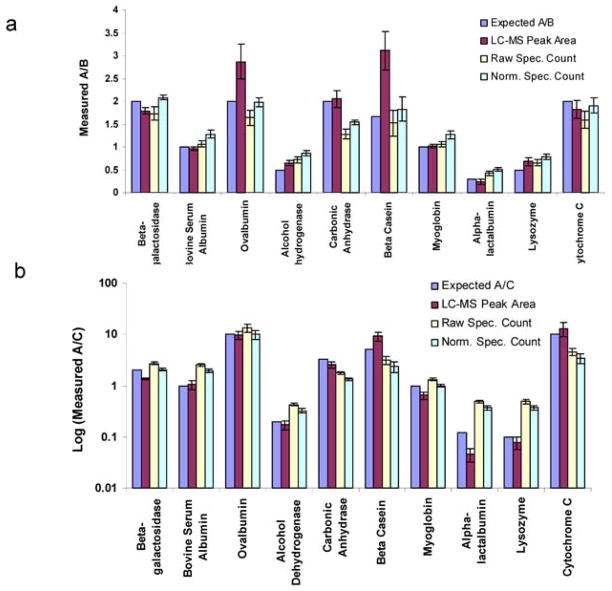
The general strategy for the main isotope free quantification method employed by Census is outlined in the experimental section and in Figure 1b. Peptides were evaluated after first taking the union of search results so that a peptide need only be identified in one of the replicates to be quantified. Census employs a Pearson correlation between MS spectra and dynamic time warping (Supplementary Information online) for chromatogram alignment. Census is able to perform quantitative analyses based on both spectral counting and an LC-MS peak area approach utilizing chromatogram alignment. To showcase the isotope free quantification capabilities of Census, four technical replicates of each sample of the 10 protein standard mixture (A-C) were analyzed with RP chromatography coupled to an LTQ-Orbitrap (Supplementary Information online and Table 3). A summary of the results from the analysis of the 10 protein mix datasets is shown in Figure 3. Using the MS based spectral alignment strategy; Census was able to accurately quantify ~70% percent of peptides (within a factor of two of the expected relative abundances). Protein abundance measurements were typically within 25% of the expected relative abundances, although the deviations for ovalbumin and β-casein were larger for unknown reasons (Fig. 3).
Figure 3.
Expected and measured relative abundances. They were obtained from the analysis of the 10 protein mix dataset for (a) mixture A over B and (b) mixture A over C using different strategies including LC-MS peak areas, spectral counting without normalization, and spectral counting with normalization. A total of four replicate analyses were performed for each mixture.
Spectral counting has been shown to be useful as a semi-quantitative measure of protein abundance. As seen in previous studies, relative abundances obtained from spectral counts generally correlate well with those obtained from peak areas although the accuracy tends to be slightly worse for the former approach.
In addition to profiling type experiments, Census is also able to perform quantification from tandem mass spectra. As an illustration of this capacity, two standard peptides labeled with iTRAQ reagents were mixed and quantified in three different mixtures (i.e., 1:1, 1:4, and 4:1) (Supplementary Information online). Because iTRAQ is often employed within the context of a data-dependent experiment, Census can be configured to calculate relative abundances using either reconstructed chromatograms or the relative intensities of the reporter ions from a specific identified tandem mass spectrum. In general, the results obtained using the chromaxtographic profiles were more reproducible and reliable, and led to more accurate quantification (Supplementary Fig. 7 online).
In cases where the intensity of either the light or heavy isotopomer is below the detection limit, the correlation coefficient is typically low. As a consequence, proteins with very large differences in abundances can be penalized by the low determinant scores (R2) of their respective peptide measurements. To address this limitation, Census uses a linear discriminant analysis to detect such singleton peptides (Supplementary Information online). To demonstrate this approach, we analyzed a sample from a two step affinity purification strategy targeting human RNA polymerase II which had been differentially labeled using SILAC.
We expected RNA polymerase and associated proteins would be preferentially enriched which would lead to a large abundance difference between the light and heavy isotopomers. Peptides derived from non-specific interactions would not be enriched and would have similar abundances. Common contaminants (i.e., keratin proteins) would be enriched in the light sample since they are not derived from the cell lines employed. Interestingly over 60% of peptides from the RNA polymerase isoforms identified had determinant scores (R2) > 0.5 suggesting that the linear regression technique is often applicable even when the S/N of the isotopmers is extremely low (Supplementary Fig. 8 online). Consequently all 6 identified RNA polymerase proteins were quantified as having large abundance changes even without the singleton strategy. However, when the singleton detection algorithm was employed, we were able to detect 12 of 15 keratin proteins and isoforms, whereas only 3 were detected using the linear regression approach. Using this approach with a threshold for the disciminant score of 0.94, 153 true singleton peptides with 6 false ones (4% false positive rate) and no non-singleton proteins (i.e. any proteins besides RNA polymerase and keratins) were detected. We are further working on singleton peptide detection methodology (Supplementary Information online).
Quantitative analysis has become increasingly popular and important in the field of proteomics research and has fostered the development of quantitative software to expedite and validate the data generated. Census was designed to be flexible enough to use with various types of quantitative experiments, fast, and accurate and has proved to be a valuable tool for quantitative analysis in our lab.
Supplementary Material
Supplementary Figure 1 The general design of Census.
Supplementary Figure 2 Peptide abundance ratio vs. correlation coefficients in natural log
Supplementary Figure 3 Chromatogram alignment
Supplementary Figure 4 Fragment ion filtering on tandem mass spectra
Supplementary Figure 5 Histograms of peptide ion abundance ratios
Supplementary Figure 6 A weighted mean vs. a simple mean
Supplementary Figure 7 iTRAQ measurements using the identified single tandem spectrum or from multiple tandem MS spectra
Supplementary Figure 8 Singleton peptide elution profile
Acknowledgments
The authors would like to thank J. Wohlschlegel and D. Cociorva for their comments and discussions about the manuscript and M. MacCoss for his insights and work developing RelEx. The authors would also thank S. Agarwalla and D. McMullan for sample preparation. S.K. Park is supported by NIH/NIAID Grant No. UOM/DMID-BAA-03. J.D. Venable is supported by a National Research Service Award (NIH) fellowship. T. Xu is supported by NIH Grant No DE016267. J.R. Yates is supported by NIH Grant No. RR11823.
References
- 1.Makarov A, Denisov E, Kholomeev A, Balschun W, Lange O, Strupat K, Horning S. Anal Chem. 2006;78:2113–2120. doi: 10.1021/ac0518811. [DOI] [PubMed] [Google Scholar]
- 2.Olsen JV, de Godoy LM, Li G, Macek B, Mortensen P, Pesch R, Makarov A, Lange O, Horning S, Mann M. Mol Cell Proteomics. 2005;4:2010–2021. doi: 10.1074/mcp.T500030-MCP200. [DOI] [PubMed] [Google Scholar]
- 3.Yates JR, Cociorva D, Liao L, Zabrouskov V. Anal Chem. 2006;78:493–500. doi: 10.1021/ac0514624. [DOI] [PubMed] [Google Scholar]
- 4.Denison C, Rudner AD, Gerber SA, Bakalarski CE, Moazed D, Gygi SP. Mol Cell Proteomics. 2005;4:246–254. doi: 10.1074/mcp.M400154-MCP200. [DOI] [PubMed] [Google Scholar]
- 5.Dieguez-Acuna FJ, Gerber SA, Kodama S, Elias JE, Beausoleil SA, Faustman D, Gygi SP. Mol Cell Proteomics. 2005 doi: 10.1074/mcp.M500137-MCP200. [DOI] [PubMed] [Google Scholar]
- 6.Foster LJ, Hoog CLd, Mann M. Proc Natl Acad Sci. 2003;100:5813–5818. doi: 10.1073/pnas.0631608100. [DOI] [PMC free article] [PubMed] [Google Scholar]
- 7.Venable JD, Wohlschlegel J, McClatchy DB, Park SK, Yates JR., 3rd Anal Chem. 2007;79:3056–3064. doi: 10.1021/ac062054i. [DOI] [PMC free article] [PubMed] [Google Scholar]
- 8.Eng JK, McCormack AL, Yates JR., III Journal of the American Society for Mass Spectrometry. 1994;5:976–989. doi: 10.1016/1044-0305(94)80016-2. [DOI] [PubMed] [Google Scholar]
- 9.Sadygov RG, John R, Yates I. Analytical Chemistry. 2003;75:3792–3798. doi: 10.1021/ac034157w. [DOI] [PubMed] [Google Scholar]
- 10.Tabb DL, Saraf A, Yates JR., 3rd Anal Chem. 2003;75:6415–6421. doi: 10.1021/ac0347462. [DOI] [PMC free article] [PubMed] [Google Scholar]
- 11.Geer LY, Markey SP, Kowalak JA, Wagner L, Xu M, Maynard DM, Yang X, Shi W, Bryant SH. J Proteome Res. 2004;3:958–964. doi: 10.1021/pr0499491. [DOI] [PubMed] [Google Scholar]
- 12.MacCoss MJ, Wu CC, III, JRY Analytical Chemistry. 2003;75:6912–6921. doi: 10.1021/ac034790h. [DOI] [PubMed] [Google Scholar]
- 13.Venable JD, Dong MQ, Wohlschlegel J, Dillin A, Yates JR. Nat Methods. 2004;1:39–45. doi: 10.1038/nmeth705. [DOI] [PubMed] [Google Scholar]
- 14.Owens KG. Applied Spectroscopy Reviews. 1992;27:1–49. [Google Scholar]
- 15.Arnott D, Kishiyama A, Luis EA, ludlum SG, Jr, JCM, Stults jT. Molecular and Cellular Proteomics. 2002;1:148–156. doi: 10.1074/mcp.m100027-mcp200. [DOI] [PubMed] [Google Scholar]
Associated Data
This section collects any data citations, data availability statements, or supplementary materials included in this article.
Supplementary Materials
Supplementary Figure 1 The general design of Census.
Supplementary Figure 2 Peptide abundance ratio vs. correlation coefficients in natural log
Supplementary Figure 3 Chromatogram alignment
Supplementary Figure 4 Fragment ion filtering on tandem mass spectra
Supplementary Figure 5 Histograms of peptide ion abundance ratios
Supplementary Figure 6 A weighted mean vs. a simple mean
Supplementary Figure 7 iTRAQ measurements using the identified single tandem spectrum or from multiple tandem MS spectra
Supplementary Figure 8 Singleton peptide elution profile


