

Abstract
The regulation of striated muscle contraction involves cooperative interactions between actin filaments, myosin-S1 (S1), tropomyosin (Tm), troponin (Tn), and calcium. These interactions are modeled by treating overlapping tropomyosins as a continuous flexible chain (CFC), weakly confined by electrostatic interactions with actin. The CFC is displaced locally in opposite directions on the actin surface by the binding of either S1 or Troponin I (TnI) to actin. The apparent rate constants for myosin and TnI binding to and detachment from actin are then intrinsically coupled via the CFC model to the presence of neighboring bound S1s and TnIs. Monte Carlo simulations at prescribed values of the CFC stiffness, the CFC’s degree of azimuthal confinement, and the angular displacements caused by the bound proteins were able to predict the stopped-flow transients of S1 binding to regulated F-actin. The transients collected over a large range of calcium concentrations could be well described by adjusting a single calcium-dependent parameter, the rate constant of TnI detachment from actin, k
−I. The resulting equilibrium constant
Electronic supplementary material
The online version of this article (doi:10.1007/s00249-012-0859-8) contains supplementary material, which is available to authorized users.
Keywords: Tropomyosin chain, Myosin-S1 binding, Ca2+ sensitivity, Stopped flow
Introduction
The contractility of striated muscle is regulated by calcium-dependent azimuthal movements of tropomyosin–troponin complexes over the surface of the actin filament. In the steric blocking model (Squire 1981), the affinity of myosin for regulated F-actin is controlled by tropomyosin (Tm), where each Tm protomer spans seven actin sites on the same strand of the actin double helix. This fact alone suggests an explanation for the observed autocooperativity of myosin binding (Bremel and Weber 1972; Greene and Eisenberg 1980; Lehrer and Morris 1982; Metzger 1995; Tobacman and Butters 2000), because the binding of one myosin displaces the tropomyosin to a new azimuthal orientation which allows myosin binding to the other six actin sites. While this two-state model is consistent with a variety of experiments (Gordon et al. 2000), the fact that myosin weakly binds to actin in the absence of calcium suggests that this model is incomplete and that a third state, in which weak myosin binding is permitted, might be necessary. Based on studies of myosin-S1 binding to regulated F-actin in solution, McKillop and Geeves proposed a model with three regulatory states: blocked, closed, and open (McKillop and Geeves 1993). The blocked state prohibits any myosin binding, the closed state permits weak myosin binding as observed at low Ca2+, and the open state permits both weak and strong myosin binding. The corresponding azimuthal orientations of tropomyosin were also observed in cryo-electron microscopy (cryo-EM) studies (Vibert et al. 1997), and they were designated by Lehman et al. (2000) as B (blocked), C (calcium-induced), and M (myosin-induced). In the McKillop–Geeves notation, C and M states correspond to the closed and open states, respectively.
An assumption common to these regulatory models (Gordon et al. 2000; McKillop and Geeves 1993) is that each tropomyosin molecule can be treated as a rigid unit moving between two or three discrete orientations, each generating different actin affinities for myosin. Thus, the size of the cooperative unit was structurally defined by the length of one tropomyosin molecule. However, affinity data for myosin binding in solution showed that the size of the functional cooperative unit could be very different from the 40 nm size of one tropomyosin molecule (Maytum et al. 1999). Moreover, structural data show that adjacent tropomyosins along the thin filament overlap slightly (Lorenz et al. 1995; Murakami et al. 2008; Palm et al. 2003; Vibert et al. 1997). Thus, the assumption of independently acting cooperative units is not viable. A model with attractive end-to-end interactions between tropomyosins was formulated by Hill et al. (1980), accounting for the possibility that all tropomyosins along one strand of F-actin form a chain of interacting rigid units with two possible orientations. In this model, the rigid unit moving between two discrete orientations generates different actin affinities for myosin and the weak end-to-end interactions between adjacent tropomyosins favor states (i.e., Tm positions on actin) of the same kind. Alternatively, the bending compliance of an individual Tm may be extended via the linked ends. In this case, the elastic bending compliance of the assembly is located in the overlap of Tm–Tm regions linked to the tail of Troponin T (TnT) so that the assembly can be viewed as a continuous flexible chain (CFC) (Lehrer et al. 1997). Convincing evidence for the latter model comes from recent cryo-EM studies with increased axial resolution (Pirani et al. 2005) which show some tropomyosins lying between the three orientations previously observed.
In the CFC model developed by Smith et al. (Smith 2001; Smith and Geeves 2003; Smith et al. 2003) the closed state of the McKillop–Geeves model (McKillop and Geeves 1993) is replaced by a global state of all thermally excited configurations of the bent chain. Each bound myosin after isomerization generates a locally defined open state where the chain is displaced away from its resting orientation and the resulting kink in the chain facilitates additional myosin binding to other sites under the kink. The size of the kink, analogous to the size of the cooperative unit, is at least twice the persistence length of the confined chain. This cooperativity is a consequence of axial propagation of the chain displacements along the actin filament strand by one or more strongly bound myosin-S1s.
At low calcium, myosin binding is inhibited through the troponin attached to each Tm because the Tm chain is azimuthally displaced into a local blocked state by TnI bound to actin (Fig. 1). There may also be cooperative inhibition when the persistence length of the chain exceeds the 36 nm spacing between adjacent bound Tns. At high calcium, two calcium ions bind to a (skeletal muscle) Tn, and the Tn undergoes an allosteric transition, causing its detachment from actin (Gagne et al. 1995; Tripet et al. 1997). After release of Tn from actin, the unconstrained Tm chain moves into its energetically favorable position, i.e., into the closed state. The CFC model has been tested against myosin equilibrium binding data in solution (Smith and Geeves 2003; Smith et al. 2003), and it was found that calcium-regulated binding of TnI to actin provides a reasonably complete model of thin filament regulation in solution.
Fig. 1.
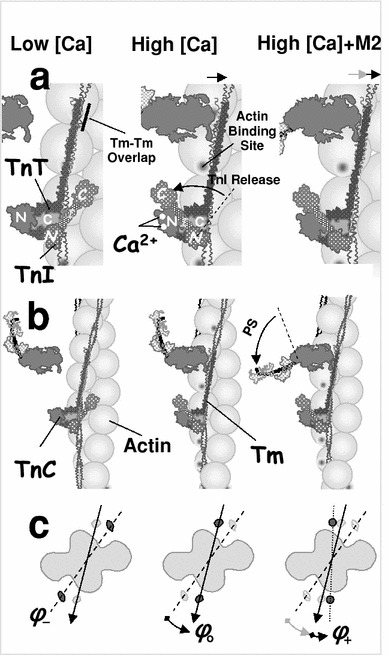
Schematic structure of the regulated A-Tm–Tn filament, showing a single chain of sequentially connected Tm molecules. TnT is bound to one end of Tm, and its N-terminus overlaps the adjacent Tm. The C-terminus of TnC and the N-terminal of TnI are bound to TnT. At low calcium, the C-terminal of TnI is bound to actin, fixing the Tm chain at an azimuthal angle ϕ −. At this position, the Tm chain overlaps the actin binding site and blocks myosin binding (a, left). When two calcium ions are bound to TnC (+Ca2+), the hands of the N-terminal region of TnC are open and bind a region of TnI near its C-terminus, reducing affinity of TnI to actin. The TnI rotates away from its actin binding site and allows that Tm units only weakly interact with actin. The Tm moves toward its equilibrium position at ϕ o, partially opening the actin site (a, middle), permitting weak myosin binding to actin (b, middle). Thermally induced fluctuations in the azimuthal angle of Tm permit strong myosin binding to actin, displacing the Tm chain to ϕ +. The arrows on the top of (a) denote the Tm shifts after binding Ca2+ and strong binding of myosin respectively (from left to right). The azimuthal movement of Tm on the actin surface and three characteristic angular positions are denoted in (c). Based on models of Gagne et al. (1995) and Tripet et al. (1997)
To further investigate the applicability of the CFC model to data in solution we developed a Monte Carlo method to simulate the time course of myosin binding to actin as observed in stopped-flow mixing experiments. To do this, the CFC model is first used to predict the regulation of myosin–actin binding rates as well as myosin–actin affinity. The basic idea is that thermal fluctuations in the CFC orientation are much faster than myosin kinetics, so the effective binding rate is regulated by the fraction of time in which the CFC has moved past the closed angle ϕ o (Fig. 1). This time fraction is controlled by nearby chain orientations, and will be increased if myosins are bound to adjacent actin sites or decreased if nearby Tns are bound to actin. In our Monte Carlo procedure, the state of all actin monomers along F-actin strands (free, occupied by myosin or by troponin) are specified and tracked in time through a stochastic implementation of the underlying kinetics. Thus, the CFC model in conjunction with Monte Carlo methods provides a theoretical framework for evaluating thin filament regulation of actin–myosin interactions, including the various cooperativities: (1) myosin–Tm CFC cooperativity imposed by accelerated strong myosin binding, (2) myosin binding inhibition by Tn–Tn cooperativity, and (3) slowing down of myosin binding observed at later stages of stopped-flow transients when the myosin concentration exceeds that of actin.
Methods
Following the approach of Smith et al. for modeling thin filament regulation as a CFC (Geeves et al. 2011; Smith 2001; Smith and Geeves 2003; Smith et al. 2003), we developed a Monte Carlo algorithm to quantify spatially explicit myosin-S1 binding to regulated F-actin in solution. The algorithm consists of three main steps: (1) calculation of the state transitions between actin–Tn states as a function of [Ca2+], (2) calculation of mean CFC angular positions and their azimuthal fluctuations along the actin filament, and (3) calculation of state transitions between actin-S1 states. These processes are interrelated and regulated by the calcium concentration. The CFC position and its fluctuations modulate the original state transition rates of Tn binding to actin or myosin-S1 binding to actin, whereas the spatial position of pinning sites at which the Tn and myosin-S1 are bound to actin determines the mean Tm chain angular position and the thermally induced azimuthal fluctuations.
Structurally, the Tm molecule is a coiled coil of about 40 nm in length, covers seven monomers on one strand of the actin double helix, and is associated with one Tn molecule. On each strand of F-actin, the TmTn units overlap and interact with the adjacent units, forming the appearance of a CFC (Lorenz et al. 1993; Vibert et al. 1997). The associated troponin molecule consists of three subcomponents: troponin T, troponin C and troponin I, denoted as TnT, TnC, and TnI, respectively (Fig. 1). One end of TnT is bound to a specific site on Tm, and its N-terminus overlaps the adjacent Tm. In the absence of calcium the N-terminal region of TnC is closed and the C-terminal of adjacent TnI is bound to actin, prohibiting Tm movement, i.e., holding Tm in the “blocked” state. Thus, in relaxed muscle, TnI holds Tm in an azimuthal position ϕ − that sterically blocks myosin-S1 binding sites on F-actin. In the presence of Ca2+, binding of one or two Ca2+ ions to TnC generates a conformational change in TnI, lowering the affinity of TnI to F-actin. The release of the TnI C-terminus from F-actin now allows the unconstrained Tm chain to move toward the “closed” state, i.e., the azimuthal position ϕ o, favoring myosin binding to F-actin (Fig. 1) and, therefore, muscle contraction (Smith and Geeves 2003; Vibert et al. 1997).
The flexibility of the Tm chain and its weak interaction with F-actin permit thermally induced fluctuations in the azimuthal position of the Tm chain, except at the constrained (pinning) sites where TnI is bound to actin or when the CFC is displaced by bound myosin. The mean CFC angular position and its azimuthal fluctuations along the actin filament are, therefore, determined by the position of the pinning sites induced by TnI binding to actin and by myosin-S1 binding to actin. The azimuthal movement of the CFC chain around the current mean position of the Tm chain permits myosin binding to actin only at those instances in time when the actin sites are not blocked by the CFC. Therefore, the probability of this state transition at a specified spatial location along the actin filament is proportionally reduced. Thus, the dynamic movement of the continuous Tm chain on the actin surface modifies myosin binding rates in proportion to the fraction of time when the actin sites are available for binding. In turn, bound myosin heads and TnI bound to actin restrict the motion of the Tm chain and, therefore, affect the mean configuration of CFC and its fluctuations. Regulation by this scheme is a dynamic process that couples the reaction rates to the current CFC configuration, and this configuration explicitly depends on the spatial positions of currently bound myosin-S1s and TnIs. Even so, this system can be described as a Markov process1 if the time increments are sufficiently small that not more than one binding or unbinding transition per actin filament occurs within the current time step.
For the simulation of myosin binding transients to regulated actin we set up a Monte Carlo algorithm considering each of the continuous tropomyosin chains on a single strand of actin monomers on F-actin as an independent subsystem. In this setting, tropomyosin is associated with the actin filament via a Tn molecule at every seventh monomer, starting from the third actin monomer from left to right (Fig. 2). Each actin filament contains two CFCs, and each CFC has the prescribed number of Tm–Tn complexes. The binding of TnI to actin fixes the continuous tropomyosin chain at the so-called TnI pinning points at an angle ϕ −. The number of TnI pinning points depends on the calcium concentration and is modulated by the number and position of bound myosin-S1s. Weak binding of myosin-S1 to actin blocks the CFC movement in an azimuthal direction toward ϕ ≤ ϕ o and therefore reduces the rebinding rate of TnI to actin. At a fixed Ca2+ concentration, the spatial distribution of the positions of bound TnIs is a dynamic process and changes depending on the degree of Ca2+ binding to TnC and the subsequent release of TnI from actin. Another restriction on the CFC movement is imposed by the strongly bound myosin-S1s at azimuthal positions ϕ + (Fig. 1).
Fig. 2.
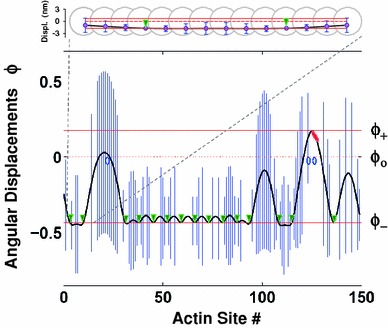
Mean and standard deviation (SD) of the angular displacements of CFC at calcium concentration of 6.6 μM at 0.17 s after injection of 0.25 μM myosin-S1 in 2.5 μM solution of F-actin. Mean angular displacements,
CFC angular position and its variance
We modeled Tm interactions with the actin surface in the presence of Tn via a loosely confined quasicontinuous semiflexible chain. The CFC spans one strand along the whole length of the actin filament (Fig. 1). For simplicity, the Tm chain is assumed to be elastically homogeneous, and the potential well that provides angular confinement has a single minimum in the absence of constraints imposed by myosin-S1 or Tn bound to actin. These assumptions provide the basis for the mathematical formulation and a qualitative description of how Tm regulates the energetics of myosin binding in the presence of Tn and varying calcium concentrations.
The displacements of the Tm–Tn chain are determined by the energy of chain kinks, the chain elasticity, and the energy landscape of the interaction of the Tm–Tn chain with actin. We use Feynman’s integral to calculate the potential energy of the Tm-Tn chain interacting with actin and myosin (Feynman and Hibbs 1965; Smith 2001). The governing equation of the continuous tropomyosin chain is the expression for the energy of a distorted chain of length L with angular displacement
| 1 |
The parameter κ specifies a bending stiffness of the chain, and the parameter α specifies the curvature of a quadratic potential which serves to confine the chain to the “groove” between the strands of the actin double helix. The mean configuration of the closed state sits at the bottom of the confining potential at the angle ϕ o = 0. At the positions where a myosin is strongly bound to actin, the chain is assumed to be pinned at an angle ϕ + > 0, giving a local open state. Where a TnI on the chain is bound, the chain is pinned in the opposite direction at angle ϕ − < 0, a local blocked state. The opposing signs guarantee that the blocked, closed, and open states correspond to the three orientations seen in cryo-EM micrographs.
The potential energy functional (Eq. 1) defines the path of minimum energy (Feynman and Hibbs 1965) for the confined worm-like chain with pinning sites of bound TnIs or myosin-S1s at defined axial positions along F-actin (Smith 2001). In between the pinning sites, the minimum energy path satisfies the corresponding Euler–Lagrange equation
| 2 |
where
The configuration of a whole CFC is defined by the positions of bound molecules of myosin-S1 and TnI and their respective angular displacements ϕ
+ and ϕ
−. Because the analytic expressions for the functions
Chain-regulated kinetics
The current model features two biochemical Tn–actin states, one in which TnI is bound to actin and thus, in conjunction with TnT, maintains the position of Tm, inhibiting myosin-S1 binding, and the other where TnI is not bound to actin, thus allowing the Tm chain to move azimuthally along the actin surface. These biochemical states are associated with the three structural states, namely B (blocked), C (closed), and the open or M-state (Lehrer et al. 1997; Maytum et al. 1999; McKillop and Geeves 1993), and they are modulated by actin–myosin states which include free (unoccupied) actin sites, and weakly and strongly bound myosin-S1 states. The closed state is induced by the confined energy landscape, which mimics the electrostatic interaction between Tm and actin, and is located at the minimum of the confinement potential at ϕ o = 0. When Tm is in the closed state, myosin-S1 can weakly bind to actin. This binding prevents movement of Tm for ϕ ≤ ϕ o at that location, and the sparsely populated myosin-S1 state strictly prevents TnI rebinding if the TnI binding site is on the same actin monomer. Our model allows for two-step myosin binding to actin. The second step provides the transition from weak to strong binding, when ϕ ≥ ϕ +, forming the open state. This transition is rapid and rather irreversible.
We assume that only the rate constants of TnI binding to actin, k I, and of weak and strong S1 binding to actin, k M1 and k M2, respectively, are regulated by the CFC, while the detachment rates k −M1 and k −M2 are unregulated. The detachment rate of TnI from actin, k −I, is strictly regulated by Ca2+ and is not modulated by the CFC configuration. The regulated rate constants may be expressed in terms of multiplicative factors that represent the fraction of time that the CFC is at orientations that permit binding. This statement applies only if the CFC movements are rapid with respect to binding kinetics, as shown in Table 1. The response time of the CFC to local perturbations is certainly much less than the 1 ms resolution time of stopped-flow responses (Geeves and Lehrer 1994) and is expected to be of the order of 10−5 s. Thus, the CFC movements are very rapid compared with myosin binding rates (Geeves and Lehrer 1994), and probably also with respect to TnI binding.
Table 1.
Values of the Tm–Tn chain parameters κ, α, ξ, and σ o and the rates of state transition constants, estimated as described in the main text
| Values of key model parameters | ||
|---|---|---|
| Tropomyosin pinning angle | ϕ − | −25° |
| Myosin imposed Tm angular displacement | ϕ + | 10° |
| Tropomyosin persistence length |
|
150 nm |
| Tropomyosin–troponin persistence length |
|
250 nm |
| Bending stiffness of Tm–Tn chain per unit length | κ TmTn | 9.87 × 10² pN nm2 |
| Angular Tm bending stiffness per unit length | κ | 2.0 × 10⁴ pΝ nm4 |
| Persistence length of Tm–Tn confined chain | 1/ξ | 22.2 nm |
| Angular standard deviation of free chain | σ ο | 29.7° |
| Strength of the chain confining potential | α | 0.341 pN |
| Myosin–actin binding rate |
|
4.2 × 10⁶ M−1 s−1 |
| Myosin detachment rate | k −M1 | 20 s−1 |
| Myosin stroke rate |
|
500 s−1 |
| Reverse stroke rate | k −M2 | 5 s−1 |
| TnI–actin binding rate |
|
100 s−1 |
| TnI–actin detachment rate at high Ca2+ | k −I | ~1,200 s−1 |
κ was obtained from the persistence length
The values for ϕ − and ϕ + are taken from (Poole et al. 2006; Vibert et al. 1997)
The estimate of κ
TmTn is obtained from the tropomyosin persistence length
The detachment of TnI from actin and the reattachment of TnI to actin are strongly dependent on the Ca2+ concentration. It is also likely that both the detachment and reattachment rates of TnI are strain dependent. For a specified Ca2+ concentration, the equilibrium constant,
Because the details of these processes are largely unknown, we implemented in our algorithm the following simplified approach: (1) the rate of TnI detachment, k
−I is a function of Ca2+ concentration only, and (2) the rate of TnI attachment to actin is a weighted function of the rate of TnI binding to actin from the closed state,
| 3 |
Here, s
i denotes the discrete position of actin site i along an actin filament strand, and σ
i is the angular standard deviation of the CFC, σ
ϕ (x
i, y
i), at the location of site i. The attachment rate of TnI from the closed state is denoted as
| 4 |
The arguments of these functions were calculated in the pair approximation as defined in Geeves et al. (2011), Smith (2001), and Smith and Geeves (2003), so
For S1 binding to actin, let k
M1 be the rate constant for weak myosin-S1 binding to F-actin when the CFC may occupy a range of closed positions, ϕ ≥ ϕ
o and let k
M2 be the state transition rate constant from weak to strong binding when the CFC is in a range of open positions, ϕ ≥ ϕ
+. The rates of S1 binding to actin and the isomerization are weighted functions of the corresponding transition rates,
| 5 |
Here, the weighted functions are proportional to the fraction of time when these transitions are possible, i.e., to the probabilities that the CFC is at positions ϕ ≥ ϕ o for S1 binding and at positions ϕ ≥ ϕ + for isomerization:
| 6a |
and
| 6b |
The functions
Monte Carlo simulations
We employed the standard Metropolis algorithm where a kinetic transition in time Δt is implemented when a random number in (0, 1) lies in the range (0, k∆t), where k is the first-order transition rate constant. This algorithm generates a Markov process if
It is assumed that the thermal motions follow a normal distribution around the CFC mean position
Fig. 3.
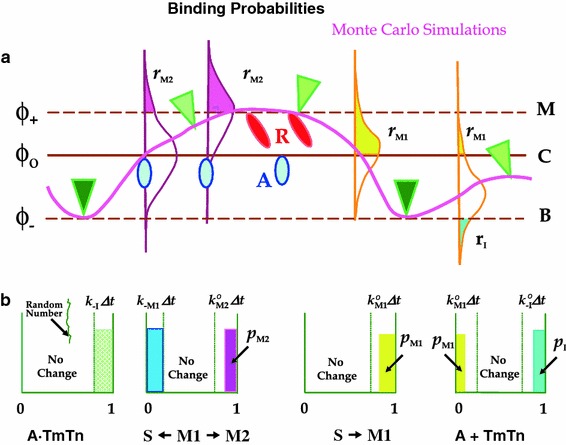
Monte Carlo simulations: construction of state transition probabilities. a The mean position of the CFC,
The parameter δ defines the negative cooperativity affecting inhibition of the myosin binding rate, which is presumably caused by a steric hindrance imposed by previously bound myosin-S1s. The process of crowding is especially important at higher occupancy of actin sites (>50 %) when considerable slowing of myosin-S1 binding is observed. Computational tests showed that reasonably good fits of excess myosin binding isotherms can be achieved by introducing a parameter δ defined as
| 7 |
where
Model parameters
The mechanical parameters κ and α of the unpinned CFC were estimated as follows (see also Table 1). The angular CFC bending stiffness per unit length (Eq. 1) is calculated as
Table 1 also lists rate constants for the unregulated transitions and optimum rate constants for the regulated ones. The second-order myosin binding rate constant allows simulations to be made at different concentrations of myosin-S1, chosen to match the experimental data with excess myosin or excess actin ([S1]/[A] = 10 or 0.1) (Boussouf et al. 2007a, b). To allow for the progressive depletion of free myosin-S1 during binding, k M1 is proportional to [M] = [Mtot] − [AM] = [Mtot] − f[Atot], where f is the fraction of actin sites occupied by myosin. Here, [AM] denotes all actomyosin states; i.e., it includes both weakly and strongly bound myosin states. The probability of detaching the bound myosin is assumed to be constant. In all simulations, the value of ∆t was set at 10−5 s; the number of CFCs was 2,000, corresponding to 1,000 actin filaments, for excess actin and 200 (i.e., 100 actin filaments) for excess myosin-S1. Although filaments of various lengths were present in the solution experiments, the simulation results were not sensitive to filament length. For simplicity we assumed 100 TnTm units per actin filament strand, i.e., 700 actin monomers, corresponding to actin filament length of 3.85 μm.
Assessment of Ca2+ parameters from two sets of stopped-flow data
The model predictions were tested against measurements of the fluorescence intensity of pyrene-labeled actin during kinetic (stopped-flow) experiments. These experiments have been described in detail in published work (Boussouf et al. 2007a, b; Boussouf and Geeves 2007), and the data used here were reported in Mijailovich et al. (2012). We will briefly here describe the experimental methods used. The proteins were all prepared from rabbit fast skeletal muscle. Myosin-S1 was prepared by chymotryptic digestion of myosin and column purified to isolate the A1 light chain isoform. Actin was prepared from a muscle acetone powder (Spudich and Watt 1971) and was labeled with pyrene to >90 % at Cys374 as described by Criddle et al. (1985). A Tm–Tn complex was isolated from the same acetone powder used for the actin preparation as described by Ebashi et al. (1971) and Greaser and Gergely (1971).
In stopped-flow experiments, fluorescently labeled (regulated) actin filaments in solution are first equilibrated at a specific Ca2+ concentration and then mixed with myosin-S1. The change in pyrene fluorescence (excitation at 365 nm, emission at 405 nm) was recorded at each calcium concentration, and we collected two sets of data: one for excess myosin ([S1]/[A] = 10) and the other for excess actin ([S1]/[A] = 0.1). All data were collected at 20 °C in a buffer containing 100 mM KCl, 5 mM MgCl2, and 20 mM 3-(N-Morpholino)propanesulfonic acid (MOPS) pH 7.0. The calcium concentration was controlled by the addition of ethylene glycol tetraacetic acid (EGTA) and calcium-saturated EGTA at 2 mM to give the required free calcium concentration.
Procedure for estimation of CFC model parameters
The model predictions were tested against measurements of the pyrene fluorescence intensity during the stopped-flow experiments described above. In these experiments a drop in pyrene fluorescence is proportional to myosin binding to actin in the R-state. Thus, the calculated instantaneous fractions of actin sites that are not occupied or which are in the A-state (i.e., which are not in the R-state), denoted
By fitting sets of the stopped-flow data for excess myosin or excess actin ([S1]/[A] = 10 or 0.1) for a range of Ca2+ concentrations, we estimated a single free parameter, the TnI detachment rate constant k −I, as a function of Ca2+ concentration and the [S1]/[A] ratio. Establishing the dependence of the equilibrium constant K I on Ca2+ concentration in solution could serve as a basis for developing models of thin filament regulation in muscle fibers.
Results
The predicted time courses of myosin binding to regulated actin filaments show evidence of cooperativity, in much the same way that titration data do for the equilibrium fraction of myosin-occupied sites (Maytum et al. 1999). The initial binding response is relatively slow because binding is inhibited by the Tm chain, and is then accelerated by increased accessibility of opened actin binding sites by the shift of Tm-Tn chain in the neighborhood of the first bound myosin. This myosin–myosin cooperativity is most evident at low calcium with a high concentration of myosin-S1.
With excess actin, the observed binding transients at different calcium levels were all fitted by Monte Carlo simulations in which the only varied parameter was the detachment rate of TnI from actin, k
−I, which strongly depends on Ca2+ concentration (Fig. 4). The one-parameter fit was possible because unregulated or optimal myosin rates were carefully chosen to match equivalent titration data and/or transient data at high calcium. The precise value of the reattachment rate, k
I, is not important because TnI is in rapid equilibrium with actin on the time scale of myosin binding, so data fitting is controlled by the equilibrium constant
Fig. 4.
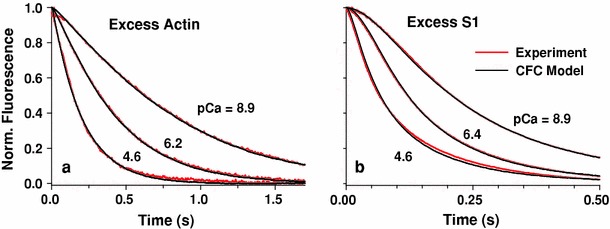
Best fits of the CFC model (black lines) to stopped-flow data (red lines) of myosin-S1 binding to actin in solution at high, low, and an intermediate concentration of Ca2+. a Excess-actin concentration ([actin] = 2.5 μM, [S1] = 0.25 μM). The estimated K B values for pCa of 8.9, 6.2, and 4.6 are 0.12, 0.47, and 11.89, respectively. b Excess myosin-S1 concentration. ([actin] = 0.5 μM, [S1] = 5.0 μM). The estimated K B values for pCa of 8.9, 6.4, and 4.6 are 0.11, 0.36, and 11.89, respectively. The parameters used in the simulations are given in Table 1
Having matched model predictions to the experimental transients at different calcium levels, the equilibrium constant
Fig. 5.
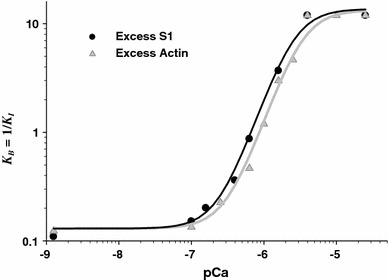
Calcium dependence of the equilibrium rate constant of Tn unbinding and rebinding
The Monte Carlo method provides an explicit realization of the molecular state of the regulated filament at each time step, which is instructive for understanding how the model operates in detail. Figure 6a shows the evolution of CFC conformations at low calcium for both excess actin and excess S1. At early times, a few myosins bind under a chain initially pinned at nearly all TnI–actin sites (blocked states). In most cases, myosin binding forces the detachment of the nearest TnIs, shifts CFC toward larger ϕ values, and permits additional myosin binding. Also, bound myosin prevents those detached TnIs from reattaching. As the steady state is approached, clusters of bound myosins form under a single kink of the bent chain. With excess myosin (Fig. 6a, middle panel), these processes are accelerated in time and the final state is one in which the filament is nearly saturated with myosin, where the chain is pinned primarily in the open position with only a few isolated regions where the chain is pinned by bound TnIs. Plots of site occupancies, at the same four time points on 13 actin filaments (i.e., 26 strands), with each row representing a strand of an actin filament, are shown in Fig. 6b; clustering is clearly evident at early times of the excess-myosin simulation when occupancy of actin sites is less than 50 %. In both cases, when clustering is present, the size of the regulatory unit is larger than the structural unit of seven actin monomers.
Fig. 6.
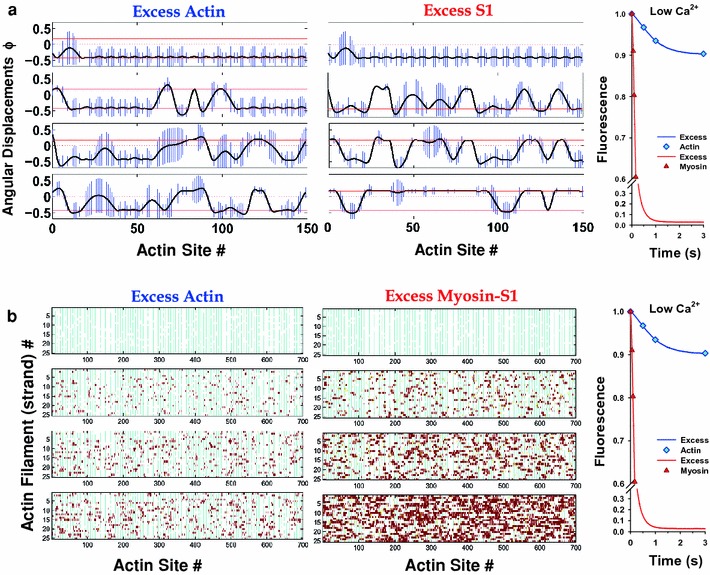
a Angular displacements, ϕ −, along a strand of an actin filament at low calcium (pCa = 8.9 case) at four time points of a stopped-flow transient for excess actin and for excess myosin. Only a part of the whole strand associated with CFC is shown (150 actin monomers). The bars represent standard deviation of CFC position due to thermal fluctuation. Four characteristic plots for four different times for each excess actin and excess myosin-S1 are shown. The time points at which graphs are sequentially collected are shown at pyrine fluorescence transients (right). In absence of myosin-S1, most of the CFC is pinned at every seventh actin binding site at angular position ϕ − where CFC fluctuations are equal to zero. Strongly bound myosin favors binding of myosin to neighboring actin sites, forming long patches of the CFC in the open position, ϕ +, where bound myosins cluster, and patches of CFC in the blocked position, ϕ −. b The distribution of troponin–actin and myosin–S1-actin states during stopped-flow transients at low calcium (pCa = 8.9) for excess actin and for excess myosin. Four characteristic plots for four different times are shown for excess actin and for excess myosin-S1. The time points at which graphs are sequentially collected are shown at pyrine fluorescence transients (right). Each row represents a strand of an actin filament displaying 26 strands, i.e., 13 actin filaments. Each actin strand contains 700 monomers and 100 TnI binding sites. Unoccupied actin sites are white, troponin bound sites are denoted by cyan bars, weakly bound myosin-S1 as yellow bars, and strongly bound myosin-S1 as dark-red bars. The clusters of strongly bound myosin-S1 are clearly visible
At high calcium, the picture is primarily one of myosin-based cooperativity and clustering (Fig. 7). Now the initial state is mainly that of the free chain in angular position at the minimum of the confining potential, ϕ o, analogous to the closed state of the McKillop–Geeves model, although two instances of bound TnIs are present in the excess-actin simulation shown. Both these blocked regions disappear as myosin binding proceeds, demonstrating that myosin is seven times more powerful than TnI in moving the chain through sheer force of numbers, even if their affinities are about the same. With excess myosin (Fig. 7a, middle panel), the filament saturates with myosin more quickly, giving holes of closed state in a line of open states. However, TnI can still bind weakly to actin and has taken the opportunity to do so (see the bottom right-hand graph in Fig. 7a) where there is a comparative absence of bound myosins. The site occupancies (Fig. 7b) show a much more random distribution of bound myosin-S1 than at low Ca2+ even in early stages of the binding process, suggesting that at high calcium most of the regulatory units are open and clusters of bound myosin-S1 appear sparsely distributed, especially in the case of excess myosin.
Fig. 7.
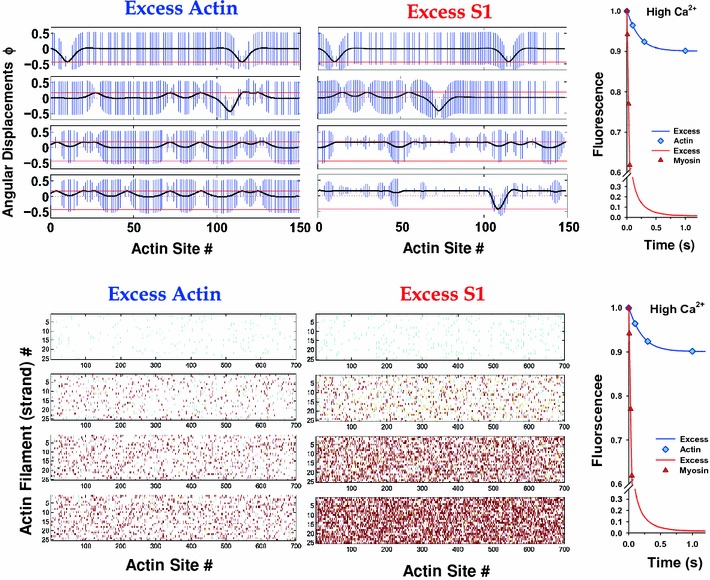
a Angular displacements along a strand of an actin filament at high calcium (pCa = 4.6) at four time points of stopped-flow transients for excess actin and excess myosin. The plots are displayed in the same way as in Fig. 6a. In absence of myosin-S1 only sparse bound TnI keeps the CFC pinned at ϕ −, while the majority of the CFC length sits at closed position at ϕ o = 0. In presence of myosin-S1, strongly bound myosin pushes CFC to open position, ϕ +. b The distribution of troponin–actin and myosin-S1 states during stopped-flow transients at high calcium (pCa = 4.6) and for both excess actin and excess myosin. The plots are displayed in the same way as in Fig. 6b. Because of sparse pinning of the CFC by TnI, the CFC is mostly in the closed and open states, permitting random binding of myosin-S1; consequently, clustering of bound myosin-S1 is not observed
Discussion
The spatially explicit model of thin filament regulation developed here, based on the theoretical work of Smith et al. (Geeves et al. 2011; Smith 2001; Smith and Geeves 2003; Smith et al. 2003), provides a structurally based rather than empirically based description of the cooperative effects of myosin binding to regulated actin in solution. The key advance in the current work is the introduction of a CFC (Smith et al. 2003) instead of the widely used, seven actin monomer long, TmTn rigid units with or without empirically induced cooperativity between the neighboring units (Chen et al. 2001; Hill et al. 1980; McKillop and Geeves 1993; Mijailovich et al. 2012). Extending the approach of Smith et al. (Smith 2001; Smith and Geeves 2003; Smith et al. 2003), we developed a Monte Carlo algorithm to quantify spatially explicit myosin-S1 binding to regulated F-actin in solution. By fitting the model predictions to a set of stopped-flow transients for a large range of Ca2+ concentrations, we determined the Ca2+ dependence of the equilibrium rate constant of TnI binding to actin,
For easy comparison with other models of thin filament regulation (Chen et al. 2001; Geeves et al. 2011; Hill et al. 1980; Maytum et al. 1999; McKillop and Geeves 1993; Mijailovich et al. 2010; Mijailovich et al. 2012), we plot in Fig. 5 the
In order to avoid nonuniqueness of the estimated multiple model parameters, we reduced the model to a single free parameter, k
−I, while all other parameters are held constant over all concentration of Ca2+ and with two actin-to-myosin concentration ratios. The overall good fits are provided by reasonable assessment of other model parameters from structural, biophysical, and biochemical data; For example, the tropomyosin pinning angle, ϕ
−, and myosin-imposed Tm angular displacement, ϕ
+, are taken from Poole et al. (2006) and Vibert et al. (1997), and the chain persistence length from Phillips and Chacko (1996) and Sousa et al. (2010), and as such they are not free parameters. In addition, the confining potential is derived from the experimental data of Pirani et al. (2005). Similarly, the rate constants for myosin binding, k
M1, and isomerization, k
M2, are chosen as the best fit of the myosin binding transients. The equilibrium constant
The resulting sigmoidal
All CFC model parameters, except
The persistence length 1/ξ is the essential new parameter in the model, and in order to evaluate how the modeling results depend on the specific value used, we performed a sensitivity analysis of 1/ξ. In Fig. 8 the predicted fluorescence time courses are compared for a 20 % increase (green dashed lines) or 20 % decrease (blue dotted lines) in the originally value of 1/ξ = 22. 2 nm (black solid lines; data from Fig. 4).
Fig. 8.
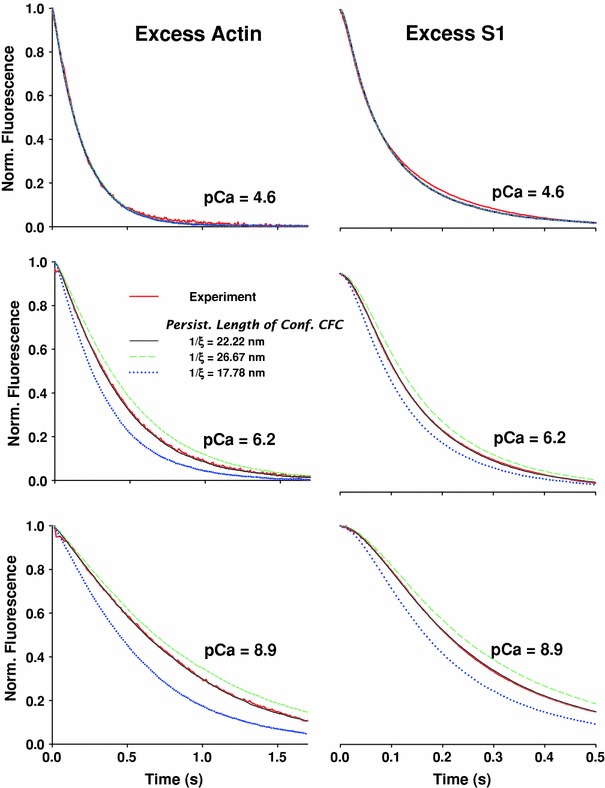
Effect of the persistence length of confined CFC, 1/ξ, on regulation of S1 binding. As shown in Fig. 4, the model predictions with persistence length of confined CFC of 1/ξ = 22.2 nm (black solid lines) closely follow the time course of normalized fluorescence (red solid lines) collected from stopped-flow experiments at three calcium concentrations. For both excess actin and excess S1, at high calcium concentration (pCa = 4.6), 20 % increase in 1/ξ (green dashed line) or 20 % decrease (dotted blue line) made almost no difference compared with the fit to the experimental data or the predictions with the original value 1/ξ = 22.2 nm. Decrease in calcium concentration resulted in significant departure of the predicted normalized fluorescence from both stopped-flow data and the fit with the original value 1/ξ = 22.2 nm. For this comparative analysis all other CFC model parameters were kept the same as displayed in Fig. 4. At medium and low calcium concentrations, the increase in 1/ξ to 26.67 nm decreases the predicted rate of decay of the normalized fluorescence compared with the experimental data, while reduction of 1/ξ to 17.78 nm increased the rate. The decrease of 1/ξ resulted in a much stronger departure from the experiments than the departure (in the opposite direction) for the equivalent increase in 1/ξ
As expected, at high calcium concentrations (pCa = 4.6), the transients were insensitive to a 20 % change in 1/ξ. This is because, at high calcium concentrations, the binding of S1 is not affected by the Tm–Tn CFC chain. At medium and lower calcium concentrations, an increase or decrease of 1/ξ showed slowed or accelerated fluorescence transients, respectively. Effectively, this means that an increase of 1/ξ will shift the K B–pCa curve to higher calcium concentrations due to the reduced angular standard deviation of free chain, σ o. Conversely, the smaller 1/ξ will shift the K B–pCa curve to lower calcium concentrations, due to increased σ o and, therefore, increased sensitivity of K B to calcium concentration.
At first sight a surprising result from the simulations with varying 1/ξ is the strong dependence of the fluorescence transient on calcium concentration for the excess-actin case. However, from the point of view of the CFC model, this behavior can be explained simply by associating the reduction of chain fluctuations with an increase in 1/ξ, and therefore a significant decrease in the availability of actin and a decrease of the effective rate constant of S1 binding (Eq. 5).
From Fig. 8 it is evident that, at medium and lower calcium concentration, the slope of the fastest part of the fluorescence decay, i.e., the middle of the curve, changes with an increase or decrease of 1/ξ, rather than a shift of the transient. Thus, refitting the data by varying k −I will not be sufficient to provide a good fit to the data. The values of the equilibrium constant, K I, also become unacceptably large (i.e., K B=1/K I small) at low calcium if only at low calcium if only K I is changed (as shown in Geeves et al. 2011). This implies that both K I and k M1 must be changed to give a good fit. This would require that k M1 has a strong dependence on calcium concentration, which is contrary to current thinking (Geeves et al. 2011; Mijailovich et al. 2010; Mijailovich et al. 2012). We therefore favor the simpler interpretation that the persistence length is well defined at 22.2 nm (Pirani et al. 2005) and that K I is the only calcium-dependent parameter. This assertion provides a way to test the model.
Any change in the TnC used (different isoforms or mutations) would be expected to change the value of K I but have little effect on the persistence length or the confining potential. Use of different Tm’s (isoforms or mutations) could alter the persistence length/confined potential but should not change K −I. Similarly, different myosins or myosin nucleotide complexes should change k M1 but should not alter the other two parameters. Note however that TnI or TnT interacts with both Tm and TnC and thus may affect either parameter. Note also that the model predictions in Fig. 8 show that a change in the persistence length of the confined chain, 1/ξ, can change the apparent calcium sensitivity of myosin binding because the apparent myosin binding rate constant is a function of both 1/ξ and K I.
In the current model, TnI–TnI and myosin–TnI interactions are only partially implemented by modulated rebinding of TnI to actin by the current configuration of the CFC. In contrast, the detachment of TnI from actin is assumed to be solely dependent on the Ca2+ concentration. The latter is true only if the TnI–actin energy well is sufficiently deep that any mechanical force in the absence of Ca2+ will be insufficient to perturb the bond from the stable equilibrium. In contrast, when one or two calcium ions are bound to TnC, i.e., when the affinity of TnI to actin is significantly reduced, a small perturbation (thermal or mechanical) will be sufficient to cause the detachment of TnI. In reality, this may not be always the case at low Ca2+, especially when rigor bridges displace TnI, as observed in low-Ca2+ myosin binding experiments, or at submaximal calcium concentrations, when such detachment also can be triggered by mechanical stretch (i.e., stretch activation; Pringle 1978). To date, no satisfactory molecular mechanism for stretch activation has been reported. While some degree of stretch activation occurs in all striated muscles, in vivo it functions primarily in muscles that contract rhythmically such as the indirect flight muscles (IFM) in many insects (Josephson et al. 2000) and vertebrate cardiac muscle, where it appears to aid cardiac ejection (Stelzer et al. 2006; Vemuri et al. 1999). Therefore, implementing strain-dependent detachment of TnI from actin is very important in studying diseases associated with dysfunction of Ca2+ regulation of muscle contraction. An important contribution in this direction has been recently reported (Geeves et al. 2011).
The kinetic version of the CFC model presented here has some limitations, which may require updating in the future. In particular, regulation by the CFC of the kinetics of myosin–actin and TnI–actin binding is assumed to be controlled solely by the statistics of the fluctuations of the CFC, which leaves open the question of whether the reverse rates are regulated. The CFC model shows that the corresponding affinities for actin are regulated in quite a different way, in terms of Gibbs energy differences between the states involved, so that it appears likely that the TnI rebinding rates will also be regulated quantities. A new approach is required which combines energetics with kinetics, and this problem is currently being addressed (Geeves et al. 2011). However, the good fits to transient data by the present model may not be significantly affected if the kinetically regulated transitions are predominantly irreversible; this condition is approximately satisfied except when the number of myosins bound to actin within a single TmTn unit is <1, which is only significant for early transients at low calcium. Because the mean position and fluctuation around that position of the CFC partially take into account strain-dependent rebinding rates of TnI to actin, the apparent kinetic errors in TnI rates will then have very little effect on myosin kinetics.
A modification to the myosin binding rate is necessary (Eq. 7) to fit the excess-myosin data, because with excess-myosin to actin concentration and fixed k M1 the model predicts faster myosin binding than is observed when more than 50 % of actin sites are occupied. We suggest that the slower experimental response is due to the reduced diffusion constant of free myosin-S1s in the vicinity of actin filaments heavily loaded with myosin. This phenomenon, specific to experiments in solution, needs further experimental and theoretical investigation.
In addition, the CFC model as originally proposed has several features which might need to be modified in the light of new experiments. Although there is new evidence for intermediate orientations of the chain and hence for bending compliance (Pirani et al. 2005), the chain of overlapping tropomyosins is obviously not a homogeneous elastic structure. It is not yet clear whether the chain is merely sterically hindered by a bound myosin (ϕ > ϕ +) or attracted to it, in which case ϕ = ϕ +. We used the latter for mathematical convenience in deriving formulae with the pair approximation. In practice, the consequences of these two possibilities would be quite similar, as the probability of CFC conformations at angles above ϕ + is quite small if the distortion energy 4κξ 3ϕ2+ of the kink itself exceeds the thermal energy k B T. It is also desirable to avoid the pair approximation, but that is a matter of convenience in manipulating the model and not a defect of the model itself.
The sigmoidal
Conclusions
We have shown that the CFC model can readily be extended to describe the regulation of myosin–actin kinetics by local configurations of the tropomyosin chain which are presumed to be in rapid equilibrium on the time scale of myosin binding. This has been demonstrated by fitting the time courses of experimental myosin binding data under a variety of conditions, including a range of calcium levels. A particularly convincing proof is obtained by plotting the detachment affinity of TnI used to fit the data against the experimental calcium concentration involved, giving practically identical curves for the excess-actin and excess-myosin data.
More generally, the Monte Carlo simulations presented here illustrate the three types of cooperativity present in the CFC model in ways not readily accessible by analytic methods. At high calcium, the dominant effect is myosin–myosin cooperation via shared kinks of the Tm–Tn chain. At low calcium, the dominant effect is inhibitory; myosin binding is inhibited by opposing kinks due to bound TnIs, with a large strain-energy cost for putting a bound myosin in a nearest-neighbor site. An additional inhibitory effect for myosin is the cooperative action of bound TnIs, which occurs because their ~38.5 nm (axial) spacing (where the Tm structural unit size is ~40 nm) is less than the size of a single kink, namely twice the chain persistence length of the confined chain, 1/ξ. However, TnI–TnI cooperativity does require kinks induced by TnI, and vanishes if ϕ − is set to zero.
Further testing of the model is possible by using different isoforms of Tn and Tm. Changes in Tn (skeletal Tn for cardiac Tn) should alter the calcium dependence of S1 binding transients but are not predicted to alter the Tm flexibility. Different Tm isoforms have been reported to have different solution persistence lengths (Tm carrying point mutations associated with cardiomyopathies; D175N and E180G; Li et al. 2012; Loong et al. 2012; Sumida et al. 2008) and therefore may be expected to alter the flexibility of Tm on actin. These studies are underway.
Electronic supplementary material
Below is the link to the electronic supplementary material.
Acknowledgments
We gratefully acknowledge Drs. D.A. Smith, T. Irving, and R.J. Gilbert for useful discussions and critical review of an earlier version of this article. We also thank Dr. B. Stojanović and Mr. Ð. Nedić for running additional simulations and the data analysis. This work was supported by grants NIH R01 AR048776 (S.M.M.) and Welcome Trust 085309 (M.A.G.).
Open Access
This article is distributed under the terms of the Creative Commons Attribution License which permits any use, distribution, and reproduction in any medium, provided the original author(s) and the source are credited.
Footnotes
A Markov process is a simple stochastic process in which the distribution of future states depends only on the present state and not on how it arrived in the present state.
Solution measurements of the initial rate of myosin binding to fully regulated actin as a function of calcium yield a Hill coefficient of 1.8; this value applies to the myosin-free filament and therefore argues against the existence of I–I interactions.
References
- Bathe KJ. Finite element procedures. Englewood Cliffs: Prentice-Hall; 1996. [Google Scholar]
- Boussouf SE, Geeves MA. Tropomyosin and troponin cooperativity on the thin filament. Adv Exp Med Biol. 2007;592:99–109. doi: 10.1007/978-4-431-38453-3_10. [DOI] [PubMed] [Google Scholar]
- Boussouf SE, Agianian B, Bullard B, Geeves MA. The regulation of myosin binding to actin filaments by Lethocerus troponin. J Mol Biol. 2007;373:587–598. doi: 10.1016/j.jmb.2007.07.066. [DOI] [PMC free article] [PubMed] [Google Scholar]
- Boussouf SE, Maytum R, Jaquet K, Geeves MA. Role of tropomyosin isoforms in the calcium sensitivity of striated muscle thin filaments. J Muscle Res Cell Motil. 2007;28:49–58. doi: 10.1007/s10974-007-9103-z. [DOI] [PubMed] [Google Scholar]
- Bremel RD, Weber A. Cooperation within actin filament in vertebrate skeletal muscle. Nat New Biol. 1972;238:97–101. doi: 10.1038/newbio238097a0. [DOI] [PubMed] [Google Scholar]
- Chen Y, Yan B, Chalovich JM, Brenner B. Theoretical kinetic studies of models for binding myosin subfragment-1 to regulated actin: Hill model versus Geeves model. Biophys J. 2001;80:2338–2349. doi: 10.1016/S0006-3495(01)76204-2. [DOI] [PMC free article] [PubMed] [Google Scholar]
- Criddle AH, Geeves MA, Jeffries T. The use of actin labelled with N-(1-pyrenyl)iodoacetamide to study the interaction of actin with myosin subfragments and troponin/tropomyosin. Biochem J. 1985;232:343–349. doi: 10.1042/bj2320343. [DOI] [PMC free article] [PubMed] [Google Scholar]
- Ebashi S, Wakabayashi T, Ebashi F. Troponin and its components. J Biochem. 1971;69:441–445. doi: 10.1093/oxfordjournals.jbchem.a129486. [DOI] [PubMed] [Google Scholar]
- Feynman RP, Hibbs AR. Quantum mechanics and path integrals. New York: McGraw-Hill; 1965. [Google Scholar]
- Gagne SM, Tsuda S, Li MX, Smillie LB, Sykes BD. Structures of the troponin C regulatory domains in the apo and calcium-saturated states. Nat Struct Biol. 1995;2:784–789. doi: 10.1038/nsb0995-784. [DOI] [PubMed] [Google Scholar]
- Galinska-Rakoczy A, Engel P, Xu C, Jung H, Craig R, Tobacman LS, Lehman W. Structural basis for the regulation of muscle contraction by troponin and tropomyosin. J Mol Biol. 2008;379:929–935. doi: 10.1016/j.jmb.2008.04.062. [DOI] [PMC free article] [PubMed] [Google Scholar]
- Geeves MA, Lehrer SS. Dynamics of the muscle thin filament regulatory switch: the size of the cooperative unit. Biophys J. 1994;67:273–282. doi: 10.1016/S0006-3495(94)80478-3. [DOI] [PMC free article] [PubMed] [Google Scholar]
- Geeves M, Griffiths H, Mijailovich S, Smith D. Cooperative [Ca2+]-dependent regulation of the rate of Myosin binding to actin: solution data and the tropomyosin chain model. Biophys J. 2011;100:2679–2687. doi: 10.1016/j.bpj.2011.04.020. [DOI] [PMC free article] [PubMed] [Google Scholar]
- Gordon AM, Homsher E, Regnier M. Regulation of contraction in striated muscle. Physiol Rev. 2000;80:853–924. doi: 10.1152/physrev.2000.80.2.853. [DOI] [PubMed] [Google Scholar]
- Grabarek Z, Grabarek J, Leavis PC, Gergely J. Cooperative binding to the Ca2+-specific sites of troponin C in regulated actin and actomyosin. J Biol Chem. 1983;258:14098–14102. [PubMed] [Google Scholar]
- Greaser ML, Gergely J. Reconstitution of troponin activity from three protein components. J Biol Chem. 1971;246:4226–4233. [PubMed] [Google Scholar]
- Greene LE, Eisenberg E. Cooperative binding of myosin subfragment-1 to the actin-troponin-tropomyosin complex. Proc Natl Acad Sci USA. 1980;77:2616–2620. doi: 10.1073/pnas.77.5.2616. [DOI] [PMC free article] [PubMed] [Google Scholar]
- Head JG, Ritchie MD, Geeves MA. Characterization of the equilibrium between blocked and closed states of muscle thin filaments. Eur J Biochem. 1995;227:694–699. doi: 10.1111/j.1432-1033.1995.tb20190.x. [DOI] [PubMed] [Google Scholar]
- Hill TL, Eisenberg E, Greene L. Theoretical model for the cooperative equilibrium binding of myosin subfragment 1 to the actin-troponin-tropomyosin complex. Proc Natl Acad Sci USA. 1980;77:3186–3190. doi: 10.1073/pnas.77.6.3186. [DOI] [PMC free article] [PubMed] [Google Scholar]
- Howard J. Mechanics of Motor Proteins and the Cytoskeleton. Sunderland: Sinauer Associates; 2001. [Google Scholar]
- Josephson RK, Malamud JG, Stokes DR. Asynchronous muscle: a primer. J Exp Biol. 2000;203:2713–2722. doi: 10.1242/jeb.203.18.2713. [DOI] [PubMed] [Google Scholar]
- Lehman W, Hatch V, Korman V, Rosol M, Thomas L, Maytum R, Geeves MA, Van Eyk JE, Tobacman LS, Craig R. Tropomyosin and actin isoforms modulate the localization of tropomyosin strands on actin filaments. J Mol Biol. 2000;302:593–606. doi: 10.1006/jmbi.2000.4080. [DOI] [PubMed] [Google Scholar]
- Lehrer SS, Morris EP. Dual effects of tropomyosin and troponin-tropomyosin on actomyosin subfragment 1 ATPase. J Biol Chem. 1982;257:8073–8080. [PubMed] [Google Scholar]
- Lehrer SS, Golitsina NL, Geeves MA. Actin-tropomyosin activation of myosin subfragment 1 ATPase and thin filament cooperativity. The role of tropomyosin flexibility and end-to-end interactions. Biochemistry. 1997;36:13449–13454. doi: 10.1021/bi971568w. [DOI] [PubMed] [Google Scholar]
- Li XE, Holmes KC, Lehman W, Jung H, Fischer S. The shape and flexibility of tropomyosin coiled coils: implications for actin filament assembly and regulation. J Mol Biol. 2010;395:327–339. doi: 10.1016/j.jmb.2009.10.060. [DOI] [PubMed] [Google Scholar]
- Li XE, Lehman W, Fischer S. The relationship between curvature, flexibility and persistence length in the tropomyosin coiled-coil. J Struct Biol. 2010;170:313–318. doi: 10.1016/j.jsb.2010.01.016. [DOI] [PMC free article] [PubMed] [Google Scholar]
- Li XE, Suphamungmee W, Janco M, Geeves MA, Marston SB, Fischer S, Lehman W. The Flexibility of Two Tropomyosin Mutants, D175 N and E180G, that Cause Hypertrophic Cardiomyopathy. Biochem Biophy Res Commun. 2012;424:493–496. doi: 10.1016/j.bbrc.2012.06.141. [DOI] [PMC free article] [PubMed] [Google Scholar]
- Loong CK, Zhou HX, Chase PB. Persistence length of human cardiac alpha-tropomyosin measured by single molecule direct probe microscopy. PLoS ONE. 2012;7:e39676. doi: 10.1371/journal.pone.0039676. [DOI] [PMC free article] [PubMed] [Google Scholar]
- Lorenz M, Popp D, Holmes KC. Refinement of the F-actin model against X-ray fiber diffraction data by the use of a directed mutation algorithm. J Mol Biol. 1993;234:826–836. doi: 10.1006/jmbi.1993.1628. [DOI] [PubMed] [Google Scholar]
- Lorenz M, Poole KJ, Popp D, Rosenbaum G, Holmes KC. An atomic model of the unregulated thin filament obtained by X-ray fiber diffraction on oriented actin-tropomyosin gels. J Mol Biol. 1995;246:108–119. doi: 10.1006/jmbi.1994.0070. [DOI] [PubMed] [Google Scholar]
- Maytum R, Lehrer SS, Geeves MA. Cooperativity and switching within the three-state model of muscle regulation. Biochemistry. 1999;38:1102–1110. doi: 10.1021/bi981603e. [DOI] [PubMed] [Google Scholar]
- McKillop DF, Geeves MA. Regulation of the interaction between actin and myosin subfragment 1: evidence for three states of the thin filament. Biophys J. 1993;65:693–701. doi: 10.1016/S0006-3495(93)81110-X. [DOI] [PMC free article] [PubMed] [Google Scholar]
- Metzger JM. Myosin binding-induced cooperative activation of the thin filament in cardiac myocytes and skeletal muscle fibers. Biophys J. 1995;68:1430–1442. doi: 10.1016/S0006-3495(95)80316-4. [DOI] [PMC free article] [PubMed] [Google Scholar]
- Mijailovich SM, Li X, Del Alamo JC, Griffiths RH, Kecman V, Geeves MA. Resolution and uniqueness of estimated parameters of a model of thin filament regulation in solution. Comput Biol Chem. 2010;34:19–33. doi: 10.1016/j.compbiolchem.2009.11.002. [DOI] [PMC free article] [PubMed] [Google Scholar]
- Mijailovich SM, Li X, Griffiths RH, Geeves MA. The Hill Model for Binding Myosin S1 to Regulated Actin is not Equivalent to McKillop & Geeves Model. J Mol Biol. 2012;417:112–128. doi: 10.1016/j.jmb.2012.01.011. [DOI] [PMC free article] [PubMed] [Google Scholar]
- Moss RL, Swinford AE, Greaser ML. Alterations in the Ca2+ sensitivity of tension development by single skeletal muscle fibers at stretched lengths. Biophys J. 1983;43:115–119. doi: 10.1016/S0006-3495(83)84329-X. [DOI] [PMC free article] [PubMed] [Google Scholar]
- Murakami K, Stewart M, Nozawa K, Tomii K, Kudou N, Igarashi N, Shirakihara Y, Wakatsuki S, Yasunaga T, Wakabayashi T. Structural basis for tropomyosin overlap in thin (actin) filaments and the generation of a molecular swivel by troponin-T. Proc Natl Acad Sci USA. 2008;105:7200–7205. doi: 10.1073/pnas.0801950105. [DOI] [PMC free article] [PubMed] [Google Scholar]
- Onsager L. Reciprocal relations in irreversible processes. I. Phys Rev. 1931;37:405–426. doi: 10.1103/PhysRev.37.405. [DOI] [Google Scholar]
- Onsager L. Reciprocal relations in irreversible processes. II. Phys Rev. 1931;38:2265–2279. doi: 10.1103/PhysRev.38.2265. [DOI] [Google Scholar]
- Palm T, Greenfield NJ, Hitchcock-DeGregori SE. Tropomyosin ends determine the stability and functionality of overlap and troponin T complexes. Biophys J. 2003;84:3181–3189. doi: 10.1016/S0006-3495(03)70042-3. [DOI] [PMC free article] [PubMed] [Google Scholar]
- Phillips GN, Jr, Chacko S. Mechanical properties of tropomyosin and implications for muscle regulation. Biopolymers. 1996;38:89–95. doi: 10.1002/(SICI)1097-0282(199601)38:1<89::AID-BIP7>3.0.CO;2-S. [DOI] [PubMed] [Google Scholar]
- Pirani A, Xu C, Hatch V, Craig R, Tobacman LS, Lehman W. Single particle analysis of relaxed and activated muscle thin filaments. J Mol Biol. 2005;346:761–772. doi: 10.1016/j.jmb.2004.12.013. [DOI] [PubMed] [Google Scholar]
- Poole KJ, Lorenz M, Evans G, Rosenbaum G, Pirani A, Craig R, Tobacman LS, Lehman W, Holmes KC. A comparison of muscle thin filament models obtained from electron microscopy reconstructions and low-angle X-ray fibre diagrams from non-overlap muscle. J Struct Biol. 2006;155:273–284. doi: 10.1016/j.jsb.2006.02.020. [DOI] [PubMed] [Google Scholar]
- Pringle JW. The Croonian Lecture, 1977. Stretch activation of muscle: function and mechanism. Proc R Soc Lond B Biol Sci. 1978;201:107–130. doi: 10.1098/rspb.1978.0035. [DOI] [PubMed] [Google Scholar]
- Smith D. Path integral theory of an axially-confined worm-like chain. J Phys A Math Gen. 2001;34:4507–4523. doi: 10.1088/0305-4470/34/21/307. [DOI] [Google Scholar]
- Smith DA, Geeves MA. Cooperative regulation of myosin-actin interactions by a continuous flexible chain II: actin-tropomyosin-troponin and regulation by calcium. Biophys J. 2003;84:3168–3180. doi: 10.1016/S0006-3495(03)70041-1. [DOI] [PMC free article] [PubMed] [Google Scholar]
- Smith DA, Maytum R, Geeves MA. Cooperative regulation of myosin-actin interactions by a continuous flexible chain I: actin-tropomyosin systems. Biophys J. 2003;84:3155–3167. doi: 10.1016/S0006-3495(03)70040-X. [DOI] [PMC free article] [PubMed] [Google Scholar]
- Sousa D, Cammarato A, Jang K, Graceffa P, Tobacman LS, Li XE, Lehman W. Electron microscopy and persistence length analysis of semi-rigid smooth muscle tropomyosin strands. Biophys J. 2010;99:862–868. doi: 10.1016/j.bpj.2010.05.004. [DOI] [PMC free article] [PubMed] [Google Scholar]
- Spudich JA, Watt S. The regulation of rabbit skeletal muscle contraction. I. Biochemical studies of the interaction of the tropomyosin-troponin complex with actin and the proteolytic fragments of myosin. J Biol Chem. 1971;246:4866–4871. [PubMed] [Google Scholar]
- Squire J. Muscle regulation: a decade of the steric blocking model. Nature. 1981;291:614–615. doi: 10.1038/291614a0. [DOI] [PubMed] [Google Scholar]
- Stelzer JE, Larsson L, Fitzsimons DP, Moss RL. Activation dependence of stretch activation in mouse skinned myocardium: implications for ventricular function. J Gen Physiol. 2006;127:95–107. doi: 10.1085/jgp.200509432. [DOI] [PMC free article] [PubMed] [Google Scholar]
- Sumida JP, Wu E, Lehrer SS. Conserved Asp-137 imparts flexibility to tropomyosin and affects function. J Biol Chem. 2008;283:6728–6734. doi: 10.1074/jbc.M707485200. [DOI] [PubMed] [Google Scholar]
- Tobacman LS, Butters CA. A new model of cooperative myosin-thin filament binding. J Biol Chem. 2000;275:27587–27593. doi: 10.1074/jbc.M003648200. [DOI] [PubMed] [Google Scholar]
- Tripet B, Van Eyk JE, Hodges RS. Mapping of a second actin-tropomyosin and a second troponin C binding site within the C terminus of troponin I, and their importance in the Ca2+-dependent regulation of muscle contraction. J Mol Biol. 1997;271:728–750. doi: 10.1006/jmbi.1997.1200. [DOI] [PubMed] [Google Scholar]
- Vemuri R, Lankford EB, Poetter K, Hassanzadeh S, Takeda K, Yu ZX, Ferrans VJ, Epstein ND. The stretch-activation response may be critical to the proper functioning of the mammalian heart. Proc Natl Acad Sci USA. 1999;96:1048–1053. doi: 10.1073/pnas.96.3.1048. [DOI] [PMC free article] [PubMed] [Google Scholar]
- Vibert P, Craig R, Lehman W. Steric-model for activation of muscle thin filaments. J Mol Biol. 1997;266:8–14. doi: 10.1006/jmbi.1996.0800. [DOI] [PubMed] [Google Scholar]
- Wegscheider R. Über simultane Gleichgewichte und die Beziehungen zwischen Thermodynamik und Reactionskinetik homogener Systeme. Monatshefte für Chemie/Chemical Monthly. 1911;32:849–906. doi: 10.1007/BF01517735. [DOI] [Google Scholar]
- Xu C, Craig R, Tobacman L, Horowitz R, Lehman W. Tropomyosin position in regulated thin filaments revealed by cryoelectron microscopy. Biophys J. 1999;77:985–992. doi: 10.1016/S0006-3495(99)76949-3. [DOI] [PMC free article] [PubMed] [Google Scholar]
- Yanagida T, Nakase M, Nishiyama K, Oosawa F. Direct observation of motion of single F-actin filaments in the presence of myosin. Nature. 1984;307:58–60. doi: 10.1038/307058a0. [DOI] [PubMed] [Google Scholar]
- Yasuda R, Miyata H, Kinosita K., Jr Direct measurement of the torsional rigidity of single actin filaments. J Mol Biol. 1996;263:227–236. doi: 10.1006/jmbi.1996.0571. [DOI] [PubMed] [Google Scholar]
Associated Data
This section collects any data citations, data availability statements, or supplementary materials included in this article.