Abstract
A capillary electrophoresis system with an ultrasensitive three-color laser-induced fluorescence detector was constructed for the simultaneous measurement of glycosphingolipids conjugated with a family of BODIPY fluorophores. The compounds were separated by capillary electrophoresis and detected by laser-induced fluorescence excited within a sheath-flow cuvette. Diode-pumped solid-state lasers operating at 473 nm and 532 nm, and a diode laser operating at 633 nm were used to excite glycosphingolipids tagged with BODIPY-FL, BODIPY-TMR, and BODIPY-650/665 fluorophores. Detection limits were 34 ± 1 molecules, 67 ± 7 molecules, and 36 ± 13 molecules of BODIPY-FL, BODIPY-TMR, and BODIPY-650/665 labeled glycosphingolipids. Separation efficiencies were typically one million theoretical plates. To test the ability of the system to analyze cellular contents in an in vitro biological model, differentiated PC12 cells were co-incubated with BODIPY-FL, BODIPY-TMR, and BODIPY-650/665 labeled lactosylceramide substrates. Cells were homogenized. The metabolic products originating from the glycosphingolipid substrates were simultaneously analyzed using the system.
Introduction
Over 80% of the conjugated saccharides in the central nervous system are in the form of lipids.1 Glycosphingolipids (GSLs) are ubiquitous on neuronal cell surfaces and are made up of a nonpolar tail consisting of a fatty acid and sphingosine with a polar sugar headgroup.2 The number of substitutions and saccharide composition varies, giving rise to a complex suite of GSLs that mediate a variety of functions including cellular differentiation, intracellular signalling, pathogen binding, and oncogenesis.3–6 Defects in GSL metabolism result in several debilitating disorders including Tay-Sachs disease and Sandhoff’s disease.7
Sensitive high-resolution measurement of GSLs presents a difficult analytical challenge. High performance thin layer chromatography is the traditional approach to quantify GSLs, but suffers from poor sensitivity.8 Gas chromatography and high performance liquid chromatography have been used to measure GSLs, but ideal separation conditions confound mass spectrometric detection.9–11 Our group pioneered the use of capillary electrophoresis with laser-induced fluorescence detection to monitor GSL metabolism in cellular homogenates and single cells.12–18 GSLs are chemoenzymatically prepared to include a fluorophore attached to the sphingosine tail.19, 20 Cells are incubated with these fluorescently-labeled GSLs and various metabolic products due to the addition (anabolism) or removal (catabolism) of saccharides from the sugar headgroup are detected.
We recently reported the development and characterization of a capillary electrophoresis system with two-color laser-induced fluorescence detection used to monitor GSL metabolism.13 Together, two diode-pumped solid-state lasers, one operating in the blue at 473 nm and the other operating in the green at 532 nm, were used to excite fluorescence from BODIPY-FL- and tetramethylrhodamine-labeled GSLs, respectively. Here, we report a three-color system with the addition of a 633 nm red diode laser.
We have observed that tetramethylrhodamine-labeled GSLs exclusively undergo catabolism, whereas BODIPY-FL GSLs undergo both catabolism and anabolism.13 Fluorescence microscopy revealed that compounds labeled with the two fluorophores had quite distinct cellular distribution, reflecting differences in the uptake and transport properties of these compounds. To further study the metabolic behaviour of GSLs labeled with a range of boron dipyrromethene (BODIPY) fluorophores, we chemoenzymatically prepared GSLs tagged with fluorophores within the BODIPY family: BODIPY-FL (λex/λex 505 nm/513 nm), BODIPY-TMR (λex/λex 542 nm /574 nm), and BODIPY-650/665 ((λex/λex 646 nm /660 nm).21
Experimental
Synthesis and enzymatic preparation of BODIPY-labeled GSLs
C18-lyso-lactosylceramide (LacCer) was purchased from Avanti Polar Lipids (Alabaster, AL). Thin layer chromatography plates (TLC silica Gel 60) and silica gel (Silica gel 60) were purchased from Merck (Darmstadt, Germany). Cytidine 5’-monophospho-N-acetyl-α-D-neuraminic acid (CMP-Neu5Ac) was purchased from IEP GmbH (Wiesbaden, Germany). Alkaline phosphatase was purchased from Roche (Basel, Switzerland). C18 Sep-Pak cartridges were purchased from Waters Corporation (Milford, MA). Sialyltransferase (MalE fusion protein from Campylobacter jejuni)22, 23 were expressed and purified as previously reported. BODIPY-FL standards were prepared as described previously.20 GSLs tagged with the BODIPY-TMR and BODIPY-650/665 fluorophores were prepared in a similar manner using the corresponding NHS-esters (Life Technologies, Carlsbad, CA) as described below. All other chemicals were purchased from Sigma–Aldrich (St. Louis, MO). MALDI-TOF MS spectra were recorded on Bruker (Bremen, Germany) Microflex instruments using l-Cyano-4-hydroxycinnamic acid solution [20 mg dissolved in 1 mL of 50/50 (v/v) acetonitrile/water with 0.1% TFA].
To synthesize LacCer-BODIPY-TMR, diisopropylethylamine (1.7 µL, 9.8 µmol) was added to a mixture of C18-lyso-LacCer (1.3 mg, 2.1 µmol) and BODIPY-TMR-NHS ester (1.8 mg, 2.9 µmol) in DMF (1.0 mL). After stirring at room temperature for 24 h, the reaction mixture was evaporated with toluene. The residue was purified by silica gel column and C18 Sep-Pak cartridge to give the target compound.
To prepare GM3-BODIPY-TMR, the reaction mixture (620 µL) consisted of LacCer-BODIPY-TMR (0.50 mg, 0.45 µmol), CMP-Neu5Ac (1.0 µmol), α-2,3-sialyltransferase (33 µg, MalE-fusion) and alkaline phosphatase (540 mU) in 50 mM MOPS buffer, 60 mM MgCl2, EtOH (60 µL, 9.6% v/v, used for solubilization of LacCer-BODIPY-TMR), pH 7.5. After overnight incubation at 37 °C, the reaction mixture was purified with C18 Sep-Pak cartridge and silica TLC plate (5×5 cm Alumi, CHCl3:MeOH:H2O = 65:35:5) to give the target compound.
While its synthesis has been reported previously,24 we used a slightly simplified approach to prepare LacCer-BODIPY-650/665. Diisopropylethylamine (1.7 µL, 9.8 µmol) was added to a mixture of C18-lyso-LacCer (1.0 mg, 1.6 µmol) and BODIPY-650/655-NHS ester (1.9 mg, 3.0 µmol) in DMF (1.0 mL). After stirring at room temperature for 24 h, the reaction mixture was evaporated with toluene. The residue was purified as described for LacCer-BODIPY-TMR.
Cell Culture
Rat PC12 cells (strain CRL-1721) were purchased from American Type Culture Collection (ATCC, Manassas, VA). PC12 cells adhere poorly to plastic,25 so flasks were coated with rat-tail collagen I (Life Technologies) according to the manufacturer’s instructions. Cells were grown in RPMI 1640 medium (ATCC) supplemented with 5% fetal bovine serum, 10% horse serum, 2 mM GlutaMAX, amphotercin B, streptomycin, and penicillin (Life Technologies). PC12 cells were differentiated into neuronal-like cells (dPC12s) by supplementing the above RPMI 1640 culture medium with 50 ng/mL neuronal growth factor (BD Biosciences, San Jose, CA).25 For stronger adherence, dPC12 cells were grown on mouse collagen IV (BD Biosciences) flasks, coated according to the manufacturer’s instructions.
Lipid Incubation
dPC12 cells were grown in NGF-supplemented RPMI 1640 medium for 10 days. On day 10, cells were washed with calcium and magnesium-free phosphate buffered saline (PBS, Life Technologies) and the medium was replaced with serum free NGF-supplemented RPM1 1640 medium (RPMI 1640, 2 mM GlutaMAX, amphotercin B, streptomycin, penicillin, and 50 ng/mL NGF). The presence of serum in culture medium has been shown to dramatically decrease fluorescent GSL uptake in cultured cells,26 so serum was removed from the culture medium and dPC12 cells were allowed to equilibrate to the serum-free NGF-supplemented RPMI 1640 medium for two days prior to lipid incubation.
LacCer-BODIPY-FL, LacCer-BODIPY-TMR, and LacCer-BODIPY-650/665 were reconstituted in biological grade ethanol, complexed with methyl-β-cyclodextrin at a lipid to cyclodextrin ratio of 1:1.5, and resuspended in cell culture medium at a concentration of approximately 2 µM. dPC12 cells were simultaneously incubated with the culture medium containing the three LacCer-BODIPY fluorophores for two hours, washed with PBS, and incubated with serum free NGF-supplemented RPMI 1640 medium for an additional 22 hours.
Cells were removed using a 0.25% trypsin/EDTA solution (Life Technologies) and residual trypsin was deactivated using soybean trypsin inhibitor. Cells were then washed with PBS and homogenized in a solution of 1% sodium dodecyl sulfate in PBS. Cell homogenates were stored at −80 °C until use.
Capillary Electrophoresis
All solutions were prepared in distilled 18 MΩ deionized water (Barnstead Nanopure System, Thermo Scientific, Waltham, MA). The capillary electrophoresis system used here was a modification of instrumentation previously reported by our group.13, 20, 27 A Spellman CZE1000R high voltage power supply was used to drive both the separation and injection (Hauppauge, NY). Samples were introduced onto the capillary using electrokinetic injections (1 kV, 1 s) within a locally constructed Plexiglas injection block.15 Micellar electrokinetic capillary chromatography (MECC) was used for the separation. Separations were conducted on a 45 cm long, 150 µm OD/30 µm ID fused silica capillary (Polymicro Technologies, Phoenix, AZ) in a buffer20 composed of 100 mM TRIS (Sigma-Aldrich), 100 mM CHES (Alfa Aesar, Ward Hill, MA), 20 mM sodium dodecyl sulfate (Sigma-Aldrich), and 5 mM α-cyclodextrin (Alfa Aesar) at 26 kV.
Locally written LabVIEW software was used for hardware control and data acquisition (PCI-6035E and PCI-6602 cards, National Instruments, Austin, TX). LabVIEW, MATLAB (Mathworks, Natick, MA), Igor (Wavemetrics, Portland, OR), and Origin (OriginLab, Northhampton, MA) were used for data analysis. All electropherograms were treated with a five-point median filter to remove noise spikes, smoothed by convolution with a 0.1 s wide Gaussian filter function, and corrected for photodetector dead time.28 Peak widths were estimated using a least-squares fit to a Gaussian function. Separation efficiencies were calculated using the migration time and standard deviation of the Gaussian peak.29 Numerical values are presented as the average ± standard error of the mean. Spectral cross talk was calculated by dividing the peak height of bleed into the peak height of the analyte in its proper fluorescence emission channel. Spectral cross talk was only detected from BODIPY-FL emission into the BODIPY-TMR detection channel (vide infra) and all BODIPY-TMR electropherograms were corrected accordingly.
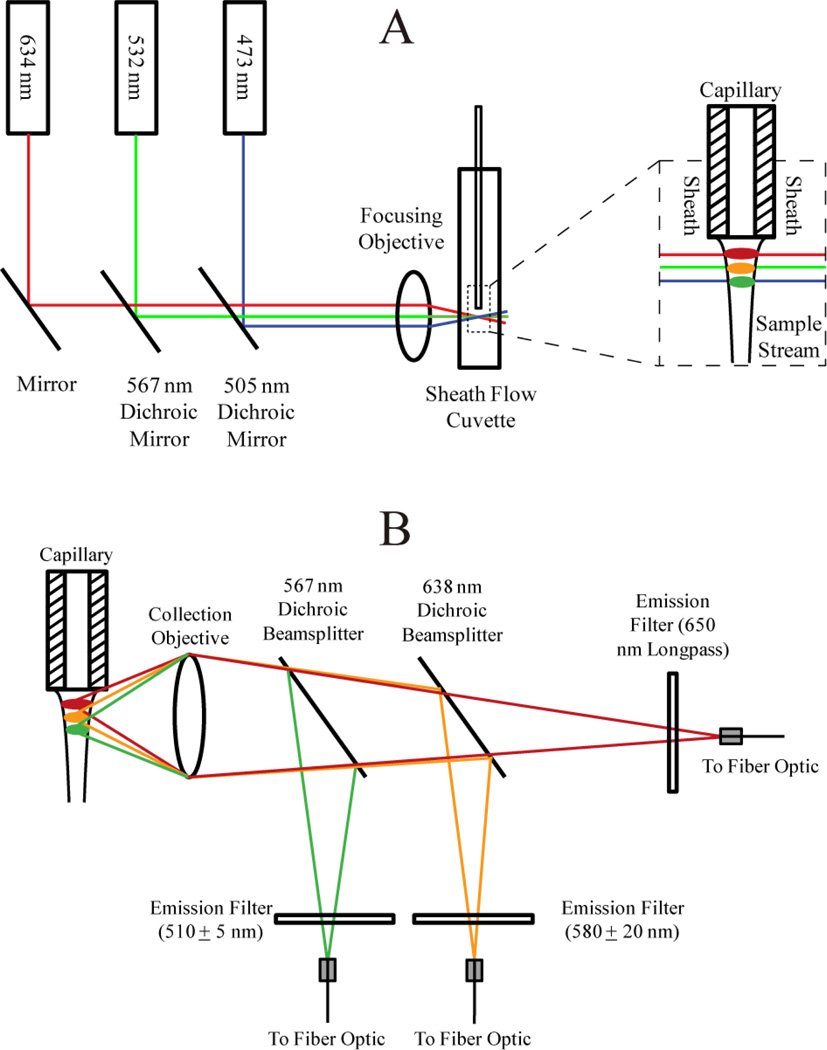
Three-color Laser-induced Fluorescence Setup
Detection relied on the use of a sheath flow cuvette.30 All optical components were purchased from Thorlabs (Newton, NJ) and CVI Melles Griot (Albuquerque, NM) unless otherwise noted. The optical setup for three-color excitation is shown in Figure 1A.
Figure 1.
Optical block diagram for capillary electrophoresis with three-color fluorescence detection. A) Excitation schematic. B) Emission schematic.
473 nm (Lasermate, Walnut, CA), 532 nm (CrystaLaser, Reno, NV), and 633 nm (CrystaLaser) solid-state lasers were each operated at a power of 10 mW. Dichroic mirrors with reflection/transmission splits at 505 nm and 567 nm were used to direct the three beams into a 6.3× 20 numerical aperture microscope objective. The resulting beams were focused into a sheath flow cuvette (Hellma USA, Plainview, NY). The 633 nm, 532 nm, and 473 nm beams were offset from one another to minimize photobleaching and scatter13 and were focused approximately 50 µm, 70 µm, and 90 µm, respectively, downstream from the distal end of the capillary. Offsetting the beams prevents Raman scatter from lower wavelength lasers from being detected within the higher wavelength channels and also prevents Rayleigh scatter from higher wavelength channels from being detected within the lower wavelength channels. The BODIPY-FL is also known to exhibit red shifts so offsetting beams minimizes crosstalk.31 Offsetting beams created a temporal lag as analytes traversed successive beams, but this lag was negligible (< 0.1 s).
Emission was collected using a 0.7 NA microscope objective (Universe Kogaku, Oyster Bay, NY) before being passed through successive dichroic beamsplitters (Figure 1B). The BODIPY-FL green emission from the 473 nm excitation beam was reflected from a 567 nm dichroic beamsplitter, filtered (510DF10 bandpass), and sent to a fiber optic cable that was coupled to one channel of a SPCM-AQ4C four-channel single-photon counting avalanche photodiode detector (APD) (PerkinElmer, Waltham, MA, now marketed as Excelitas Technologies, Waltham, MA) with a dead time of 56 ns. A 638 nm dichroic beamsplitter reflected the orange emission from BODIPY-TMR, which was filtered (580DF40) and sent to a fiber optic cable coupled to another channel of the APD. The deep red emission from BODIPY-650/665 was transmitted through the 638 nm dichroic beamsplitter, filtered (650 nm longpass), and sent to a fiber optic cable to a third channel of the APD.
Results and Discussion
Preparation of BODIPY-labeled GSLs
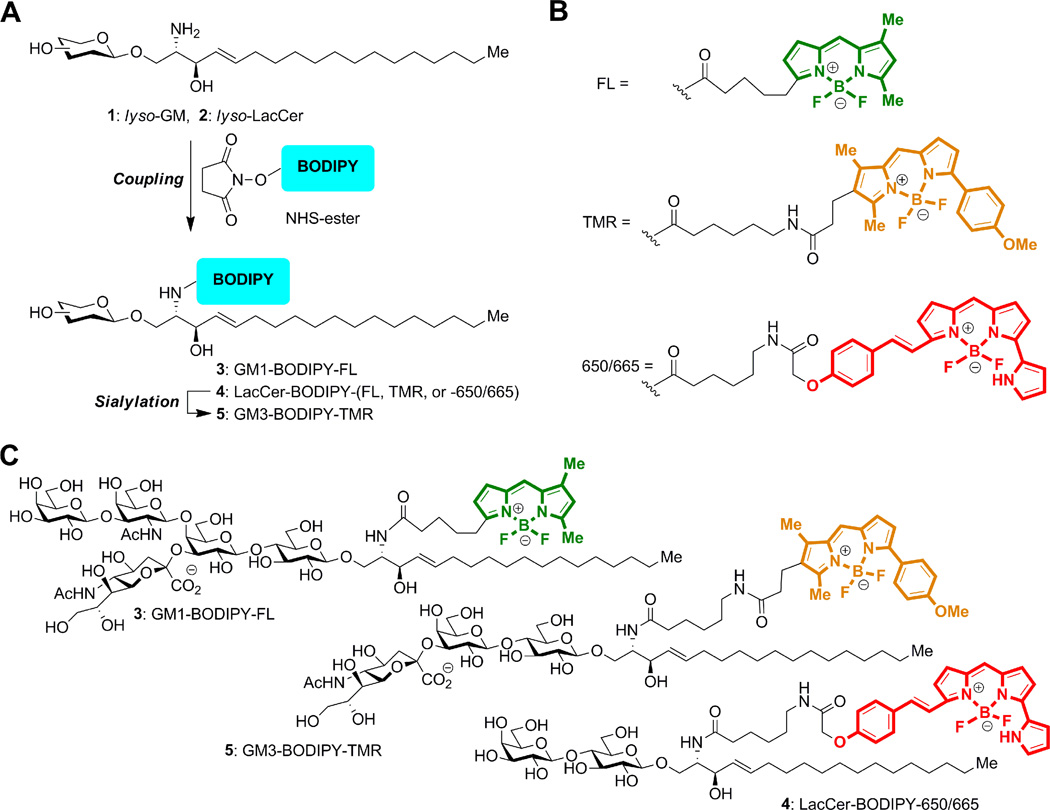
We have previously reported the preparation of GSLs tagged with the BODIPY-FL fluorophore.20 Here, we used a similar approach to prepare the GSLs labeled with the BODIPY-TMR and BODIPY-665/660 fluorophores (Figure 2A). A fatty-acid free (lyso) GM1 or LacCer oligosaccharide substrate was acylated with commercially available succinimidyl esters of BODIPY fluorophores (Figure 2B) to form the fluorescent GSL conjugates. GM3-BODIPY-TMR was then successively prepared from LacCer-BODIPY-TMR using CMP-Neu5Ac and a recombinant α-2,3-sialyltransferase. The chemical structures for GM1-BODIPY-FL, GM3-BODIPY-TMR and LacCer-BODIPY-650/665 are shown in Figure 2C.
Figure 2.
Preparation of GSLs conjugated with BODIPY fluorophores. A) Diagram of the overall chemo-enzymatic synthesis pathway. B) Structures of the BODIPY-FL, BODIPY-TMR, and BODIPY-650/665 linkages. C) GM1-BODIPY-FL (top), GM3-BODIPY-TMR (middle), and LacCer-BODIPY-650/665 (bottom). BODIPY-FL, BODIPY-TMR, and BODIPY-650/665 are colored green, orange, and red according to their emission wavelengths.
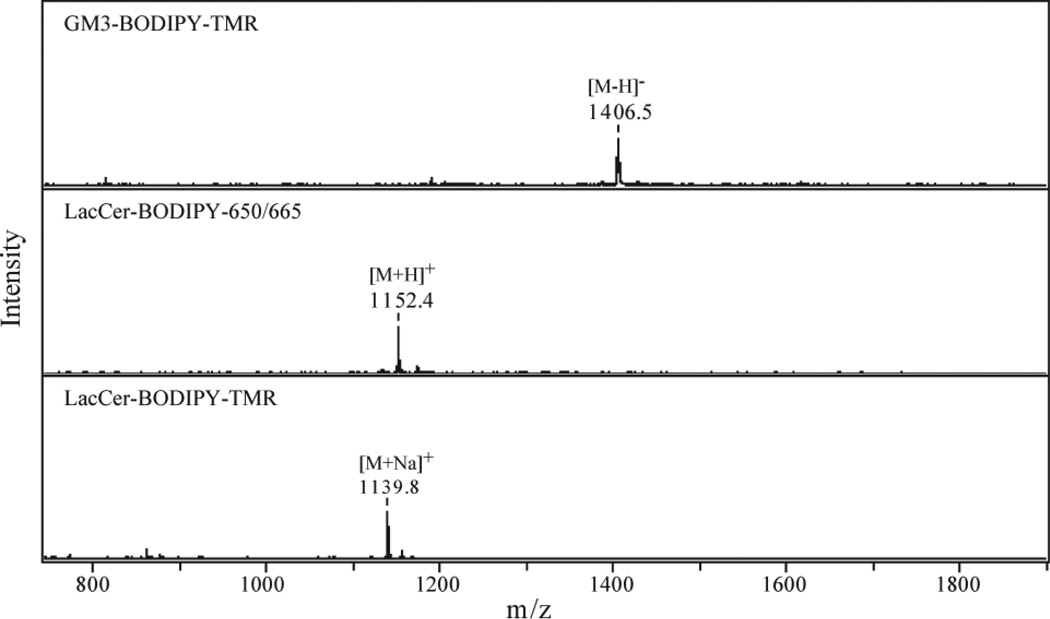
MALDI mass spectra for the GSLs are shown in Figure 3, confirming their expected structures. The observed peaks correspond to their theoretical mass-to-charge ratios; GM3-BODIPY-TMR: [M-H]− 1406.7, LacCer-BODIPY-650/665: [M+H]+ 1152.6, and LacCer-BODIPY-TMR: [M+Na]+ 1139.6, respectively. The preparation of LacCer-BODIPY-TMR and LacCer-BODIPY-650/665 gave with 99% and 92% yields, respectively. The enzymatic conversion of LacCer-BODIPY-TMR into GM3-BODIPY-TMR caused moderate sample loss with a 67% yield for GM3-BODIPY-TMR.
Figure 3.
MALDI mass spectra for the BODIPY conjugated GSLs. The spectra were acquired in the positive mode except for GM3-BODIPY-TMR which has a sialic acid moiety in its carbohydrate chain.
While the synthesis of LacCer-BODIPY-650/665 has previously been reported,24 it is critical that the lyso-GSL starting material be of high purity. GSLs naturally occur with variations in the length of sphingosine chain.32 Beginning with a mixture of lyso-GSL substrates would result in the synthesis of multiple fluorescent synthetic isomers. Incubating cells with a mixture of isomeric fluorescent substrates would result in the production of a mixture of isomeric fluorescent products for each GSL, complicating their detection. This problem is frequently encountered when endogenous GSLs are analyzed with thin layer chromatography.32 All GSLs prepared here contained only C18 sphingosine chains, thereby eliminating this problem.
Instrument Characterization
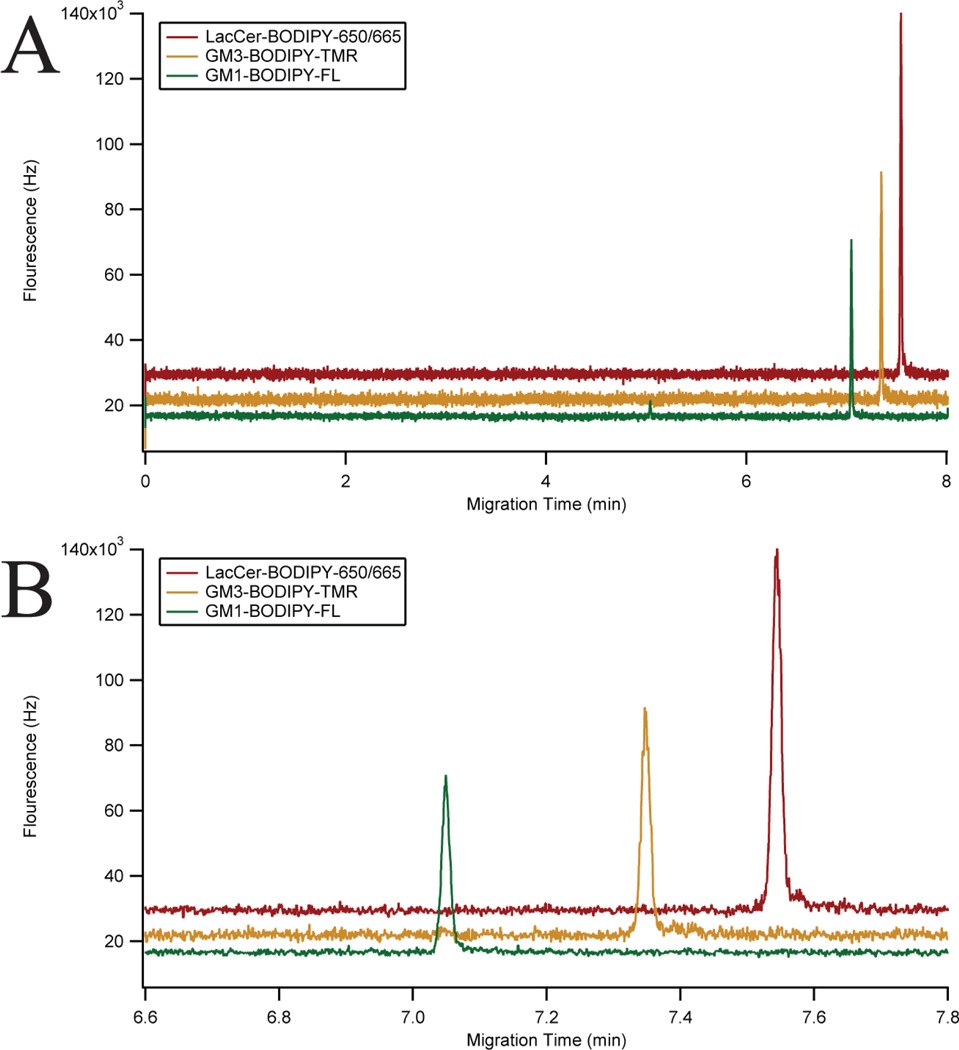
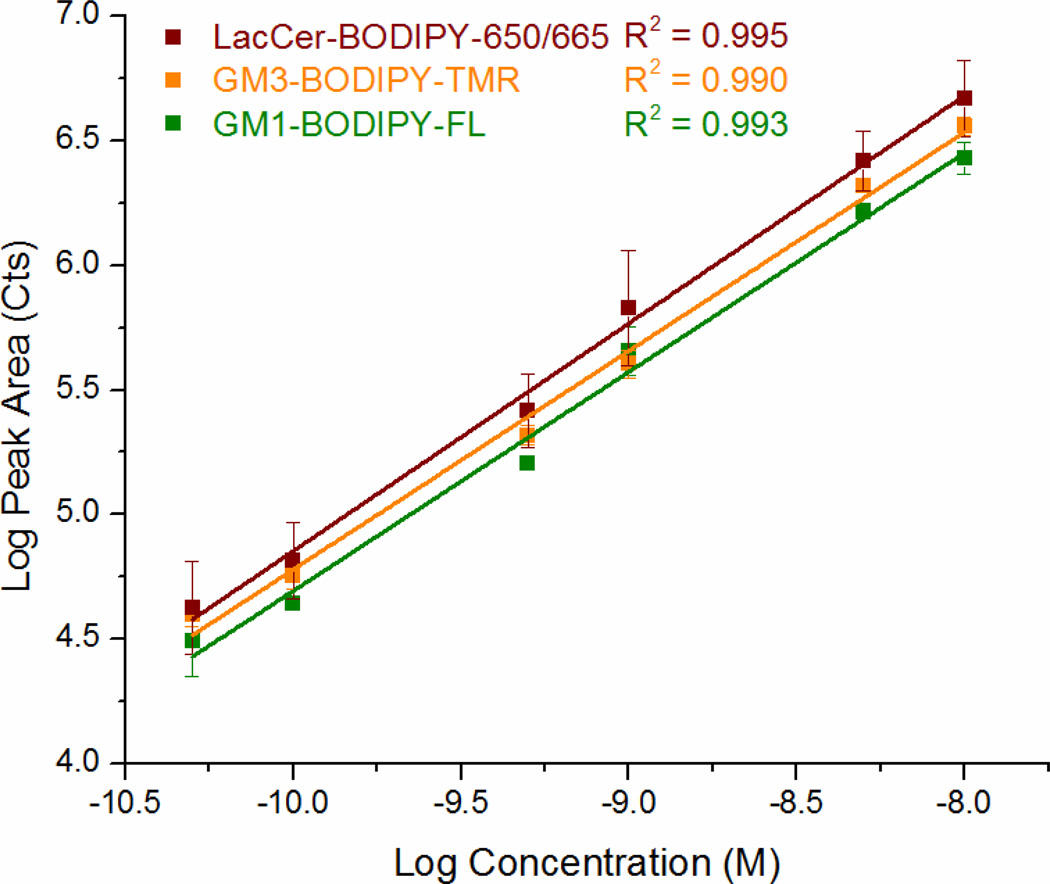
The instrument was characterized using a mixture of three GSLs: GM1-BODIPY-FL, GM3-BODIPY-TMR, and LacCer-BODIPY-650/665 (Figure 2C). A representative three-color electropherogram of a 100 pM mixture of these GSLs is shown in Figures 4A and 4B. These GSL conjugates were well resolved and exhibited symmetrical peak shapes. The chemoenzymatic preparation of GM3-BODIPY-TMR and LacCer-BODIPY-650/665 showed only minimal (< 2% total area) fluorescent impurities. Calibration curves showed a linear response of each analyte over the two-and-a-half orders of magnitude tested (Figure 5).
Figure 4.
Three-color fluorescence electropherogram. A) Three-color electropherogram of a 100 pM mixture of GM1-BODIPY-FL (green), GM3-BODIPY-TMR (orange), and LacCer-BODIPY-650/665 (red). B) Expansion of the separation window of A). Traces were vertically offset for clarity.
Figure 5.
Log-log plot of peak area versus concentration for GM1-BODIPY-FL (green), GM3-BODIPY-TMR (orange), and LacCer-BODIPY-650/665 (red). Coefficients of determination for the three channels are also given.
Table 1 summarizes the response of the capillary electrophoresis system with three-color laser-induced fluorescence detection. Theoretical plate counts were one million for each channel. The concentration limit of detection for each channel was below 5 pM, corresponding to mass detection limits of 57 ± 2 ymol, 110 ± 11 ymol, and 60 ± 22 ymol for GM1-BODIPY-FL, GM3-BODIPY-TMR, and LacCer-BODIPY-650/660, respectively (N = 3). GSLs conjugated with the BODIPY-FL fluorophore are known to exhibit a red shift31 and a small amount of cross talk was detected in the BODIPY-TMR channel (2.92 ± 0.04 %). Spectral cross talk from BODIPY-TMR and BODIPY-650/665 fluorophores was not detected.
Table 1.
Figures of Merit for the three-color capillary electrophoresis system (N = 3)
| Analyte | Theoretical Plates (× 106) |
Concentration Limit of Detection (pM) |
Mass Limit of Detection (molecules) |
|---|---|---|---|
| GM1-BODIPY-FL GM3-BODIPY-TMR LacCer-BODIPY-650/665 |
1.02 ± 0.03 1.07 ± 0.05 1.12 ± 0.04 |
2.22 ± 0.07 4.46 ± 0.43 2.49 ± 0.89 |
34 ± 1 67 ± 7 36 ± 13 |
Three-Color Homogenate Analysis
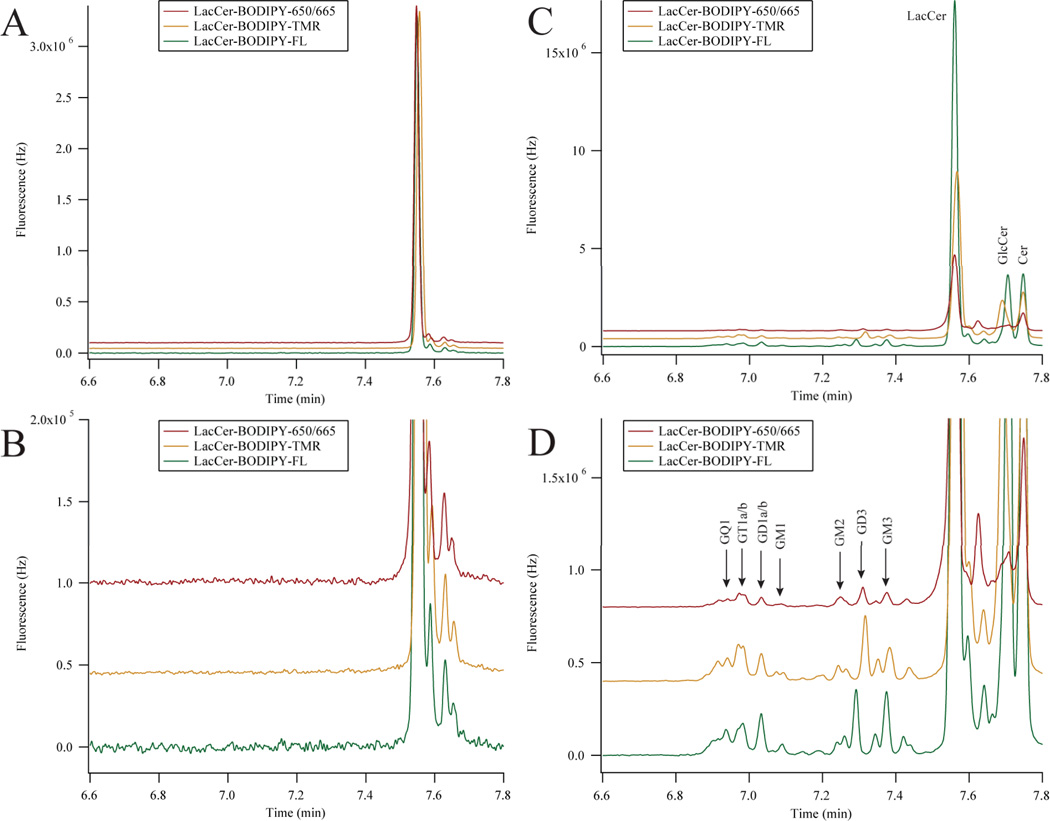
We have previously characterized GSL metabolism in PC12 cell homogenates.18 However, the addition of neuronal growth factor induces the adrenal PC12 cell line to differentiate into a neuronal-like cell line.25 dPC12 cells exhibit arrested cell division, growth of neuronal-like processes, and are electrically excitable.33 Here, dPC12 cells were simultaneously incubated with LacCer-BODIPY-FL, LacCer-BODIPY-TMR, and LacCer-BODIPY-650/665 to demonstrate the ability of the system to characterize GSL metabolism in an in vitro neuronal cell model. The results from the metabolic cytometry experiment are shown in Figure 6.
Figure 6.
Three-color metabolic cytometry in dPC12 cells. A) Three-color electropherogram of a 3.3 nM dilution of the incubation medium containing LacCer-BODIPY-FL, LacCer-BODIPY-TMR, and LacCer-BODIPY-650. B) Blowup of the relevant portion of A). C) Three-color electropherogram of cellular homogenate after fluorescent-GSL incubation. D) Expansion of the relevant portion of C). BODIPY-FL and BODIPY-650/665 traces were multiplied by 7.7 and 2.9 (respectively) in all panels and traces were vertically offset for clarity. Electropherograms in C) and D) were aligned for analyte identification. Peak assignments were made according to the text.
The GSL-BODIPY conjugates were diluted in cell medium and complexed with methyl-β-cyclodextrin prior to being added to cultured dPC12 cells. A three-color electropherogram of this incubation medium is presented in Figures 6A and 6B. Differences in the BODIPY structure minimally affected the MECC separation. LacCer-BODIPY-FL migrated 0.1 s before LacCer-BODIPY-650/665 and LacCer-BODIPY-TMR migrated approximately 0.5 s afterwards. Each of the LacCer-BODIPY conjugates contained a small amount of fluorescent impurities that migrated slightly after the main LacCer peaks, but no other GSLs were detected.
Figures 6C and 6D show three-color electropherograms of dPC12 cellular homogenate after the incubation with the LacCer-BODIPY conjugates. Both anabolic and catabolic products were detected in all channels. The anabolic products resulting from the addition of saccharides to the LacCer-BODIPY substrates migrated earlier than the substrate in the MECC-based separation and the catabolic products resulting from the removal of saccharides migrated after the LacCer-BODIPY substrates.
The identity of the metabolic products was confirmed by spiking in known single analyte BODIPY-FL GSLs.20 Rather than chemoenzymatically preparing all GSLs conjugated with each BODIPY-fluorophore, each of the single color electropherograms were aligned to correct for the subtle differences in migration time between the BODIPY-FL, BODIPY-TMR, and BODIPY-650/665 GSLs. Once aligned, tentative identifications of metabolic products within the BODIPY-TMR and BODIPY-650/665 channels were made based on co-migration with BODIPY-FL conjugated GSLs.
The metabolism of each of the LacCer-BODIPY substrates in dPC12 cells generated the same anabolic and catabolic products, although small variations in the relative ratios of these metabolic products were detected. Metabolites that migrated before LacCer (GM3, GD3, GM2, GM1, GD1a/b, GT1a/b, and GQ1) originated from the addition of sialic acids, N-acetyl galactosamine, and galactose residues; these analytes were more hydrophilic than LacCer and migrated earlier in the MECC-based separation.20 Metabolites that migrated after LacCer (GlcCer and Cer) originated from the removal of galactose and glucose residues; these were more hydrophobic than LacCer and migrated later in the MECC-based separation.20 The metabolism of LacCer-BODIPY-TMR in dPC12 cells produced less of GM3 and the metabolism of LacCer-BODIPY-650/665 produced less GlcCer compared to the other traces. LacCer-BODIPY-FL and LacCer-BODIPY-650/665 have shown similar cellular distribution patterns when applied exogenously to cultured Drosophila neurons,24 here we demonstrate these substrates were also metabolized into similar products within neuronal-like cells.
The metabolism of the LacCer-BODIPY-FL in dPC12 cells shown here is nearly identical to that demonstrated in cultured primary cerebellar granule neurons isolated from mouse brain13, highlighting the use of dPC12 cells as a model neuronal system. Based on the differences in intensity, the uptake of the fluorescent GSL substrates followed the order LacCer-BODIPY-FL > LacCer-BODIPY-TMR > LacCer-BODIPY-650/665. This result suggests that the more hydrophobic the dye, the more easily it is inserted into the outer leaflet of the plasma membrane where it can then be trafficked intracellularly.31, 34
It is likely that the presence of semi-isolated charges within the fluorophore structure could affect uptake, intracellular transport, and metabolism. Like tetramethylrhodamine, the BODIPY fluorophores are zwitterionic. However, the negatively charged boron and the positively charged nitrogen are adjacent within the BODIPY fluorophores while the carboxylic acid and substituted amine functional groups within tetramethylrhodamine are physically separated. Indeed, tetramethylrhodamine-labeled GSLs demonstrate weaker cellular uptake and only undergo catabolism in neuronal cells.12, 13
Conclusion
Here we present the development and characterization of a capillary electrophoresis system with ultrasensitive three-color laser-induced fluorescence detection. Chemoenzymatic methods were used to prepare novel BODIPY-conjugated GSLs. Neuronal-like dPC12 cells were incubated with these fluorescent probes and various anabolic and catabolic products were detected. The structure of the BODIPY fluorophore was shown to play a role in the efficiency of cellular uptake. Future work will involve tailoring the properties of the fluorophore to monitor specific metabolic pathways associated with disease in primary neuronal cells.
Acknowledgements
We thank Ronald Schnaar and Oluwatosin Dada for helpful discussions. This work was supported by the National Institutes of Health (R01NS061767).
References
- 1.Schnaarn RL. In: Neuroglycobiology. Fukuda M, Rutishauser U, Schnaar RL, editors. Oxford ; New York: Oxford University Press; 2005. pp. 95–113. [Google Scholar]
- 2.Schnaar RL, Suzuki A, Stanley P. In: Essentials of Glycobiology. 2nd edn. Varki A, Cummings RD, Esko JD, Freeze HH, Stanley P, Bertozzi CR, Hart GW, Etzler ME, editors. Cold Spring Harbor (NY): 2009. [PubMed] [Google Scholar]
- 3.De Maria R, Lenti L, Malisan F, d'Agostino F, Tomassini B, Zeuner A, Rippo MR, Testi R. Science. 1997;277:1652–1655. doi: 10.1126/science.277.5332.1652. [DOI] [PubMed] [Google Scholar]
- 4.De Maria R, Lenti L, Malisan F, d'Agostino F, Tomassini B, Zeuner A, Rippo MR, Testi R. Science. 1998;280:359–359. doi: 10.1126/science.277.5332.1652. [DOI] [PubMed] [Google Scholar]
- 5.Obata K, Oide M, Handa S. Nature. 1977;266:369–371. doi: 10.1038/266369a0. [DOI] [PubMed] [Google Scholar]
- 6.Hakomori S. Cancer Res. 1996;56:5309–5318. [PubMed] [Google Scholar]
- 7.Sango K, Yamanaka S, Hoffmann A, Okuda Y, Grinberg A, Westphal H, McDonald MP, Crawley JN, Sandhoff K, Suzuki K, Proia RL. Nat. Genet. 1995;11:170–176. doi: 10.1038/ng1095-170. [DOI] [PubMed] [Google Scholar]
- 8.Schnaar RL, Needham LK, William GWH, Lennarz J. Methods Enzymol. 1994;230:371–389. doi: 10.1016/0076-6879(94)30025-9. [DOI] [PubMed] [Google Scholar]
- 9.Ivleva VB, Elkin YN, Budnik BA, Moyer SC, O'Connor PB, Costello CE. Anal. Chem. 2004;76:6484–6491. doi: 10.1021/ac0491556. [DOI] [PubMed] [Google Scholar]
- 10.Sisu E, Flangea C, Serb A, Rizzi A, Zamfir AD. Electrophoresis. 2011;32:1591–1609. doi: 10.1002/elps.201100067. [DOI] [PubMed] [Google Scholar]
- 11.Ju DD, Lai CC, Her GR. J. Chromatogr. A. 1997;779:195–203. doi: 10.1016/s0021-9673(97)00391-9. [DOI] [PubMed] [Google Scholar]
- 12.Essaka DC, Prendergast J, Keithley RB, Hindsgaul O, Palcic MM, Schnaar RL, Dovichi NJ. Neurochem. Res. 2012;37:1308–1314. doi: 10.1007/s11064-012-0733-1. [DOI] [PMC free article] [PubMed] [Google Scholar]
- 13.Essaka DC, Prendergast J, Keithley RB, Palcic MM, Hindsgaul O, Schnaar RL, Dovichi NJ. Anal. Chem. 2012;84:2799–2804. doi: 10.1021/ac2031892. [DOI] [PMC free article] [PubMed] [Google Scholar]
- 14.Krylov SN, Arriaga EA, Chan NW, Dovichi NJ, Palcic MM. Anal. Biochem. 2000;283:133–135. doi: 10.1006/abio.2000.4648. [DOI] [PubMed] [Google Scholar]
- 15.Krylov SN, Starke DA, Arriaga EA, Zhang ZR, Chan NWC, Palcic MM, Dovichi NJ. Anal. Chem. 2000;72:872–877. doi: 10.1021/ac991096m. [DOI] [PubMed] [Google Scholar]
- 16.Krylov SN, Zhang Z, Chan NW, Arriaga E, Palcic MM, Dovichi NJ. Cytometry. 1999;37:14–20. doi: 10.1002/(sici)1097-0320(19990901)37:1<14::aid-cyto2>3.0.co;2-j. [DOI] [PubMed] [Google Scholar]
- 17.Whitmore CD, Hindsgaul O, Palcic MM, Schnaar RL, Dovichi NJ. Anal. Chem. 2007;79:5139–5142. doi: 10.1021/ac070716d. [DOI] [PubMed] [Google Scholar]
- 18.Whitmore CD, Olsson U, Larsson EA, Hindsgaul O, Palcic MM, Dovichi NJ. Electrophoresis. 2007;28:3100–3104. doi: 10.1002/elps.200700202. [DOI] [PubMed] [Google Scholar]
- 19.Larsson EA, Olsson U, Whitmore CD, Martins R, Tettamanti G, Schnaar RL, Dovichi NJ, Palcic MM, Hindsgaul O. Carbohydr. Res. 2007;342:482–489. doi: 10.1016/j.carres.2006.10.002. [DOI] [PMC free article] [PubMed] [Google Scholar]
- 20.Sarver SA, Keithley RB, Essaka DC, Tanaka H, Yoshimura Y, Palcic MM, Hindsgaul O, Dovichi NJ. J. Chromatogr. A. 2012;1229:268–273. doi: 10.1016/j.chroma.2012.01.031. [DOI] [PMC free article] [PubMed] [Google Scholar]
- 21.Haugland RP. The Handbook: A Guide to Fluorescent Probes and Labeling Technologies. U.S.A.: Invitrogen Corporation; 2005. [Google Scholar]
- 22.Jacques S, Rich JR, Ling CC, Bundle DR. Org. Biomol. Chem. 2006;4:142–154. doi: 10.1039/b513595h. [DOI] [PubMed] [Google Scholar]
- 23.Gilbert M, Brisson JR, Karwaski MF, Michniewicz J, Cunningham AM, Wu Y, Young NM, Wakarchuk WW. J. Biol. Chem. 2000;275:3896–3906. doi: 10.1074/jbc.275.6.3896. [DOI] [PubMed] [Google Scholar]
- 24.Hortsch R, Lee E, Erathodiyil N, Hebbar S, Steinert S, Lee JY, Chua DS, Kraut R. Mol. Biol. Cell. 2010;21:778–790. doi: 10.1091/mbc.E09-01-0005. [DOI] [PMC free article] [PubMed] [Google Scholar]
- 25.Greene LA, Tischler AS. Proc. Natl. Acad. Sci. U. S. A. 1976;73:2424–2428. doi: 10.1073/pnas.73.7.2424. [DOI] [PMC free article] [PubMed] [Google Scholar]
- 26.Pagano RE, Watanabe R, Wheatley C, Dominguez M. Methods Enzymol. 2000;312:523–534. doi: 10.1016/s0076-6879(00)12937-4. [DOI] [PubMed] [Google Scholar]
- 27.Chen D, Harke HR, Dovichi NJ. Nucleic Acids Res. 1992;20:4873–4880. doi: 10.1093/nar/20.18.4873. [DOI] [PMC free article] [PubMed] [Google Scholar]
- 28.Whitmore CD, Essaka D, Dovichi NJ. Talanta. 2009;80:744–748. doi: 10.1016/j.talanta.2009.07.060. [DOI] [PMC free article] [PubMed] [Google Scholar]
- 29.Jorgenson JW, Lukacs KD. Anal. Chem. 1981;53:1298–1302. [Google Scholar]
- 30.Sobhani K, Michels DA, Dovichi NJ. Appl. Spectrosc. 2007;61:777–779. doi: 10.1366/000370207781393208. [DOI] [PubMed] [Google Scholar]
- 31.Pagano RE, Martin OC, Kang HC, Haugland RP. J. Cell Biol. 1991;113:1267–1279. doi: 10.1083/jcb.113.6.1267. [DOI] [PMC free article] [PubMed] [Google Scholar]
- 32.Hakomori S, Nudelman E, Levery SB, Kannagi R. J. Biol. Chem. 1984;259:4672–4680. [PubMed] [Google Scholar]
- 33.Teng KK, Angelastro JM, Cunningham ME, Greene LA. In: Cell Biology. Third Edition. Julio EC, editor. Burlington: Academic Press; 2006. pp. 171–176. [Google Scholar]
- 34.Merrill AH., Jr Chem. Rev. 2011;111:6387–6422. doi: 10.1021/cr2002917. [DOI] [PMC free article] [PubMed] [Google Scholar]


