Abstract.
Dynamic indocyanine green imaging uses a scanning laser ophthalmoscope and a fluorescent dye to produce movies of the dye-filling pattern in the retina and choroid of the eye. It is used for evaluating choroidal neovascularization. Movies are examined to identify the anatomy of the pathology for planning treatment and to evaluate progression or response to treatment. The popularity of this approach is affected by the complexity and difficulty in interpreting the movies. Software algorithms were developed to produce images from the movies that are easy to interpret. A mathematical model is formulated of the flow dynamics, and a fitting algorithm is designed that solves for the flow parameters. The images provide information about flow and perfusion, including regions of change between examinations. Imaged measures include the dye fill-time, temporal dispersion, and magnitude of the dye dilution temporal curves associated with image pixels. Cases show how the software can help to identify clinically relevant anatomy such as feeder vessels, drain vessels, capillary networks, and normal choroidal draining vessels. As a potential tool for research into the character of neovascular conditions and treatments, it reveals the flow dynamics and character of the lesion. Future varieties of this methodology may be used for evaluating the success of engineered tissue transplants, surgical flaps, reconstructive surgery, breast surgery, and many other surgical applications where flow, perfusion, and vascularity of tissue are important.
Keywords: blood flow, indocyanine green, neovascularization, perfusion, retina, tissue, high speed angiography, dynamic indocyanine green angiography, dynamic fluorescein angiography, videoangiography, age related macular degeneration, choroid
1. Introduction and Medical Significance
Indocyanine green (ICG) is a light-absorbing dye that historically was used with transmissive light for measuring cardiac output1 and is now used as a fluorescent dye for monitoring blood perfusion for a variety of applications, including liver function1,2 and surgical flap evaluation.3 In ophthalmics, it is used to create vasculature images. Advantages compared to fluorescein angiography (FA) are the following:
-
1.
The compound binds to serum protein2 so that only a small percentage leaks into surrounding tissue (most notably in the choriocapillaris) unless there is a real vascular leakage due to pathology.
-
2.
Its long excitation and emission wavelengths2 (750 and 830 nm, respectively) enable penetration into the choroid, so it is used for choroidal vasculature.
FA is more popular for evaluating retinal vasculature. It is used with standard fundus photography and scanning laser ophthalmoscopes (SLOs) equipped with fluorescence. In this article, we refer to this modality as static FA when single images are examined without using a movie. Static FA is the staple for evaluating blood leakage, which helps to evaluate if the neovascular condition is worsening or resolving due to treatment. Leakage is a good measure of a worsening neovascular condition.4 Static FA is better suited for seeing retinal vasculature without choroidal vasculature, as in diabetic conditions, because its shorter wavelength penetrates little beyond the retinal pigment epithelium—leaving an image primarily of retinal vasculature.
With dynamic ICG (d-ICG) imaging, a bolus injection of dye is administered while a movie of the dynamic filling pattern is taken using the SLO. The movie is interpreted by a practitioner to evaluate the neovascular condition and to evaluate if the condition has progressed or reduced. A similar procedure, called dynamic fluorescein angiography (d-FA), may be used with FA. Interpretation of d-ICG and d-FA is difficult to learn, however, which has affected the popularity of these methods. Because they show complementary information in the retina and choroid, respectively, static FA, d-ICG, and optical coherence tomography (OCT),5 described later in this article, are often imaged simultaneously.6,7
Algorithms were designed that produce d-ICG images that are easier to interpret compared to movies. Imaged measures include the peak magnitude, dye fill-time, and dispersion of the dye dilution temporal curves associated with image pixels. The approach uses a mathematical model of the flow dynamics. The flow parameters in the model are solved by fitting the model to the collected movie data. The criterion for the fit is a minimization of the I-divergence function. The minimum value of the I-divergence function is solved where the flow parameters are treated as solved unknowns. A subset of the parameters that are mathematically solved for this equation become the measurements that are presented in the en face image pixels.
Example cases show how the software can help identify clinically relevant anatomy such as feeder vessels, drain vessels, capillary networks, and normal choroidal draining vessels. The images have potential to evaluate progression of the condition and response to treatment. The images reveal flow dynamics and, thereby, they are a potential tool for research into neovascular and other conditions that affect blood flow.
In a typical scenario, the patient is injected with a 1 cc bolus of 10% concentration ICG dye in a saline solution, followed by a 5-cc saline flush. A movie is recorded at , using an SLO. At about 2 s from the start of the dye injection, the movie shows the first fluorescence, with a peak intensity typically at about 10 s. To observe the rise and decay of the intensity in a pixel, the ideal movie duration is about 30 s long, although this is difficult to achieve consistently in a clinical environment. Realistically, the movie will be 10 to 30 s long.
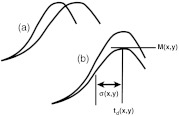
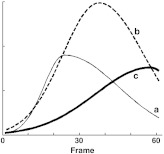
The unprocessed movie reveals dye filling dynamics, which in turn provide information about the progression of neovascularization or response to treatment. Generally, as illustrated in Fig. 1, it is thought that increases or decreases in flow velocity will cause the rate at which the pixel becomes bright to increase or decrease, respectively, and to arrive sooner or later, respectively, and that higher blood volume will result in brighter pixels at the peak of the curve. This modality is used for neovascular conditions, including categories of choroidal neovascularization (CNV)8–11 that are hallmarks of age-related macular degeneration (AMD). Categories of retinal neovascularization that are hallmarks of diabetic retinopathy are often detected and evaluated using the fluorescein fluorescent dye with a traditional fundus camera.12 They may also be evaluated using static FA images collected with the d-FA modality.
Fig. 1.
(a) Increased blood velocity in the vessel will cause the rising slope to increase. (b) Increasing blood volume in the vessel will cause the peak magnitude to increase.
Even though the work presented here focuses on d-ICG and CNV, variants of the method ought to work with diabetic conditions and d-FA, and with other choroidal and retinal conditions that affect blood perfusion. We speculate that a future variant will also be useful for studying, characterizing, and evaluating retinal vein occlusions, including central retinal vein occlusion (CRVO) and branch retinal vein occlusion (BRVO), since changes in those conditions affect the flow dynamics through the affected vessels. Future variants of this methodology may be used for evaluating engineered tissue transplants, surgical flaps, reconstructive surgery, breast surgery, and many other surgical applications where flow, perfusion, and vascularity of tissue are important.
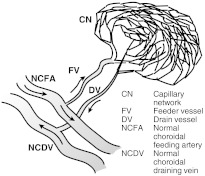
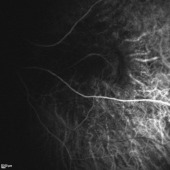
The d-ICG movie provides information that cannot be seen in static FA, d-FA, or OCT. It shows blood flow in the choroid dynamically. The filling of the choroidal vasculature can be evaluated, revealing pathological delays and abnormal filling patterns. When there is a neovascularization, such as in wet AMD or myopic CNV, the whole structure of the lesion can be appreciated and analyzed while differentiating its features. The feeder vessels that supply the neovascular complex (Figs. 2–4) can be identified by their early filling. The capillary network (CN), especially with occult CNV, which is generally not detectable with static FA, fills just after the feeder vessels (FVs) and can be studied and evaluated for its extent and shape. After these parts of the neovascular complex have perfused, the drain vessels (DVs) become identifiable as the dye starts to flow through them. All of these steps in a d-ICG examination provide important information that is not provided by static FA or OCT images. Once the practitioner is accustomed to examining d-ICG movies, it becomes possible to evaluate characteristics of blood flow that, although not quantitative, reflect velocity and blood volume. The training to become adept at such interpretation can be difficult, and this affects the popularity of d-ICG. The methods developed in this article are aimed at making this interpretation straightforward. They provide a quantitative and objective meaning to such evaluations. (All of the images presented in this article were produced from a Heidelberg Spectralis scanner with OCT, d-ICG, and d-FA capabilities.)
Fig. 2.
Prototypical anatomy of a neovascular lesion.
Fig. 3.
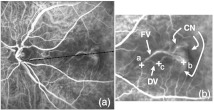
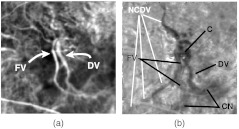
(a) Sum projection. (b) Cropped section with contrast manipulation to see the FV, CN, and DV.
Fig. 4.
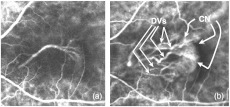
(a) Early frame showing the FV and its downstream branches that feed the CN. (b) Late frame showing the CN and DVs.
OCT is useful for seeing neovascularization changes and tissue thickening. It is used alongside static FA and, in some settings, including ours, alongside d-ICG as well. Experimental OCT systems provide flow information using Doppler principles.13 d-ICG and the imaging methods in this article provide information different from OCT. With Doppler OCT, the flow information is presented as an cross section, so images and movies show the flow through an cross section of the vessel, compared to the images here that are en face maps.
Figure 2 illustrates a prototypical anatomy of a neovascular lesion. No lesion perfectly follows this prototype, but the practitioner should consider this when evaluating movies. Table 1 lists clues for finding components.
Table 1.
Prototypical features of neovascular lesion.
| Component | Clues |
|---|---|
| FV | Runs parallel to or overlays with the drain vessel (DV) |
| Caliber widens downstream | |
| Attached upstream to a normal choroidal feeding artery (NCFA) and downstream to the capillary network (CN) | |
| First vessel in the lesion to fill with dye, and first to decay | |
| DV | Runs parallel to or overlays with the FV |
| Caliber widens downstream | |
| Attached upstream to the CN and downstream to a normal choroidal draining vein (NCDV) | |
| Last vessel in the lesion to fill with dye, and last to decay | |
| CN | Pointed to by the FV and DV and distal to the NCFA and NCDV. |
| NCFA | Runs roughly perpendicular to the FA |
| NCDV | Runs roughly perpendicular to the DV |
In reality, the CN, FV, and DV may be located anywhere in the lesion, the FV and DV may not run perfectly parallel to each other or perpendicular to the NCDV and NCFA, and there may be more than one FV, DV, or CN. The software helps by making the anatomy clearer and, by indicating the timing of the dye filling, to see which vessels fill sooner or later than others. In general, the FV, CN, DV, and NCDV will fill progressively later in relation to one another, and the software can provide an appreciation for the upstream and downstream portions of these components.
The predominant therapies whose evaluation are facilitated by d-ICGA include FV therapy (FVT), where the FVs and/or DVs are laser photocoagulated;9,11,14 photodynamic therapy (PDT);14,15 and anti-VEGF injection therapy.14–16 These therapies are generally aimed at destroying the lesion. Response to treatment or progression, respectively, is evaluated by a decreased or increased leakage, which can be seen in the static FA image. The OCT exam helps evaluate response to treatment or progression by showing decreased or increased size of the lesion, respectively, and by other features that are described in examples later in Sec. 3. Unlike OCT, d-ICG shows both function and structure.
The software will help in several ways. When evaluating changes in the lesion, the physician considers a baseline examination, which is an examination carried out on an early date and serves as a reference point for seeing if changes are occurring. The later examination, where possible changes are evaluated, is called the follow-up examination. By watching a movie (i.e., the follow-up movie), he or she looks for differences compared to the baseline movie and does so by watching the movies play side by side on a computer screen. In making such a comparison, some of the vessels in a lesion that progress or respond to treatment will become brighter or darker in the follow-up, respectively, but this is sometimes difficult to evaluate. The boundaries of the CN may be difficult to see and are thereby only generally located. It is important to know the locations of the anatomy illustrated in Fig. 2 because the decisions and treatment planning of FVT and PDT rely on knowing these locations. The proposed software will help in this way. PDT relies upon aligning the activation laser spot onto the CN and FV while avoiding healthy surrounding tissue. FVT relies on photocoagulating the FVs, so their positions must be pinpointed. The choice of therapy is affected by the accurate location of the components. If the FV is near the macular, FVT is ruled out to avoid causing a scotoma, and if the CN is in the macula, PDT is ruled out for the same reason.
The anatomy and flow-dynamic behavior of neovascular lesions can be difficult to identify from the movies alone because, although the information presented in Fig. 2 and Table 1 provide guidance, neovascularizations never comply with them perfectly. It is difficult to ascertain which vessels fill the soonest. The FV and DV can be short, thin, dim, and hidden in a nest of vessels. Adversities that contribute to these problems include anatomical variations between patients, vignetting, flicker, eye motion, and low-light levels. Table 2 explains some of these. Such issues have contributed to the lack of popularity of d-ICGA and FVT that rely on it, and have motivated this study. There is a need to summarize, visually and objectively, the dynamics of the dye filling. There is a need to provide objective measures from which the physician can evaluate response to treatment or progression. Furthermore, examples presented here show that the measures reveal perfusion behavior that cannot be seen any other way, so the algorithms are also a potential tool for research into the character of neovascular lesions.
Table 2.
Sources of noise and adversities in the movies.
| Effect | How it is presented | Cause | Demonstrated |
|---|---|---|---|
| 1. Image motion | Random frame-to-frame , shifts | Patient motion, saccadic eye motion, camera movement | Fig. 5 |
| 2. Flicker | Random frame-to-frame brightness | Random changes of the lighting caused by patient motion, eye motion and camera movement | Some of the random fluctuations in Fig. 6 are from flicker |
| 3. Wandering bright spot | The lighting is nonuniform, and its central bright spot wanders frame to frame | Vignetting that changes between frames due to patient motion, eye motion, and camera movement | Fig. 7 |
| 4. Quantum and electronic noise | Graininess in the image and time plots | Quantum photon noise and electronic noise of the SLO’s photodetector | Some of the fluctuations seen in Fig. 6 are from this effect |
| 5. Cardiac pulsations | Low-frequency beats in the time plots | The dye fill is not smooth. It fills rhythmically with the cardiac cycle | Fig. 6 |
| 6. Background fluctuations | The black region becomes brighter and darker between frames and in the same frame | Stray and scattered light that changes when the patient, eye, or camera moves | Some of the random fluctuations in Fig. 6 are from this effect |
| 7. Blinking | Black sections in a frame and completely black frames | Eye blinks | Not shown |
| 8. Temporally truncated plot | The intensity curve stops before reaching a peak | Patient noncompliance or technician preference to stop the collection early | Not shown |
| 9. Saturated pixels | The brightest regions of the plot are above the highest value detectable by the photodetector | Dynamic range of the SLO’s photodetector and its analog-to-digital converter | Not shown |
| 10. Variation in injection administration | Rising slope of the curve varies from injection to injection | Inconsistent injection rate administered | Not shown |
2. Principles
2.1. Overview and Practical Adversities
Figures 3 and 4 show a sum projection and two frames from an exemplary movie. The early and late frames in Fig. 4 show the FV and DVs, respectively.
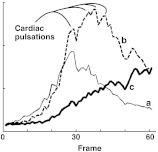
The measures were defined in Fig. 1, which depicted an ideal intensity curve of a pixel. The curve is modeled as a Gaussian function. To understand the justification of a Gaussian function, consider that the bolus injection is met by mixture in the vasculature, where the dye solution mixes with the blood in a turbulent environment. This process is analogous to a rapid pollutant emission in the atmosphere, which makes a turbulent mixture of gases. The result is a Gaussian plume, meaning that the concentration follows a Gaussian function.17,18 The Gaussian plume of dye concentration in the blood traveling past a hypothetical concentration sensor at a certain flow rate then behaves as a Gaussian function of time. The dispersion measure is the standard deviation of the Gaussian function. As explained later, the software automatically estimates these measures and displays them as en face images, where is the index of the pixel location.
These parameters are difficult to measure directly because of noise. Figure 6 shows curves that correspond to , , and c in Fig. 3. This noise corrupts the consistency of the measured parameters.
Fig. 6.
Time plots of the three points (, , ) noted in Fig. 3.
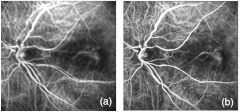
Table 2 summarizes many of the adversities to the imaging. Figure 5 demonstrates the need for motion correction. The vessels are misaligned between frames [Fig. 5(a)]. This problem is corrected by an automated alignment (discussed in the appendix of this article) prior to using the algorithm in Sec. 2.2.
Fig. 5.
(a) Overlay (sum) of frames showing eye motion. (b) Overlay after automatic alignment.
Figure 7 demonstrates the wandering spot vignetting problems.19 Blinking, saturated pixels, and the truncated plot cause data to be missing. The cardiac pulsations, quantum/electronic noise, and other noise sources are all considered to be noise. They are dealt with by the I-divergence algorithm presented later in this article, which inherently assumes noise in the collected signal.
Fig. 7.
Wandering bright spot. A frame where the illumination is favoring the lower right and shading is predominant on the left and upper portions. Other frames show the center of this spot moving randomly. There is also a flicker where the picture brightens and darkens randomly between frames.
The mixing of the dye, which produces the temporal dispersion , has several problems that cause variations. There are variations in the injection pulse shape and width because the technician cannot produce an identical injection each time. The cardiac output and autoregulation of flow to and within the eye will change from one session to another. The I-divergence minimization approach, described later in this article, helps to deal with such problems by including the parameter within those that are estimated, thereby accommodating the fluctuation.
2.2. Model
2.2.1. Bolus dispersion and delay
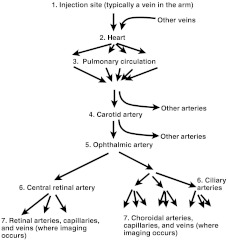
The model formulation is built upon a thought experiment. Consider that a dye injection is administered at time , where the reference zero is the time at the middle of the bolus injection. The dye is injected into a vein in the arm. The dye travels from the injection site through the channels in Fig. 8 and becomes detected by the camera in Stage 7. The concentration of dye at the injection site is expressed as
| (1) |
where is the time index and is a zero-mean Gaussian function of unit area and standard-deviation . The standard deviation models the amount of time taken for the injection, which will typically be 2 to 5 s, including the dye and the flush.
Fig. 8.
Circulation channels that cause delay, mixing, and dispersion of the dye.
Through the journey from the injection site to the ophthalmic artery, the dye undergoes a time delay and mixes with the blood. Three factors affect the time variation of the concentration at an ophthalmic artery point:
-
1.
The flow velocity at the ophthalmic artery point is different than the flow velocity in the vein at the injection site, causing the time axis to scale and thereby making the concentration signal equal to , where is the ratio of velocity at the injection site divided by the velocity at the ophthalmic artery.
-
2.The bolus signal is delayed by the travel time and thereby makes the concentration at the ophthalmic artery equal to
where is what the concentration would be if only time delay and velocity change are considered, and dispersion due to mixing is ignored. The only change here is that the variable was substituted by . This substitution is the standard way of modeling any time delay of any signal.(2) -
3.There is a mixing of the dye with the blood that causes it to, in effect, diffuse through the length of the vessels. Such a diffusion of a concentration causes the concentration to convolve with a Gaussian function of an unknown standard deviation,17,18 expressed as
where denotes the dye concentration at the point in the ophthalmic artery and represents the convolution operator. When one Gaussian function is convolved with another, the result is another Gaussian function with a standard deviation equal to the square root of the sum of the squares of the original two Gaussian functions. Therefore:(3) (4)
There are many underlying parameters in Eqs. (1)–(4). In Sec. 2.2.3 later in this article, the formulas are simplified into fewer parameters. Even so, it is important to know all of these parameters to understand the physical and physiological underpinnings, for understanding causes of variability, and for developing substantiated interpretations of the images. Future extended models could measure flow, velocity, and other parameters by understanding these underpinnings. Interpretations of the causes of measurement differences between examinations and subjects can thereby be partly explained by physiological variations that cause fluctuations in these parameters, so it could become critically important for future clinical applications to know what they are.
The signals associated with the channels denoted as Stage 7 in Fig. 8 are the ones that are imaged. Each pixel in the image represents a point in these channels. For each location, the concentration signal will experience a unique delay and additional dispersion compared to the ophthalmic artery site, caused in part by the vascular branching and in part by being at a unique point downstream. Thereby, from Stage 5 to a point in Stage 7, the concentration undergoes time-delay , velocity ratio , and further mixing with unknown standard deviation . The same type of time delay, velocity change, and mixing that caused to become the in Eq. (4) is now applied to to become . We then have the following concentration occurring at point in Stage 7:
| (5) |
where later becomes a spatial index because the concentration is measured by the SLO and is the ratio of velocity at the ophthalmic artery site divided by the velocity at point .
2.2.2. Flicker, vignetting, and pulsations
The SLO is the concentration sensor, which takes photographs of at indexed points , which represent the pixel locations, and , which is the time index of the movie frames. This movie is modulated by attenuation of the signal due to several factors, including absorption and scatter of the light by the tissue and blood vessel thicknesses along the axial direction that cause differing fluorescent signal to be emitted towards the detection optics. Therefore, we introduce the modulation functions , and according to
| (6) |
where
| (7) |
The term represents modulation due to blood volume, including the effects of vessel thickness, represents modulation due to tissue absorption and scatter, and is the modulation due to optical and electronic instrumentation variations.
Next, we consider eye motion, which causes three problems:
-
1.
The image moves randomly from frame to frame. This problem is corrected using algorithms19,20 that are summarized in the appendix. The model assumes that this motion has already been corrected.
-
2.
A flicker occurs and is modeled as an intensity modulation .
-
3.Random vignetting causes the wandering spot. This effect is modeled by a spatial modulation , which is a 2-D Gaussian function according to
where denotes a 2-D Gaussian function with standard deviations of and along and , respectively. This Gaussian function shifts randomly along and and its horizontal and vertical widths change randomly from frame to frame, according to the terms , , , and , respectively.(8)
There is a background level caused by dark current in the photodetector, stray light, scatter, and other factors, so that the signal detected by the camera is
| (9) |
The cardiac cycle causes pulsations to occur on the signal that have a similar appearance as noise (Fig. 6) but represent real signals that carry useful information relevant to cardiac activity. These pulsations are roughly periodic, although they change in magnitude, frequency, phase, and shape during the collection. As a first attempt at considering them, they are treated as noise. Future extended models could produce images that reflect information about localized cardiac signal phase, frequency, magnitude, and vascular impedance.
The correction of the data for flicker and vignetting is inherent in the I-divergence algorithm described later in this article. The algorithm produces estimates of , , , and , while finding a fit to the noisy movie data. The noise-free signal is, in a sense, the corrected movie. It is corrected in the sense that it has the terms , , and removed. It contains the information to produce the images of , and . The signals and are a byproduct of the algorithm that are needed only to produce the model fit, but are not used by the practitioner.
2.2.3. Measurements
Table 3 lists the parameters that are produced as images, which are defined below. Figures 9–12 show examples.
| (10) |
| (11) |
| (12) |
Table 3.
Parameters of the model of Eq. (9) to be solved.
Fig. 9.
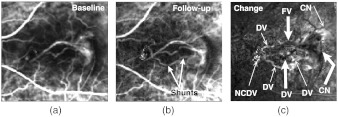
Magnitude images produced from the data sets of Fig. 3. (a) Baseline, (b) follow-up and (c) change (). The eye underwent anti-VEGF (Bevacizumab/Avastin) injection treatment. The shunts in (b) are new DVs. In (c), the thick arrows point at dark vascular regions, implying decreased perfusion. The thin arrows point at bright vascular regions, implying increased perfusion. The portion labeled as CN with a thin arrow on the upper right could be an increased activity in the CN that is also seen in a static FA image.
Fig. 10.
Fitted Gaussian curves corresponding to Fig. 6.
Fig. 11.
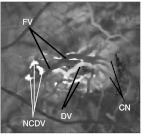
Fill-time image corresponding to Fig. 9(a). The components indicated are identifiable by understanding Fig. 2 and knowing: (1) the FV has the earliest fill, so it is the darkest vessel in the lesion and (2) the CN, DVs, and NCDVs are progressively downstream and have progressively later fills, so they become progressively brighter.
Fig. 12.
Dispersion images .
To produce these measurements, the unknown parameters in Eq. (9) are solved (Table 4). By themselves, these parameters may not all have obvious physiological interpretations. They are substituted into the expressions in the right column of Table 3 to calculate images of the measures in the left column that have physiological interpretations. They are solved by minimizing the I-divergence function, explained next.
Table 4.
Unknown parameters to be solved.
| A. Function contained within | B. Parameters to be solved |
|---|---|
| , | |
| , , , | |
| , |
The changes in , , and , between a baseline and follow-up examination, carry potentially valuable information for diagnosing, studying, and characterizing conditions and their treatments. Changes in reflect changes in mixing, which in turn reflect changes in local flow. A decrease in reflects a decrease in mixing, and thereby an increased local velocity or flow. Changes in , when caused by either the absorption component or blood-volume component , reflect changes in tissue characteristics or blood volume. For example, an increase or decrease in would reflect an increase or decrease, respectively, in the caliber of vessels or the number of capillaries affecting the pixel. Changes in reflect changes in velocity and flow.
From Eqs. (10 to 12), we see that variabilities in , , and will be adversely affected by parameters that could change between examinations. The term will be affected by variations in systemic flow, will be affected by the bolus injection, will be affected by variations in systemic flow, and will be affected by drifts in electronic instrumentation and optical alignment. Pulsations will be affected by the heart rate, stroke volume, and other cardiac parameters that may be considered in future models.
In an effort to correct the variability, it would be advantageous to extend the I-divergence algorithm to estimate , , and , and then to correct the recovered , , and for them. This will be the subject of future research. As a first approach, instead, we normalize these measurements. Each measurement is normalized to its own average value within an examination. We then create a comparison image for showing changes by taking a ratio of the normalized parameters. These normalizations and comparisons are expressed by
| (13) |
| (14) |
and
| (15) |
where the subscripts 1 and 2 indicate the baseline and follow-up examination for the indicated parameter, and are those of , and the bar indicates average over .
Measurements are produced by solving the parameters listed in the right column of Table 4 and then calculating using Eq. (11). This is done by the following process. First, let us postulate that the terms in the right column of Table 4 are known. Whether true or not, let us use this postulate to make the following points. Assuming that these values are known, then can be calculating by inserting and into Eq. (11) to calculate and then substituting all of these terms into Eq. (9). In this hypothetical situation, is a theoretical calculation of the collected movie that would occur if all the underlying parameters were known and there were no sources of noise. Now consider a real movie that is collected during an examination, called . Even if the underlying parameters that caused , are the same ones that cause , will never be exactly equal to because contains noise. If we were able to find a set of parameters (see column B of Table 4) that cause the model to be equal to , then we might be convinced that the parameters are correct. However, the reality is that no matter what, will never be equal to because the SLO image is noisy. The photodetector and other electronics produce noisy signals, and there is stray light, among other factors. The best we can do is to cause to be a reasonable fit to (i.e., close to but not equal to) . A mathematical tool for fitting two functions while not forcing them to be equal is the I-divergence objective function,21,22 described next. The I-divergence value is a function of the model and true data and it has its lowest value (i.e., it is minimized) when these two functions have their best fit.
The I-divergence is expressed as
| (16) |
The missing data caused by blinking, saturated pixels and truncated plots are considered by excluding all affected pixels from the set that defines the summation in Eq. (16).
is minimized over the parameters listed in column B of Table 4, which are solved to produce the minimum value of . An iterative numerical solution is used because a closed form solution does not exist. The steepest descent gradient approach is used to design the iterations of the algorithm.23,24 The parameters in the right column of Table 4 are specified as the unknown parameters, each of which must be solved. The values in the pixels of the unprocessed movie are specified as the known parameters. In summary, this steepest descent algorithm works as follows.
First, a reasonable first guess is calculated for every unknown parameter. For example, the first guess of for pixel is the time-index value where the raw-data curve (Fig. 6) reaches its peak and the first guess of may be 1.0 for every value, which is the least assuming guess. At each iteration, the partial derivative of with respect to each parameter is calculated. This partial derivative is easy to achieve because is made up of rudimentary algebraic terms, logarithms, and other terms for which it is straightforward to write down the derivative. This partial derivative indicates the direction and relative magnitude of the change that is needed to add to the parameter in order to cause a decrease in . All of the partial derivatives are then scaled by the over-relaxation coefficient . The value of is determined by solving it for the largest decrease in . Once is determined in this way, the unknown parameters are all changed by adding their calculated relative magnitude changes. The newly changed value of is then calculated and inserted into Eq. (16) to confirm that the value of decreased This partial derivative, overrelaxation-parameter, and addition process is then repeated in the next iteration.
Following these measurement calculations, the normalizations of Eqs. (13)–(15) are carried out to display images that indicate changes that occur between examinations.
3. Examples
3.1. Anti-VEGF Partial Responder Case
Figure 9 shows the baseline, follow-up, and change maps of magnitude for the case presented in Fig. 3 that underwent anti-VEGF treatment. The regions in Fig. 9(c) where activity increased and decreased are noted. The thick arrows point at the darkened FV, CN, and one of the DVs, implying decreased perfusion. This implies a response to the treatment. If perfusion decreases between examinations at location then will be less than , causing to have low values compared to surrounding tissue, thereby causing the image intensity at to be relatively dark. If perfusion increases, implying progression, will be greater than , causing to have high values compared to surrounding tissue, thereby causing the image intensity at to be relatively bright.
The spatial extent of the darkened CN shows what portions respond to the therapy. The thin arrows mark brightened DVs, implying increased perfusion. Some of the DVs are dark and some are bright, implying localized treatment response and progression, respectively. Consistent with this, the independent clinical evaluation from static FA and OCT showed that the lesion was partially respondent, as explained next, meaning that there were both signs of response and progression. Figure 10 shows time plots of that correspond to the noisy plots in Fig. 6.
Figure 11 shows the fill-time image corresponding to the baseline examination of Fig. 9(a). It shows that, as the vessel farthest upstream in the lesion, the FV fills earliest because it is dark, indicating a low value. The upstream portion of the FV is darker than its downstream portion. The CN, which is immediately downstream, fills later, as indicated by a brighter gray. The DVs have the latest fill, as shown by the brighter intensities. The NCDV is downstream from the DVs and thereby brighter than the DVs. It complies with Fig. 2 by running perpendicular to the DVs. There could be more than one NCDV, but only cross-sections can be seen and the NCDV is pointing out of the page. Images like Fig. 11 could help to identify the FV, DV, CN, and NCDV, which is important for deciding and planning therapies. Currently, the practitioner uses the movies by watching frame by frame and finding the early- and late-filling vessels following the prototypical anatomy. The CN cannot be seen directly in the movies, but the movie frames provide hints of where it resides. The practitioner looks for a region where the normal choroidal vessels are obscured, understanding that the CN overlays them. The CN is difficult to locate this way because lesions deviate from the prototypical anatomy and choroidal vessels can be obscured by other factors. The image would help in these difficult situations.
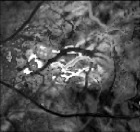
Figure 12 shows the dispersion image . It appears similar to Fig. 11 in that the vessels become increasingly bright downstream. A remarkable characteristic is that it shows laminar flow. The outlines of the large DV are bright, indicating higher dispersion and thereby lower flow. The change map (not shown) showed a laminar flow in the FV.
To help understand these images in relation to conventional clinical evaluations, Fig. 13 shows an OCT image5 corresponding to the dotted line in Fig. 3. The cystoid spaces, fibrovascular lesions, and hyper-reflective flecks are signs of lesion activity. The ill-defined (blurry) borders of the fibrovascular lesion are a further sign of activity. In the follow-up image (not shown), the cystoid spaces are smaller, the fibrovascular lesions are thinner, and the hyper-reflective flecks are reduced in contrast. The contrast of the dark space inside the fibrovascular lesion on the right is reduced, indicating that fluid content (edema) has reduced. In other words, the follow-up OCT image shows the same features that indicate that the lesion is active, but they are all reduced, indicating that activity is reducing and the lesion is responding to the treatment. Clinical evaluation of the static FA images (not shown) indicated increased leakage in areas that coincide with the areas of increased activity in Fig. 9(b) and 9(c). One of these is the seven o’clock region near the DV shunts, and the other is the two o’clock region near the upper-right of the CN, and labeled as CN with a thin arrow in the upper right of Fig. 9(c).
Fig. 13.
OCT section corresponding to the dotted line in Fig. 3, baseline examination. (1) Cystoid spaces. (2) Fibrovascular lesions. (3) Hyperreflective flecks.
These d-ICG images augment information from the OCT and static FA images in the following ways:
-
1.
The image reveals the anatomy, which affects decisions on the type of treatment and gives clues about where the leakage is occurring.
-
2.
The image reveals which parts of the lesion are increasing or decreasing in activity and corroborates the static FA. The OCT images indicated that lesion activity reduced overall, the static FA images indicated that the lesion activity decreased overall but increases in certain areas, and the d-ICG corroborates these FA and OCT findings while helping to pinpoint the location and nature of the increased and decreased activity (i.e., new DVs appeared and perfusion decreased in the CN and elsewhere).
3.2. Velocity Measurement and Flow Behavior
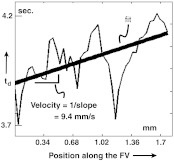
Figure 14 shows the measurement of velocity. The plot of as a function of distance along the FV is essentially a plot of the time of arrival of the dye front as a function of distance along the vessel. The noise is caused by crossover vessels. The line was fit by the least-squares method. The velocity measurement is the reciprocal of the line’s slope. Future improved versions of this algorithm that treat all of the terms in Eqs. (10) and (12) (, , , , , , ) as unknowns and solves them may provide velocity measurement throughout the whole image. This may be accomplished by solving for the velocity ratio to produce an image of the relative velocity and then converting these numbers to absolute velocity by calibrating one of them using this line-fitting method.
Fig. 14.
Velocity and flow. Velocity is calculated from a plot of with distance along the vessel. This plot is taken of the FV in Fig. 11. Flow is calculated by multiplying by the estimated cross-sectional area of the vessel, determined by its width.
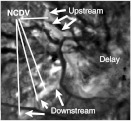
Figure 15 shows an anti-VEGF (Avastin, Bevacizumab) case that was evaluated as a responder by FA and OCT. The responding FV, CN, and DV are dark in the image because the magnitude of the signal has decreased. Their locations are visible in the image. The location of the NCDV is visible in Fig. 15(b) because it is darkened due to decreased activity in response to treatment. The upstream and downstream sections of the NCDV are identified from the fill-time image in Fig. 16. To identify it, Fig. 16 was digitally overlaid onto Fig. 15, and then the two images were toggled to see what portions coincide with the NCDV. The downstream positions have the longer delay (brighter) compared to upstream. The dispersion image (not shown) appeared virtually identical to Fig. 16. This is probably because both and are expected to increase downstream. Both the upstream and downstream sections of the NCDV are dark in Fig. 15(b), implying that decreased in response to treatment. It is surprising that the upstream portion would do so. This indicates that the flow was perturbed both upstream and downstream in response to treatment. A possible explanation is that the reduction of activity of the lesion eliminates flow pathways within it that are generally parallel to the normal vessel, which in turn increases the vascular resistance. Under such circumstances, the flow would decrease both upstream and downstream from the lesion. The formula in Table 3 shows that a decrease in could be due to a decrease in , which would reflect a decrease in blood volume, possibly resulting in decreased blood flow. Alternatively, the same formula shows that it could be due to an increase in , either due to increased mixing or decreased flow.
Fig. 15.
(a) of anti-VEGF case prior to treatment. (b) Comparison image . Field size 2 mm. The general vicinity of connection of the DV with the NCDV is denoted as C.
Fig. 16.
Revealing upstream/downstream portions of the NCDV: Fill-time image before treatment. The NCDV location is identifiable because it is darkened in Fig. 15(b). To identify it, this image was overlaid onto Fig. 15(b) and the video display was toggled between the images. Once located, we see which are the upstream or downstream portions because there is longer delay (brighter) downstream. The dispersion image appears virtually identical to this image, which could be because the mixing and thereby the dispersion will increase over the time course and thereby increase with travel downstream in the network.
3.3. Aid in Identification of Lesion Components
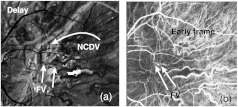
Cases occur where the lesion components cannot be identified from watching the movie. Figure 17 shows an example. The FV can be difficult to find in movies when the vessel is short, thin, and residing in a nest of other vessels. Sometimes, as is the case here, the FV and DV are overlaid, making it difficult to tell them apart and making it difficult to see the early and late fills, which are needed to identify and differentiate them. Figure 17(a) shows where the FV was found. The map made this possible by showing the FV as dark due to early filling. The identification was made by examining the dark vessels in Fig. 17(a), whose black vessels provided hints of where to look in the movie frames for an early fill. Figure 17(b) is an early frame with the FV marked. The late frames (not shown) had the DV overlaying the same space as the FV, making it difficult to find. Once the FV was found, it was possible to dead-reckon with the prototypical anatomy to find the DV and the other components. The DV was found by watching the movie for a nearby and parallel late-filling vessel. The NCDV was attached to the endpoint of the DV, had a late fill [bright in Fig. 17(a)] and ran roughly perpendicular to the DV, as expected.
Fig. 17.
An example of finding the FV. The FV could not be found without the fill-time maps (a) image. (b) Early frame. The DV location overlaps the FV location.
3.4. Progression Case
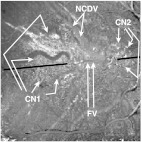
A progression case is shown in Fig. 18. This case was evaluated as a progression from static FA and OCT examination. There was no treatment between examinations. Figure 18 demonstrates the capability of the image to confirm the general location of the CN (CN1 in the figure) with a progressing lesion. It appears bright in the image because of increased perfusion between examinations.
Fig. 18.
map of a progression case, showing the increased activity in the CN and NCDV. The black line marks the position of the OCT scan shown in the next figure. The central part of the black line is removed so that it does not obscure the FV.
The FV was identified by the image (not shown) while watching the movie. The NCDV was identified by the image, by looking for a late fill, connection to the downstream end of the DV, and a perpendicular orientation with the DV and FV.
The OCT image of the baseline examination is shown in Fig. 19, corresponding to the black line in Fig. 18. The middle of the line is removed so that it does not obscure the FV. There is a neuroretinal detachment, which is a sign of lesion activity around CN1. This detachment was larger in the follow-up examination, implying increased lesion activity, which is corroborated by the bright CN1 region in Fig. 18. There is a fibrovascular lesion, whose size increased in the follow-up examination, implying increased activity, which is corroborated by the bright CN2 region in Fig. 18. CN2 is an area where a second FV and second CN were identified from the movie. Clinical evaluation of the static FA images (not shown) showed agreement with the two regions of increased activity, CN1 and CN2. Clinical evaluation of the FA images indicated that CN1 exhibits leakage and that CN2 exhibits lesion activity. These signs of leakage and activity are consistent with the identifications of general activity in both the image and the OCT images.
Fig. 19.
OCT of the baseline examination corresponding to the solid black line in Fig. 18. (1) Neuroretinal detachment in the general area of CN1. (2) Fibrovascular lesion in the general area of CN2.
4. Discussion and Conclusions
The measurements show the potential for several important purposes:
-
1.
They help identify and locate lesion components, illustrated in Fig. 2, that are otherwise difficult to identify with the traditional static FA and OCT images.
-
2.
They show the potential to help evaluate progression and response to therapy.
-
3.
They reveal flow dynamic character that cannot be seen otherwise. This will help the study of physical and physiological behavior of lesions, understanding of progression, and response to therapy.
The capability to identify components could help treatment decisions and planning. FVT and PDT require knowledge of the locations of these components, both for deciding which therapy to use and to plan the laser treatment locations. Once the FV is found, the other components become easier to find because the DV will be nearby and roughly parallel, the NCDV will be attached to the end of the DV and the CN will be near the distal end of the FV. The magnitude change map helps find the CN and NCDV when there is progression or response to treatment. This capability could be important for a progressing case since the location of these components is needed for planning treatment.
The magnitude change map could be the most revealing image for evaluating progression and response to therapy. Bright or dark regions in comparison to surrounding tissue reveal increased or decreased perfusion, respectively. Physically, these changes could be due to changes in blood volume, vessel caliber, numbers of capillaries, vascular resistance, or other vascular changes. Our testing was not exhaustive, so we could not definitively determine how well any specific measurement correlates with specific condition changes. Static FA and OCT images do not always agree with each other. The OCT may show lesion activity while the static FA does not, and vice versa. It would be beneficial to have d-ICG measurements to augment or corroborate the static FA and OCT images. The d-ICG may help the practitioner reconcile such contradictions.
The d-ICG measurements reveal several aspects of function and function changes. OCT reveals only structural changes and static FA reveals leakage.
The , and images, and their corresponding change maps [e.g., ], may help make d-ICG easier to use. Current hindrances to using d-ICG today are the extensive training and time for interpretation that the technique requires.
The measures reveal flow that can be used to study the conditions. For example, Fig. 15 showed how both the upstream and downstream portions of the NCDV can have reduced activity in tissue that responds to treatment, which leads to the possibility that the neovascularization can perturb flow in both the upstream and downstream portions of the NCDV. The suggestion that flow can alter due to pathological conditions has been suggested previously in conjunction with central retinal vein occlusion25 and is not surprising since the lesions should be expected to alter local vascular resistance.
Absolute measures of time delays and dispersion are obtainable throughout the lesion, which might be useful for characterizing and studying effects of therapies. The time delay and dispersion can identify the upstream and downstream portions of a vessel and, in doing so, the direction of flow (Fig. 16). The image of (Fig. 12) reveals laminar flow.26 Figure 14 shows a velocity measurement. Flow may be calculated by multiplying by the cross-sectional area of the blood vessel estimated according to its width. This measurement has a potential utility in many applications besides neovascular conditions. The study and possible future clinical evaluation of conditions that affect retinal or choroidal blood flow, such as CRVO, AMD and diabetic retinopathy, may benefit from this measurement. With diabetic retinopathy, early and subtle changes in vasculature and flow are precursory to the condition, so any method for monitoring early changes could have an impact on treatment.
These measures will be generally applicable to other conditions besides AMD and concomitant CNV. In further consideration of diabetic retinopathy, d-FA may be more relevant than d-ICG because it reveals retinal circulation more than choroidal circulation. Any of the measures described in this paper could be adapted for d-FA.
False color maps may help the interpretation because they show objectively where a decrease () or an increase () is being measured in , and . The quantitative accuracy will be variable, however, because of the many sources of variability, such as heart rate, patient motion, and autoregulation. Future versions of the algorithm may take these factors into account, by solving for the currently unsolved parameters, including , , , , , and .
A remarkable characteristic of the images is that they have low noise with smooth features, even though there is noise in the time plots. Noise smoothing was not used. This smoothness is produced inherently by the model of Eq. (9). This model has a finite number of parameters to solve. Fitting that model against 60 or more pixel values in the time plot results in an overdetermined mathematical solution and low-noise plots (Fig. 10) and images of , and associated with these plots.
5. Limitations and Future Work
Finite changes are recorded in nearly all locations in the change maps, even though the changes are expected only in the lesion components. This limitation could be caused by changes in , , and between examinations, all of which would happen with changes in the bolus injection, cardiac output, or autoregulation of local flow.27 This limitation will be addressed in future improvements to the algorithm that estimate , and and provide a modeling of autoregulation effects. The future model may estimate all of the terms that make up the expressions in the right column of Table 3. An absolute velocity measurement could produce an image of velocity, as described in Sec. 3.2.
Bad movie frames occur due to blinking and motion. Currently, these bad frames are addressed by manually marking them and ignoring them in the model fits. They are thereby ignored by having the set [Eq. (16)] exclude them. Future algorithms will calculate quality measures of the frame to detect the bad frames automatically. Such quality measures may include cross-correlation with an adjacent frame, which ought to have a high value when the frame is good.
The injection and movie duration are difficult to control in a clinical setting. The ideal injection should be as short and repeatable as possible, and the movie duration should last for at least 15 s and ideally, for movie quality, should be around 30 s. In a clinical setting, it is difficult to meet these requirements. The injection and movie durations vary from technician to technician, and are affected by compliance of the patient and safety precautions. It may help to make efforts to incorporate the need for short-duration injections and 15- to 35-s movies into the training of d-ICG administration.
Even though the mathematical developments leading to Eq. (9) assume a Gaussian pulse having one standard deviation , the curve fits use different standard deviations on the rising and trailing sides of the curve. The trailing side has a slower decay, probably due to additional mixing. Future model refinements may use other basis functions besides Gaussian functions as an alternative way to consider this difference. An interesting measurement would be the ratio of the trailing to rising standard deviations, which would provide additional physiological interpretation about mixing and thereby flow and perfusion.
There are other potential applications besides ophthalmic imaging. There is the potential to apply the technology to surgical applications, including many types of surgery3 where it is advantageous to evaluate the perfusion of tissue flaps and other transplants. There is the potential to apply the technology to tissue-engineering research with animal models, and eventually to clinical application of tissue engineering, where there are needs to evaluate the vascularization and perfusion of transplanted engineered tissue constructs over time.28
Acknowledgments
This work was supported by the National Eye Institute (NIH Grant R43EY08970), the U.S. Air Force (Contract F083-029-0181), and Lickenbrock Technologies independent research and development funds.
Appendix: Coregistration to Compensate for Motion
This appendix describes the approach to motion compensation, where adjacent images in the time series are coregistered automatically. Aspects of this algorithm have been described previously.19,20 The algorithm that corrects for this problem compensates for the geometric distortion as well. The geometric distortion happens because the eye moves substantially in the th-s duration of a single frame raster scan. A base image frame in the center of the image stack serves as the reference frame. The adjacent image is aligned for a rigid translation by calculating the cross correlation between the two frames according to
| (17) |
where is the rigid translation that is solved and indexes the time point of the base image to which the shifted image is co-registered. Equation (17) is solved for the value of that produces the maximum value of . This value becomes the solved shift. The -th image is then compensated by moving the values in every pixel, spatially, by . Geometric distortion is compensated by repeating this cross-correlation and shifting operation recursively. The image is divided into subsections. The alignment is repeated with each of these subsections. To eliminate any artifacts caused by discontinuities between the subsections, the value of is not constant across the image. Instead, it is interpolated from the center of one subsection to the center of the other. After a subsection is aligned, the image is divided into a subsection, and then an subsection, each time repeating the process of cross-correlation and shifting.
References
- 1.Khandpur R. S., Biomedical Instrumentation Technology and Applications, McGraw-Hill, New Delhi: (2005). [Google Scholar]
- 2.Desmettre T., Devoisselle J. M., Mordon S., “Fluorescence properties and metabolic features of indocyanine green (ICG) as related to angiography,” Surv. Ophthalmol. 45(1), 15–27 (2000). 10.1016/S0039-6257(00)00123-5 [DOI] [PubMed] [Google Scholar]
- 3.Still J., et al. , “Evaluation of the circulation of reconstructive flaps using laser-induced fluorescence of indocyanine green,” Ann. Plast. Surg. 42(3), 266–274 (1999). [DOI] [PubMed] [Google Scholar]
- 4.Domalpally A., Danis R. P., “Fluorescein angiography in neovascular AMD,” Rev. Ophthalmol. (Aug. 2008). [Google Scholar]
- 5.Giani A., et al. , “Spectral-domain optical coherence as an indicator of fluorescein angiography leakage from choroidal neovascularization,” IOVS 52(8), 5579–5586 (2011). 10.1167/iovs.10-6617 [DOI] [PubMed] [Google Scholar]
- 6.Windisch R., Windisch B. K., Cruess A. F., “Use of fluorescein and indocyanine green angiography in polypoidal choroidal vasculopathy patients following photodynamic therapy,” Can. J. Ophthalmol. 43(6), 678–682 (2008). 10.3129/I08-153 [DOI] [PubMed] [Google Scholar]
- 7.Freeman W., et al. , “Simultaneous indocyanine green and fluorescein angiography using a confocal scanning laser ophthalmoscope,” Arch Ophthalmol. 116(4), 455–463 (1998). [DOI] [PubMed] [Google Scholar]
- 8.Destro M., Puliafito C. A., “Indocyanine green videoangiography of choroidal neovascularization,” Ophthalmol. 96(6), 846–853 (1989). [DOI] [PubMed] [Google Scholar]
- 9.Staurenghi G., et al. , “Anatomic and flow characteristics of feeder vessels in choroidal neovascular membranes,” in Invest. Ophthalmol. Vis. Sci. Vol. 43, E-Abstract 2512, ARVO, Fort Lauderdale, Florida: (2002). [Google Scholar]
- 10.Flower R., “Optimizing treatment of choroidal neovascularization feeder vessels associated with age-related macular degeneration,” Am. J. Ophthalmol. 134(2), 228–239 (2002). 10.1016/S0002-9394(02)01579-9 [DOI] [PubMed] [Google Scholar]
- 11.Staurenghi G., et al. , “Laser treatment of feeder vessels in subfoveal choroidal neovascular membranes: a revisitation using dynamic indocyanine green angiography,” Ophthalmol. 105(12), 2297–2305 (1998). 10.1016/S0161-6420(98)91232-5 [DOI] [PubMed] [Google Scholar]
- 12.Kohner E. M., Dollery C. T., “Fluorescein angiography of the fundus in diabetic retinopathy,” B. Med. Bull. 26(2), 166–170 (1970). [DOI] [PubMed] [Google Scholar]
- 13.Wang Y., et al. , “Pilot study of optical coherence tomography measurement of retinal blood flow in retinal and optic nerve diseases,” Invest. Ophthalmol. Vis. Sci. 52(2), 840–845 (2011). 10.1167/iovs.10-5985 [DOI] [PMC free article] [PubMed] [Google Scholar]
- 14.Chakravarthy U., et al. , “Evolving European guidance on the medical management of neovascular age-related macular degeneration,” Br. J. Ophthalmol. 90(9), 1188–1196 (2006). 10.1136/bjo.2005.082255 [DOI] [PMC free article] [PubMed] [Google Scholar]
- 15.Brown D., et al. , “Ranibizumab versus Verteporfin for neovascular age-related macular degeneration,” NE J. Med. 355(14), 1432–1444 (2006). 10.1056/NEJMoa062655 [DOI] [PubMed] [Google Scholar]
- 16.Rosina C., Bottoni F., Staurenghi G., “Clinical experience with pegaptanib sodium,” Clin. Ophthalmol. 2(3), 485–488 (2008). [DOI] [PMC free article] [PubMed] [Google Scholar]
- 17.Jähne B., Practical Handbook of Image Processing for Scientific and Technical Applications, CRC Press, Boca Raton, Florida: (2005). [Google Scholar]
- 18.Roberts P. J. W., Webster D. R., “Turbulent diffusion,” in Environmental Fluid Mechanics: Theories and Applications, Shen Hayley H., Ed., American Society of Civil Engineers, New York: (2002). [Google Scholar]
- 19.Larkin S., et al. , “Perfusion measures for dynamic ICG scanning laser ophthalmoscopy,” Proc. SPIE 7550, 75500H (2010). 10.1117/12.839534 [DOI] [Google Scholar]
- 20.O’Connor N., et al. , “Fluorescent infrared scanning laser ophthalmoscope 3D visualization: automatic random eye motion correction and deconvolution,” Appl. Opt. 37(11), 2021–2033 (1998). 10.1364/AO.37.002021 [DOI] [PubMed] [Google Scholar]
- 21.Csiszár I., “I-divergence geometry of probability distributions and minimization problems, the annals of probability,” Ann. Probab. 3(1), 145–158 (1975). [Google Scholar]
- 22.O’Sullivan J. A., Benac J., “Alternating minimization algorithms for transmission tomography,” IEEE Trans. Med. Imag. 26(3), 283–297 (2007). 10.1109/TMI.2006.886806 [DOI] [PubMed] [Google Scholar]
- 23.Press W., et al. , Numerical Recipes in C–The Art of Scientific Computing, Cambridge University Press, Cambridge, United Kingdom: (1990). [Google Scholar]
- 24.Gill P., Murray W., Wright M., Practical Optimization, Academic Press, London: (1981). [Google Scholar]
- 25.Paques M., et al. , “Analysis of retinal and choroidal circulation during central retinal vein occlusion using indocyanine green videoangiography,” Arch. Ophthalmol. 119(12), 1781–1787 (2001). [DOI] [PubMed] [Google Scholar]
- 26.Zhong Z., et al. , “In vivo measurements of erythrocyte velocity and retinal blood flow using adaptive optics scanning laser ophthalmoscopy,” Opt. Express 16(17), 12746–12756 (2008). 10.1364/OE.16.012746 [DOI] [PMC free article] [PubMed] [Google Scholar]
- 27.Polska E., et al. , “Regulation of choroidal blood flow during combined changes in intraocular pressure and arterial blood pressure,” Invest. Ophthalmol. Vis. Sci. 48(8), 3768–3774 (2007). 10.1167/iovs.07-0307 [DOI] [PubMed] [Google Scholar]
- 28.Francis-Sedlak M., et al. , “Collagen glycation alters neovascularization in vitro and in vivo,” Microvas. Res. 80(1), 3–9 (2010). 10.1016/j.mvr.2009.12.005 [DOI] [PubMed] [Google Scholar]


