

Abstract
This study evaluated the oxidative stress through enzymatic and nonenzymatic biomarkers in diabetic patients with and without hypertension and prediabetics. The SOD and CAT (in erythrocytes) and GPx (in plasma) enzymatic activities, plasma levels of lipid peroxidation, and total thiols were measured in the blood of 55 subjects with type 2 diabetes and 38 subjects without diabetes (9 pre-diabetics and 29 controls) aged 40–86 years. The total SOD activity and the lipid peroxidation were higher in diabetics compared to nondiabetics. In stratified groups, the total SOD activity was different for the hypertensive diabetics compared to the prediabetics and normotensive controls. Lipid peroxidation was significantly higher in both groups of diabetics (hypertensive and normotensive) compared to prediabetic groups and hypertensive and normotensive controls. There was no significant difference in the CAT and GPx activities, as well as in the concentration of total thiols in the groups studied. Present data strongly suggest the involvement of oxidative stress in the pathophysiology of diabetes, revealing that the increased lipid peroxidation has a close relationship with high glucose levels, as observed by the fasting glucose and HbA1c levels. The results evidence the correlation between lipid peroxidation and DM, irrespective of the presence of hypertension.
1. Introduction
Diabetes mellitus (DM) is one of the most common noncommunicable diseases worldwide, with over 80% of its carriers living in low- and middle-income countries [1]. It is estimated that in 2030, for every 10 adults, one will present with diabetes, with the largest increases occurring at developing countries. In high-income countries, for example, type 2 diabetes mellitus (DM2) tends to be more prevalent in low-income population, and even in low-income countries, DM2 is more frequent in poorer sections of the society, especially in urban areas [2]. In these situations, there is a frequency of chronic complications arising from macrovascular and microvascular changes [3], such as cardiovascular and renal dysfunction, progressive blindness, amputation of limbs, loss of functionality, and decreased quality of life of affected individuals [4], resulting in a high socioeconomic impact [3].
Approximately 30–60% of diabetics have systemic arterial hypertension (SAH), which shows the close relationship between such diseases [5]. SAH, in turn, substantially contributes to morbimortality in patients with diabetes [6], with oxidative stress (OS) configuring an important mechanism in the pathophysiology of DM [7] and SAH [8, 9]. In DM, OS acts as a mediator of insulin resistance (IR), and its progression to glucose intolerance and installation of DM, subsequently favoring the appearance of atherosclerotic complications [7], possibly contributes to the rise of several micro- and macrovascular complications associated with diabetes [10, 11].
In conditions of severe OS, cell damage may occur with decreased pancreatic beta-cell function, which, due to the low expression of antioxidant enzymes, is particularly sensitive to reactive oxygen and nitrogen species (RONS) [12]. These molecules may act on different substrates in the insulin intracellular signaling cascade, causing cell damage [13].
In this scenario, the energy substrate overload to the cells, mainly from the higher glucose levels, increases the flow of electron donors (NADH and FADH2) to the mitochondrial electron transport chain. As a result of such process, the voltage gradient across the mitochondrial membrane reaches a critical threshold, blocking the complex III and causing an electron return to the coenzyme Q, which donates electrons to molecular oxygen, ultimately generating superoxide anion (•O2 −) [14]. This process is probably the common event for all the classic routes for DM2 complications (increased flux in the polyol and hexosamine pathways; increased formation of advanced glycation end products; activation of protein kinase C-PKC), with the hyperglycemia being described as the probable biochemical key involved in the induction of such pathways [15]. For Monnier and Colette [16], both the activation of the OS and the excessive glycation of proteins caused by hyperglycemia appear as important components in the emergence of diabetic complications, and the pathophysiology of diabetes could be considered as a result of these two deleterious metabolic alterations which are activated by three main glucose disturbances: fasting hyperglycemia, postprandial hyperglycemia, and acute glucose fluctuations.
Thus, considering the still to be determined mechanisms involved in the binomial DM-OS, this study aimed to evaluate OS through enzymatic and nonenzymatic biomarkers in DM2 patients with and without SAH and in prediabetic condition (pre-DM), in a specific population of Northeastern Brazil, and to investigate the relationship of OS parameters with anthropometric, biochemical, clinical, and socioeconomic profiles of these patients. This is the first detailed study of diabetes and OS in a population presenting typical socioeconomical features observed in developing countries, in which this disease has been increasing.
2. Material and Methods
2.1. Design of the Study and Participants
DM2 carriers were selected among patients admitted to the Municipal Integrated Center for Diabetes and Hypertension (ICDH) of Barbalha, a city located in the south of the state of Ceará, in Northeastern Brazil. Barbalha has 54,806 inhabitants spread over an area of 479.82 km² [17]. Criteria for inclusion/exclusion of patients were as follows: included patients were nonsmokers, nonpregnant, and nonlactating women, patients without excessive alcohol consumption, those aged above 18, and all without secondary diabetes. Excessive alcohol consumption was defined when the alcoholic intake exceeded the estimated volume for moderate use of alcohol, considering the limits of three daily doses for men and two for women, or five doses for occasion, at least once a week. The considered standard doses for alcoholic drink were 350 mL for beer, 150 mL for wine, or 50 mL for distilled drink, according to data from the Center for Information on Health and Alcohol (Centro de Informações Sobre Saúde e Álcool, CISA, 2011) [18]. Patients with mental health problems (senile dementia and Alzheimer's disease, among others) were also excluded, as they configure vulnerable groups, beyond the scope of this study. The control group was selected among the participants in the group of elderly from the Reference Center for Social Assistance (Centro de Referência de Assistência Social, CRAS), situated in Barbalha.
The sample was determined nonprobabilistically, initially including all patients followed in the aforementioned reference centers as potential participants. After considering inclusion and exclusion criteria, as well as losses during the selection process, a total of 93 patients were enrolled as participants, being 55 in the case group and 38 as controls (9 of whom were prediabetics). The steps starting from the sampling universe until the final groups are illustrated in Figure 1. We collected information on lifestyle habits (smoking and drinking), use of medications, comorbidities, time course of DM2, age, ethnicity/race, education, income, and personal and family history of the disease. Anthropometric data (waist circumference, height, and weight) and arterial pressure measurement were obtained before blood collection. Patients with no history of alcohol abuse [18] and nonpregnant or breastfeeding women were allocated in the study. The frequency of metabolic syndrome (MS) was assessed according to the criteria of the National Cholesterol Education Program's Adult Treatment Panel III [19]. The group of diabetics had 55 participants, of whom 45 had SAH and 10 were normotensive. The control group consisted of 29 nondiabetic individuals (17 hypertensive and 12 normotensive) from the same city, with sex and age ratios similar to patients with DM2 (Figure 1).
Figure 1.
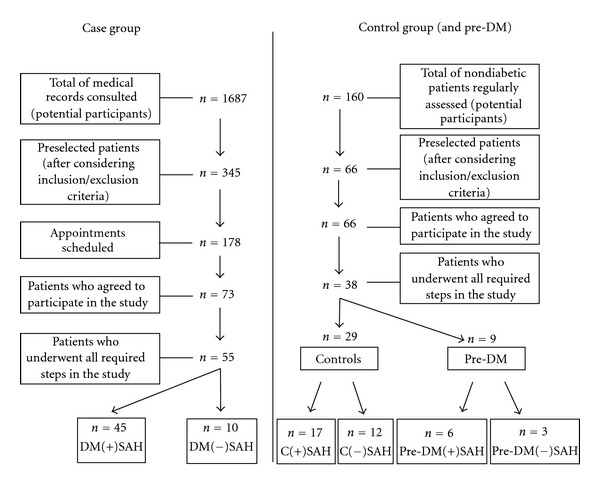
Schematic sequence of steps followed during the patients' selection process. C(+)SAH: hypertensive controls; C(−)SAH: normotensive controls; DM(+)SAH:hypertensive diabetics; DM(−)SAH: normotensive diabetics; Pre-DM: prediabetics; Pre-DM(+)SAH: hypertensive prediabetics; pre-DM(−)SAH: normotensive prediabetics.
In the hypertensive subgroups, those with an established diagnosis of SAH in both the DM2 and the control groups were included. The screening of the last group revealed 9 subjects with fasting glycemia between ≥5.6 and <7.0 mmol/L−1 [20] which configured a third group, the pre-DM. In this group, six patients were under treatment with antihypertensive drugs (Figure 1).
2.2. Blood Collection and Biochemical Analysis
Blood was collected after 12 to 14h fasting (overnight). The biochemical profile was determined by standard laboratory methods, immediately after collection. For measurement of superoxide dismutase (SOD-EC 1.15.1.1), catalase (CAT-EC 1.11.1.6) and glutathione peroxidase (GPx-EC 1.11.1.9) activities, total thiols (SH), and lipid peroxidation (LPO, through thiobarbituric acid reactive substances (TBARS)), samples were kept cooled until the completion of blood collection and then centrifuged at 4000 rpm, at 4°C for 5 minutes. The products of centrifugation (serum, plasma, and erythrocytes) were stored at −80°C, and the analysis was performed between 1 and 4 months after collection.
The concentrations of OS markers were determined by spectrophotometric methods. GPx activity in plasma samples was evaluated according to the protocol described by Wendel [21]. The activities of SOD and CAT were measured in erythrocytes. For SOD activity, a commercial kit from Fluka was used, following the manufacturer's instructions. CAT activity was determined by the decay rate of a reaction containing phosphate buffer and hydrogen peroxide (H2O2), according to Xu et al. [22], with appropriate adjustments for erythrocyte lysates. The absorbances were read in a microplate reader (Multiskan GO Microplate Spectrophotometer, Thermo Scientific). The values for both enzymes were normalized by the concentration of hemoglobin (Hb) and expressed in U·Hb−1, mmol·L−1.
The measurement of thiol groups (SH) and LPO (TBARS) was carried out in plasma, by the methods described by Ellman [23] and Wallin et al. [24], respectively. IR was estimated using the mathematical homeostasis model assessment (HOMA-IR), calculated by the formula (FI × FG)/22.5, where FI is the fasting insulinemia, in mUI·mL−1, and FG is the fasting glycemia, in mmol·L−1 [25].
2.3. Statistical Analysis
Inferential statistical techniques were used by means of the following tests: Pearson's chi-square test or Fisher exact, when the conditions for using the chi-square test were not observed. Groups were unequal as individuals were selected based on the inclusion/exclusion criteria described above. One-way ANOVA was applied in order to examine the differences in the variables TBARS, SOD, CAT, GPx, SOD/CAT, SH, uric acid, CER, and TRF among groups. Tukey's multiple comparison was used in case of significant difference. For the correlation analysis it was used the Spearman correlation coefficient, and for statistical significance, a margin of error of 5% was adopted. Data were analyzed using the software SPSS (Statistical Package for Social Sciences), version 17.
2.4. Ethics
This study was approved by the Ethics Committee at the Faculty of Medicine of North Juazeiro (Juazeiro do Norte, Ceará, Brazil) (Protocol no. 180/2008), in accordance with the principles described in the Declaration of Helsinki. All participants signed a consent form prior to the application of the research protocols.
3. Results
The subjects of this study consisted of 93 individuals, aged 40–86 years, with 55 DM2 patients, 9 pre-DM, and 29 controls, with similar ages and a female predominance. The average time from diagnosis of diabetes was 11.6 ± 7.8 years. Table 1 presents the characterization of the study sample, according to socioeconomic, clinical, biochemical, and anthropometric profiles. Taken together, the body of data reveals homogeneity between the groups in terms of ethnicity, lipid profile, and anthropometric measurements.
Table 1.
Distribution of the groups studied according to socioeconomic, clinical, biochemical, and anthropometric profiles.
| Variable | Groups | |||
|---|---|---|---|---|
| DM2 (n = 55) | Pre-DM (n = 9) | Control (n = 29) | P value | |
| Socioeconomic profile | ||||
| Agea, years (X ± SEM) | 65.2 ± 1.5 | 73.4 ± 1.7 | 66.2 ± 1.9 | NS |
| Sexb, M/F (%) | 29.1/70.9 | 33.3/66.7 | 20.7/79.3 | NS |
| Ethnicity/colorc, W/BL/BR (%) | 18.2/20/61.8 | 0/0/100 | 6.9/17.2/75.9 | NS |
| Educationc,d, 0/1-4/5+ (%) | 32.7/34.5/32.7 | 77.8/22.2/0 | 84.6/11.5/3.8 | <0.001*** |
| Incomec,e, ≤1/>1 (%) | 56.4/43.6 | 44.4/55.6 | 26.9/73.1 | 0.04* |
|
| ||||
| Lifestyle profile | ||||
| Tobacco usec, ES/NS (%) | 42.6/57.4 | 75/25 | 69/31 | 0.035* |
| Drinking, N/Y (%)# | 98.2/1.8 | 77.8/22.2 | 73.1/26.9 | — |
|
| ||||
| Clinical profile | ||||
| CVDfamilyb, Y/N (%) | 90.9/9.1 | 55.6/44.4 | 41.4/58.6 | <0.001*** |
| DMfamilyc, Y/N (%) | 63.6/36.4 | 33.3/66.7 | 20.7/79.3 | <0.001*** |
| SAHfamilyc, Y/N (%) | 78.2/21.8 | 44.4/55.6 | 34.5/65.5 | <0.001*** |
| SBP (mmHg)a (X ± SEM) | 137.4 ± 2.1 | 140.0 ± 8.1 | 134.5 ± 3.9 | NS |
| DBP(mmHg)a (X ± SEM) | 82.5 ± 0.9 | 83.3 ± 3.3 | 82.4 ± 1.6 | NS |
| MSb, Y/N (%) | 81.8/18.2 | 55.6/44.4 | 48.3/51.7 | 0.005** |
|
| ||||
| Biochemical profile | ||||
| FG (mmol·L−1)a (X ± SEM) | 7.7 ± 0.5(A) | 5.9 ± 0.1(B) | 4.3 ± 0.1 | <0.001*** |
| HbA1c (%)a | 8.0 ± 0.3(A) | 5.9 ± 0.1 | 6.0 ± 0.2 | <0.001*** |
| HOMA-IR (μU·L−1·mmol−1·L−1)a (X ± SEM) | 8.0 ± 1.7(A) | 2.8 ± 0.5 | 1.8 ± 0.3 | 0.019* |
| TC (mmol·L−1)a (X ± SEM) | 5.5 ± 0.1 | 5.9 ± 0.3 | 5.2 ± 0.3 | NS |
| HDL (mmol·L−1)a (X ± SEM) | 1.2 ± 0.03 | 1.3 ± 0.05 | 1.1 ± 0.04 | NS |
| LDL (mmol·L−1)a (X ± SEM) | 3.2 ± 0.14 | 3.6 ± 0.33 | 3.2 ± 0.24 | NS |
| VLDL (mmol·L−1)a (X ± SEM) | 1.1 ± 0.1 | 1.01 ± 0.14 | 0.8 ± 0.07 | NS |
| TG (mmol·L−1)a (X ± SEM) | 2.5 ± 0.23 | 2.2 ± 0.3 | 1.8 ± 0.15 | NS |
|
| ||||
| Anthropometric profile | ||||
| BMI (kg·m−²)a (X ± SEM) | 29.4 ± 0.8 | 27.0 ± 0.9 | 27.3 ± 0.8 | NS |
| WC (cm)a (X ± SEM) | 102.8 ± 1.7 | 95.1 ± 2.6 | 95.6 ± 2.0 | NS |
aANOVA, Tukey; bPearson's test χ 2; cFisher exact test; din years of study; ein minimum salary; NS: not significant; (A)when compared to pre-DM groups and the control; (B)when compared to the control.
The frequency of MS was higher in diabetic patients (81.8%), followed by pre-DM (55.6%) and then the control subjects (48.3%). Family history revealed a high percentage of diabetics presenting a relative with DM and/or SAH. The groups did not differ in terms of average systolic and diastolic blood pressures (Table 1).
As expected, biochemical evaluation revealed a higher fasting glycemia in diabetics, compared to pre-DM and the controls, and in the pre-DM, when compared to the controls (7.7 ± 0.5 mmol·L−1; 5.9 ± 0.1 mmol·L−1; 4.3 ± 0.1 mmol·L−1, resp., P < 0.001) (Table 1). Also, glycated hemoglobin (HbA1c) was higher in diabetics compared to pre-DM and the controls, with significant differences only between the first two (DM2: 8.0 ± 0.3%; pre-DM: 5.9 ± 0.1%; control: 6.0 ± 0.2%, P < 0.001) (Table 1). As for HOMA-IR, the diabetics presented the highest average of the three groups (DM2: 8.0 ± 1.7; pre-DM: 2.8 ± 0.5; control: 1.8 ± 0.3, P = 0.019), with no significant difference between pre-DM and controls.
The assessment of body mass index (BMI) showed no difference between the groups. However, considering the cutoff (underweight, normal, overweight, and obesity), the three groups showed a higher frequency in the range of overweight (DM2: 36.4%; pre-DM: 55.6% C: 44.8%), noting that 40% of diabetic patients show a BMI above 30 kg·m2,−1 (data not shown). In stratified groups, BMI of diabetic patients with SAH (DM(+)SAH) was higher compared to diabetics and the controls without SAH (DM(−)SAH and C(−)SAH, resp.) (DM(+)SAH: 30.1 ± 5.8 kg·m2,−1; DM(−)SAH: 26.1 ± 4.1 kg·m2,−1; C(−)SAH: 26.4 ± 3.5 kg·m2,−1, P = 0.043). Regarding the analysis of waist circumference (WC), higher values were found in DM(+)SAH in relation to the C(−)SAH (DM2(+)SAH: 104.2 ± 12.2 cm; C(−)SAH: 92.4 ± 8.7 cm, P = 0.007), while the frequency of increased WC was found in 74.5% of diabetics, 66.7% of pre-DM, and 62.1% of controls (data not shown).
Figure 2 shows the results of transport proteins transferrin (TRF) and ceruloplasmin (CER), and the uric acid and total thiols (SH) levels, with higher TRF levels in DM2 and pre-DM compared to the control group (DM2: 2.5 ± 0.1; pre-DM: 2.5 ± 0.1; controls: 2.0 ± 0.1, g·L−1, P < 0.001 (Figure 2(g)). However, there were no significant differences in uric acid and SH levels (Figures 2(d) and 2(a)) between DM2, pre-DM, and the control groups. After stratification, the DM2(+)SAH group showed a higher concentration of TRF than the C(+)SAH group (DM2(+)SAH: 2.5 ± 0.1 g·L−1; C(+)SAH: 2.0 ± 0.1 g·L−1), with no difference between the other groups (Figure 2(h)). The CER showed a significant difference only between DM2(+)SAH and DM2(−)SAH (DM2(+)SAH: 373.0 ± 11.2 μmol·L−1; DM2(−)SAH: 305.0 ± 10.0 μmol·L−1, P = 0.019) (Figure 2(k)).
Figure 2.

Nonenzymatic antioxidants and transport proteins. (a), (b), and (c) Total thiols; (d), (e), and (f) uric acid; (e) *pre-DM versus C(+)SAH; (f) *DM2(−)LPO versus C(+)SAH; (g) TRF *DM2 and pre-DM versus C; (h) TRF in stratified groups, *DM2(+)SAH versus C(+)SAH and C(−)SAH; (i) TRF *DM2(−)LPO versus C(+)SAH and C(−)SAH, **DM2LPO versus C(+)SAH; (j), (k), and (l) CER; (k) *DM2(+)SAH versus DM2(−)SAH. Values are presented as mean ± SEM. ANOVA, followed by Tukey's multiple comparison test. *P < 0.05; **P < 0.01.
When assessing the antioxidant enzymes, only SOD activity presented significant variations among the groups (Figure 3). Diabetic patients had increased SOD activity compared to pre-DM and the controls (DM2: 1.6 ± 0.3; pre-DM: 1.3 ± 0.1; control: 1.4 ± 0.1, U·Hb−1, mg·dL−1 P < 0.001, Figure 3(a)). The LPO was significantly higher in diabetics than in the pre-DM and control groups, with no difference between the last two (DM2: 19.8 ± 1.4; pre-DM: 9.5 ± 0.5; control: 8.6 ± 0.4, μmol·Ptn−1, mg·dL−1, P < 0.001), as shown in Figure 4(a). This observation in the stratified subgroups showed that differences in SOD activity were detected only comparing DM2(+)SAH to the pre-DM and the C(−)SAH groups (DM2(+)SAH: 1.6 ± 0.3; pre-DM: 1.3 ± 0.1; C(+)SAH: 1.3 ± 0.1 U·Hb−1, mg·dL−1, P = 0.001) (Figure 3(b)). The LPO levels of the two diabetic groups were significantly higher than levels of the pre-DM, C(+)SAH, and C(−)SAH groups (DM2(+)SAH: 18.7 ± 1.4; DM2(−)SAH: 24.6 ± 4.2; pre-DM: 9.5 ± 0.5; C(+)SAH: 8.0 ± 0.5; C(−)SAH: 9.2 ± 0.8 μmol·Ptn−1, mg·dL−1, P < 0.001, Figure 4(b)). To better understand the significance of these differences in LPO values among the different types of diabetic, prediabetic, and control individuals, DM2 carriers LPO levels were individually assessed (Figure 4(c)). This individual analysis evidenced two distinct subgroups of DM2 carriers with different LPO profiles. From the 55 patients of the DM2 group, 25 presented high LPO levels, with TBARS concentrations above 17.8 μmol·Ptn−1, mg·dL−1 (DM2LPO), and 29 subjects had TBARS concentration at lower levels than this limit (DM2(−)LPO) (altogether, the groups do not total 55 due to the lack of available samples for measuring lipid peroxidation in one patient). Stratification of diabetic patients into DM2LPO and DM2(−)LPO subgroups revealed further significant variations, as DM2 patients exhibiting higher LPO levels had also presented increased FG and HbA1c levels (Figures 4(e) and 4(f)). Moreover, average LPO levels in DM2(−)LPO group were not different from the other groups, but the DM2LPO group had significantly higher values. In the DM2LPO group, total SOD activity was shown to be significantly higher than in pre-DM, C(+)SAH, and C(−)SAH (Figure 3(c)). Furthermore, the DM2(−)LPO patients had higher total SOD activity compared to the C(+)SAH group. When analyzing the SOD/CAT ratio, it was observed greater ratio values between DM2 versus controls, DM2(−)SAH versus C(+)SAH, and DM2LPO versus C(+)SAH (Figures 3(j), 3(k), and 3(l)). The SOD/GPx ratio did not differ among groups (data not shown). No significant difference was observed neither for CAT and GPx activities (Figures 3(f) and 3(i), resp.), nor for the SH concentrations (Figure 2(c)) and CER (Figure 2(l)). Uric acid concentration was shown to be higher in the DM2(−)LPO group versus C(+)SAH (Figure 2(f)), and TRF concentration to be higher in the DM2LPO group versus C(+)SAH, and in the DM2(−)LPO group versus C(+)SAH, and C(−)SAH (Figure 2(i)).
Figure 3.

SOD, CAT, and GPX activities. (a) Total erythrocyte SOD in diabetic patients, pre-DM and controls; *DM2 versus pre-DM, and C; (b) total erythrocyte SOD activity, *DM2(+)SAH versus pre-DM and C(+)SAH; (c) total erythrocyte SOD activity, *DM2(−)LPO versus C(+)SAH; **DM2LPO versus pre-DM, C(+)SAH and C(−)SAH; (d), (e), and (f) erythrocyte CAT activity; (g), (h), and (i) extracellular GPx activity in plasma. (j) SOD/CAT ratio, *DM2 versus C, (k) SOD/CAT ratio, *DM2(−)SAH versus C(+)SAH, and (l) SOD/CAT ratio, *DM2LPO versus C(+)SAH. Values are presented as mean ± SEM. ANOVA, followed by Tukey's multiple comparison test. *P < 0.05; **P < 0.01.
Figure 4.

Lipid peroxidation, TBARS, fasting glucose, and HbA1c according to the studied groups. (a) TBARS concentration in DM2, pre-DM, and controls, *versus pre-DM groups and C; (b) TBARS concentration in stratified groups, *versus pre-DM, C(+)SAH, and C(−)SAH; (c) individual assessment for LPO in the stratified groups; (d) TBARS concentration according to the cutoff points in DM2 patients, *DM2LPO versus DM2(−)LPO, pre-DM, C(+)SAH, and C(−)SAH; (e) fasting glucose, *DM2LPO versus DM2(−)LPO, pre-DM, C(+)SAH, and C(−)SAH; (f) HbA1c *DM2LPO versus DM2(−)LPO, pre-DM, C(+)SAH, and C(−)SAH. Values are presented as mean ± SEM. ANOVA, followed by Tukey's multiple comparison test. *P < 0.05.
For the correlation analysis observed between biochemical parameters and the OS (Figure 5), it was shown a positive correlation between the variables LPO versus FG (Figure 5(a)) among diabetic patients. Such correlation was stronger for glucose levels above 5.6 mmol·L−1 (Figure 5(b)). It was also observed a positive correlation between HbA1c and LPO (Figure 5(d)), but when we assessed the cutoff points above and below 6.5%, it was observed that the correlation was kept only for the levels above 6.5% (Figure 5(e)). Another positive correlation was identified between the HOMA-IR and LPO (Figure 5(g)), the same not being observed for the fasting insulin levels (Figure 5(h)).
Figure 5.
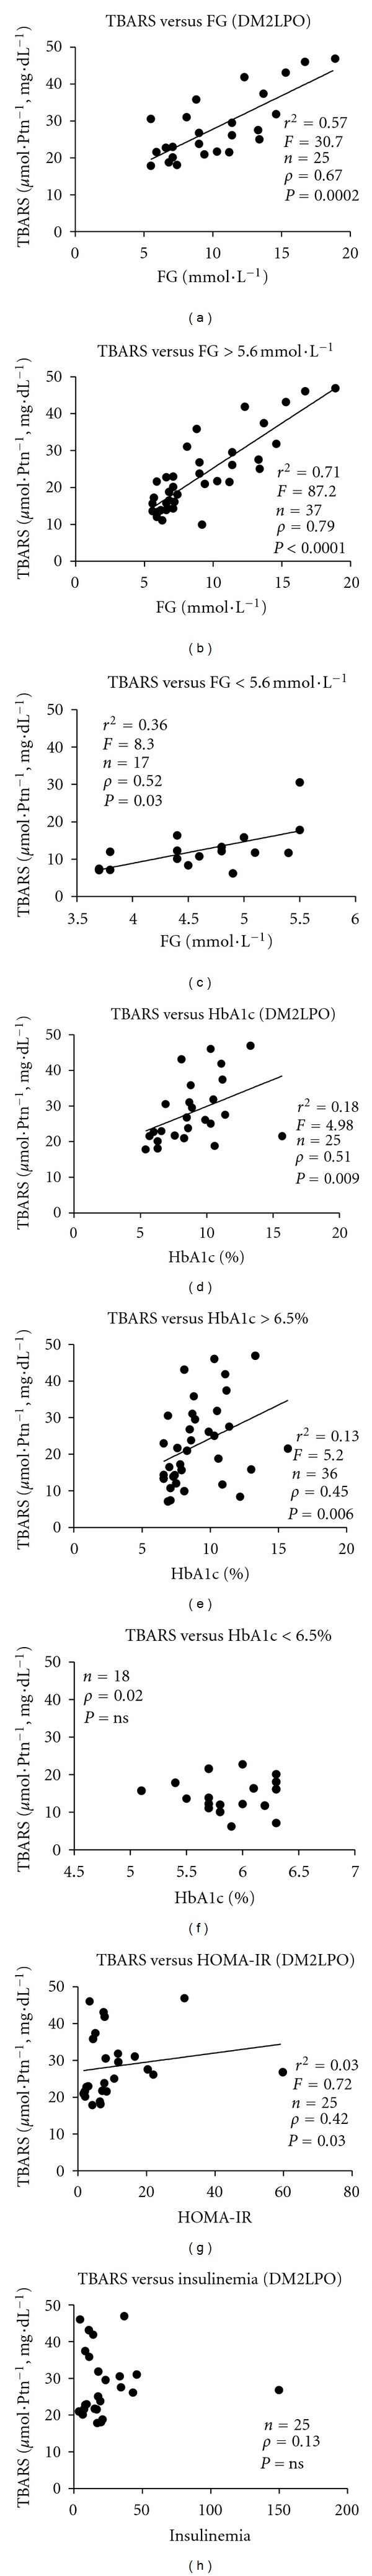
Correlation coefficients (Spearman's correlation) and linear regression in DM2 patients among fasting glucose, HbA1c, and LPO (TBARS). (a) TBARS versus fasting glucose in the DM2LPO group; (b) TBARS versus fasting glucose in DM2 patients, when considering values above 5.6 mmol·L−1 and (c) below 5.6 mmol·L−1; (d) TBARS versus HbA1c in the DM2LPO group; (e) TBARS versus HbA1c in DM2 patients, according to the cutoff point above 6.5% and (f) below 6.5%; (g) TBARS versus HOMA-IR in the DM2LPO group; (h) TBARS versus insulinemia in the DM2LPO group. Values were considered statistically significant when P < 0.05.
Analysis of the pharmaceuticals used by the subjects of this study showed that 76.4% of diabetics, 66.7% of the pre-DM, and 37.9% of the controls were using antihypertensive drugs, with angiotensin-converting enzyme inhibitors (ACEI) (captopril and enalapril) being the most used class by the three groups. Among the diabetics evaluated, 51 (92.7%) were using oral antidiabetic drugs (sulphonylurea and/or biguanide). Furthermore, 32.7% of the diabetics and 10.3% of the controls were using acetylsalicylic acid (ASA), as shown in Table 2.
Table 2.
Pharmaceuticals used by participants in the groups studied.
| Pharmaceutical | Patients under medication use (%) | ||
|---|---|---|---|
| DM2 | Pre-DM | Control | |
| Diuretic (thiazide/potassium sparing) | 16/55 (29.1%) | 2/9 (22.2%) | 3/29 (10.3%) |
| Adrenergic antagonist (beta blockers and centrally acting) | 5/55 (9.1%) | 2/9 (22.2%) | 2/29 (6.9%) |
| ACEI (captopril/enalapril) | 27/55 (49.1%) | 4/9 (44.4%) | 8/29 (27.6%) |
| ARB AT1 (Losartan) | 10/55 (18.2%) | — | — |
| Calcium channel blockers (nifedipine/amlodipine) | 9/55 (16.4%) | 1/9 (1.1%) | — |
| OAD—sulphonylurea (glibenclamide/gliclazide) | 40/55 (72.7%) | — | — |
| OAD—biguanide (metformin) | 42/55 (76.4%) | — | — |
| Statins | 6/55 (10.9%) | — | 2/29 (6.9%) |
| Insulin | 15/55 (27.3%) | — | — |
| ASA | 18/55 (32.7%) | — | 3/29 (10.3%) |
Values are expressed in absolute numbers and percentages. The relative values do not total 100% because there are patients who underwent combined therapies. ACEI: angiotensin-converting enzyme inhibitor; ARB AT1: AT1 angiotensin receptor antagonist; OAD: oral antidiabetic; ASA: acetylsalicylic acid.
4. Discussion
In the present study, besides the higher LPO in DM2 patients, SOD activity was shown to be increased in such individuals. Some studies in patients with DM2 have revealed a decrease in antioxidant defenses and an increase in oxidative damage markers, especially against complications associated with DM2 [26–28]. However, similar results to ours were found by Moussa [29], who observed that SOD, in erythrocytes, showed the highest activity in type 1 and type 2 diabetics and an increase in LPO, assessed by MDA quantification, suggesting an augmented production of RONS in such patients. Savu et al. [30] also found high total antioxidant capacity and higher concentration of TBARS, in patients with DM2. In this direction, Kimura et al. [31] found elevated concentrations of a variant of extracellular SOD (EC-SOD) in DM2 patients compared to the controls, with a positive correlation between the levels of EC-SOD and micro- and macrovascular complications.
The presence of oxidative damage, despite the increase in total SOD activity, could be explained by different cellular responses to the OS [10], due to several factors, being related both to the depletion of antioxidant defenses and to the increased production of RONS, such as the high production of superoxide anion radical (•O2 −), the presence of toxins or even more, the excessive activation of the natural systems of production of these reactive species, such as activation of phagocytic cells in chronic inflammatory diseases, as observed in DM [10]. Thus, the increase in total SOD activity, observed in the present study, suggests a possible adaptive response, probably due to the increased production of the •O2 −, which would lead to an augmentation in the production of H2O2. This mechanism, by its turn, would probably require a higher activity of CAT and GPx. Nevertheless, in this study, no significant differences were detected in the activities of these enzymes in any of the groups (Figure 3). In this sense, the higher SOD/CAT ratio in the DM2 versus controls, DM2(−)SAH versusC(+)SAH, and DM2LPO versusC(+)SAH may suggest an imbalance between SOD and CAT activities in these groups, which, in turn, could indicate the increase in H2O2 production. The latter reactive species, when in high concentrations, had been associated with lesions in the pancreatic beta cells, causing disturbance both in cell signaling and gene expression [32]. However, the present study did not include the quantification of H2O2.
In the absence or inefficiency of defenses against RONS, OS would occur, leading to the activation of cellular mechanisms involved in the stress response, such as NFkB, p38MAPK, and JNK/SAPK, which would stimulate the production of inflammatory cytokines involved in diabetic complications and in pancreatic beta cells dysfunction, thus intensifying defective insulin production [33]. In this context, increased production of RONS by mitochondria becomes deleterious for cell function, once species such as H2O2 and ONOO− can cross the mitochondrial membranes, damaging macromolecules in diverse cellular structures [4]. It is well established that impaired cell glucose metabolism affects mitochondrial function and enhances reactive species production [34], and this seems to be implicated in the cases of IR and endothelial dysfunction which results in the persistence of the metabolic imbalance observed in DM carriers [5]. In this scenario, hyperglycemia has been described as a generator of OS [35, 36]. In accordance with such description, Yang et al. [36] observed greater serum LPO, using the marker MDA, in hyperglycemic mice, verifying that this increase exacerbated the occurrence of myocardial infarction through NADPH oxidase activation. A study by Marfella et al. [37] showed that acute hyperglycemia increased the OS, via an increase in the nitrotyrosine levels by a peroxynitrite-independent mechanism, during hyperglycemic clamp, even in individuals without diabetes. These data corroborate the results described after the individual assessment of DM2 carriers in this study, in which two distinct groups were observed, one with elevated LPO (DM2LPO) and poor glycemic control and another with proper glycemic control and LPO similar to that observed for the remaining groups. Interestingly, these results were independent of the presence of SAH. In these patients, the observed correlations between FG and HbA1c with LPO, especially for levels above 5.6 mmol·L−1 and 6.5%, respectively, are equally indicators of the critical role of the glycemic control in the occurrence of LPO. Thus, it is plausible to suggest that the evident lack of glycemic control, despite the use of pharmaceuticals for this purpose, may promote oxidative stress through NADPH oxidase activation, subsequently increasing •O2 −, which could account, at least partially, for the redox imbalance identified in the case group, as observed by its augmented LPO, the latter followed by increased SOD activity (Figure 3).
The increased degree of IR, observed in this study from HOMA-IR (Table 1), perhaps represents a compensatory mechanism, protecting adipocytes and muscle cells from OS, which is a key element in the pathogenesis of IR in pancreatic beta-cell dysfunction and in hypertension [7]. Furthermore, it was observed a positive correlation between this marker and TBARS in the DM2LPO group, which is corroborated by studies that have demonstrated the association between IR and OS [38, 39] and with LPO markers [39], further reinforcing the connection between glycemic metabolism and OS.
Regarding the transport proteins, high levels of TRF in diabetics and prediabetics, in comparison to the controls (Figure 2(h)), indicate a possible high concentration in the presence of OS. Furthermore, our findings show a significant difference in the levels of TRF between DM2(+)SAH versus pre-DM and C(+)SAH (Figure 2(i)). In contrast, these data differ from those observed by Memişoğullari and Bakan [40], who found that the concentration of TRF was lower in diabetics, especially in those with cardiovascular complications. For CER, an increased concentration was observed only in the DM2(+)SAH group, in relation to the DM2(−)SAH group, with no difference between the other groups (Figure 2(k)). A study by Vasconcelos et al. (2011) showed a high concentration of CER in hypertensive patients [9] but found no difference between the C(+)SAH and C(−)SAH groups. A possible explanation for such apparent discrepancies may be the dependency on diverse factors which directly interfere in the metabolic state, such as age, sex, individual dietary profile, time course of the disease, and presence of comorbidities.
In this sense, the groups assessed presented similar patterns for age, body fat distribution, BMI, and lipid profile, as well as proportionality between genders. These are important parameters since some of them can be related to OS, besides being related to several diseases. In older groups (40–69 years), different concentrations for MDA between genders had been already described [41]. Concerning body fat distribution, the waist circumference (WC) was assessed, being a risk factor for DM2 and cardiovascular diseases (CVD), along with the BMI [42]. In this context, obesity has been related to OS [38, 43]. Accordingly, D'Archivio et al. [38] demonstrated that obese individuals with IR present a profile for the OS similar to that observed in patients with diabetes. Thus, different cardiometabolic parameters are likely synergistically acting, evoking the environment of OS evidenced in DM carriers, as reinforced by the present study. Another substantial factor associated to OS in human populations is smoking. Block et al. [44] observed that the MDA levels were higher in smoker adults (19–78 years) than in nonsmokers, the same not being observed for another marker, the F2-Isoprostane. Notwithstanding, smoker subjects were excluded in the present study.
It is worth noting that in 90% of diabetic patients using oral anti-diabetic agents and about 90% of hypertensive diabetics using antihypertensive drugs (Table 2), pharmaceuticals with proven antioxidant action, the presence of oxidative damage was still found, so that the possible attenuation of the medication was not sufficient to prevent the occurrence of OS. The probable antioxidant effect of oral antidiabetic agents, especially metformin [45], and of antihypertensive drugs has already been described [46, 47]. Metformin analyzed in vitro, for example, was able to react with •OH, but not with •O2 − [45]. Of the other medications used by some study participants, ASA (aspirin) showed a protective effect against cytotoxicity of H2O2 on endothelial cells of animals in vitro [48], with reduced levels of MDA in rabbits [49]. In addition, statins may attenuate the OS in diabetics [50]. Furthermore, Evans et al. [51] demonstrated that insulin therapy improved OS in patients with DM2, probably through changes in the metabolism of free fatty acids. In this study, among the DM2 group, 10.9% were using statins, 27.3% were on insulin therapy, and 32.7% used ASA. Despite this, OS was still detected in these patients, highlighting the complexity of the metabolic pathways determinant of OS in DM, in which the regular use of well-known antioxidant drugs was not capable of inhibiting the establishment of the observed imbalance. Finally, even though the considered sample presents a relatively small size, the occurrence of statistical significance for some of the assessed variables points to the relevance of our findings, as indicators which deserve better attention in further evaluations from larger population studies, especially those related to the redox imbalance participation in determining or maintaining the metabolic alterations observed during the course of DM.
5. Conclusions
Advances towards comprehending the mechanisms in the binomial DM-OS described in the literature allowed the identification and use of biomarkers related to its development, as well as to its complications, opening future possibilities for advancement and practical application, including the therapeutic management of this important metabolic disease. Thus, it is believed that the identification and application of novel biomarkers in diagnosis are essential for better understanding of the pathogenesis of diseases accompanied by OS, as well as for the development of new therapeutic approaches. The data presented herein strongly suggest the involvement of OS in the pathophysiology of diabetes and corroborate the hyperglycemia, along with IR, as key points in this process, mainly demonstrating that the increased LPO presents a close relationship with the high glycemic levels in DM2 patients, especially with the FG, irrespective of the presence of SAH. Such observation for DM as the main determinant of OS either in the presence or absence of SAH is, in our opinion, the major finding of the present work.
Acknowledgments
The authors wish to thank all the patients for the study performance. CAPES, CNPq, FAPEAL, INCT-Bioanalítica, and the PhD Program RENORBIO (Brazil) are acknowledged for financial support.
Abbreviations
- ACEI:
Angiotensin-converting enzyme inhibitor
- ASA:
Acetylsalicylic acid
- BMI:
Body mass index
- C:
Controls
- CAT:
Catalase
- CER:
Ceruloplasmin
- C(–)SAH:
Control without hypertension
- C(+)SAH:
Control with hypertension
- CVD:
Cardiovascular diseases
- CVDfamily:
Cardiovascular disease in the family
- DBP:
Diastolic blood pressure
- DM:
Diabetes mellitus
- DM2:
Type 2 diabetes mellitus
- DMfamily:
Diabetes mellitus in the family
- (DM2LPO):
DM2 patients with higher lipid peroxidation levels
- (DM2(–)LPO):
DM2 patients with lower lipid peroxidation levels
- DM(+)SAH:
Diabetes with hypertension
- DM(–)SAH:
Diabetes without hypertension
- EDTA:
Ethylenediamine tetra-acetic acid
- EC-SOD:
Extracellular superoxide dismutase
- ES/NS:
Ex-smoker/nonsmoker
- FG:
Fasting glucose
- FI:
Fasting insulin
- GPx:
Glutathione peroxidase
- HbA1c:
Glycated hemoglobin
- HOMA-IR:
Homeostasis model assessment—insulin resistance
- HDL:
High-density lipoprotein
- HO:
Hydrogen peroxide
- ICDH:
Integrated Center for Diabetes and Hypertension
- IR:
Insulin resistance
- LSD:
Least significance difference
- LDL:
Low-density lipoprotein
- MDA:
Malondialdehyde
- MS:
Metabolic syndrome
- •O2−:
Superoxide anion radical
- OH:
Hydroxyl radical
- OS:
Oxidative stress
- oxLDL:
Oxidized LDL
- PKC:
Protein kinase C
- pre-DM:
prediabetics
- RONS:
Reactive oxygen and nitrogen species
- SAH:
Systemic arterial hypertension
- SAHfamily:
Systemic arterial hypertension in the family
- SBP:
Systolic blood pressure
- SOD:
Superoxide dismutase
- SH:
Total thiols
- TC:
Total cholesterol
- TG:
Triglycerides
- TRF:
Transferrin
- UFAL:
Federal University of Alagoas
- VLDL:
Very low-density lipoprotein
- W/Bl/Br:
White/black/brown
- WC:
Waist circumference
- Y/N:
Yes/no.
References
- 1.Organização Mundial da Saúde. http://www.who.int/diabetes/en/
- 2.International Diabetes Federation (IDF) http://www.diabetesatlas.org/
- 3.Fowler JM. Microvascular and macrovascular complications of diabetes. Clinical Diabetes. 2011;29:116–122. [Google Scholar]
- 4.Ceriello A, Testa R. Antioxidant anti-inflammatory treatment in type 2 diabetes. Diabetes Care. 2009;32, supplement 2:S232–S236. doi: 10.2337/dc09-S316. [DOI] [PMC free article] [PubMed] [Google Scholar]
- 5.Cerielo A, Motz E, Cavarape A, et al. Hyperglycemia counterbalances the antihypertensive effect of glutathione in diabetic patients: evidence linking hypertension and glycemia through the oxidative stress in diabetes mellitus. Journal of Diabetes and Its Complications. 1997;11(4):250–255. doi: 10.1016/s1056-8727(97)00021-4. [DOI] [PubMed] [Google Scholar]
- 6.Roccella EJ. National high blood pressure education program working group report on hypertension in diabetes. Hypertension. 1994;23(2):145–158. [PubMed] [Google Scholar]
- 7.Ceriello A, Motz E. Is oxidative stress the pathogenic mechanism underlying insulin resistance, diabetes, and cardiovascular disease? The common soil hypothesis revisited. Arteriosclerosis, Thrombosis, and Vascular Biology. 2004;24(5):816–823. doi: 10.1161/01.ATV.0000122852.22604.78. [DOI] [PubMed] [Google Scholar]
- 8.Ceriello A. Possible role of oxidative stress in the pathogenesis of hypertension. Diabetes Care. 2008;31(supplement 2):S181–184. doi: 10.2337/dc08-s245. [DOI] [PubMed] [Google Scholar]
- 9.Vasconcelos SML, Goulart MOF, Silva MAM, et al. Markers of redox imbalance in the blood of hypertensive patients of a community in northeastern Brazil. Arquivos Brasileiros de Cardiologia. 2011;97:141–147. [PubMed] [Google Scholar]
- 10.Halliwell B, Gutteridge JMC. Free Radicals in Biology and Medicine. 4th edition. New York, NY, USA: Oxford University Press; 2007. [Google Scholar]
- 11.Negre-Salvayre A, Salvayre R, Augé N, Pamplona R, Portero-Otín M. Hyperglycemia and glycation in diabetic complications. Antioxidants and Redox Signaling. 2009;11(12):3071–3109. doi: 10.1089/ars.2009.2484. [DOI] [PubMed] [Google Scholar]
- 12.Valko M, Leibfritz D, Moncol J, Cronin MTD, Mazur M, Telser J. Free radicals and antioxidants in normal physiological functions and human disease. International Journal of Biochemistry and Cell Biology. 2007;39(1):44–84. doi: 10.1016/j.biocel.2006.07.001. [DOI] [PubMed] [Google Scholar]
- 13.Evans JL, Maddux BA, Goldfine ID. The molecular basis for oxidative stress-induced insulin resistance. Antioxidants and Redox Signaling. 2005;7(7-8):1040–1052. doi: 10.1089/ars.2005.7.1040. [DOI] [PubMed] [Google Scholar]
- 14.Brownlee M. The pathobiology of diabetic complications: a unifying mechanism. Diabetes. 2005;54(6):1615–1625. doi: 10.2337/diabetes.54.6.1615. [DOI] [PubMed] [Google Scholar]
- 15.Brownlee M. Biochemistry and molecular cell biology of diabetic complications. Nature. 2001;414(6865):813–820. doi: 10.1038/414813a. [DOI] [PubMed] [Google Scholar]
- 16.Monnier L, Colette C. Glycemic variability: should we and can we prevent it? Diabetes Care. 2008;31(supplement 2):S150–154. doi: 10.2337/dc08-s241. [DOI] [PubMed] [Google Scholar]
- 17.Instituto Brasileiro de Geografia e Estatística. 2010, http://www.censo2010.ibge.gov.br/
- 18.Centro de Informações Sobre Saúde e Álcool (CISA) 2011, http://www.cisa.org.br.
- 19.Expert Panel on Detection, Evaluation and Treatment of High Blood Cholesterol in Adults. Executive summary of the third report of the National Cholesterol Education Program (NCEP) expert panel on detection, evaluation, and treatment of high blood cholesterol in adults (adult treatment panel III) Journal of the American Medical Association. 2001;285(19):2486–2497. doi: 10.1001/jama.285.19.2486. [DOI] [PubMed] [Google Scholar]
- 20.American Diabetes Association/ADA. Diagnosis and classification of diabetes mellitus. Diabetes Care. 2011;34(supplement 1):S62–S69. doi: 10.2337/dc11-S062. [DOI] [PMC free article] [PubMed] [Google Scholar]
- 21.Wendel A. Glutathione peroxidase. Methods in Enzymology. 1981;77:325–333. doi: 10.1016/s0076-6879(81)77046-0. [DOI] [PubMed] [Google Scholar]
- 22.Xu P, Costa-Goncalves AC, Todiras M, et al. Endothelial dysfunction and elevated blood pressure in Mas gene-deleted mice. Hypertension. 2008;51(2):574–580. doi: 10.1161/HYPERTENSIONAHA.107.102764. [DOI] [PubMed] [Google Scholar]
- 23.Ellman GL. Tissue sulphydril groups. Archives of Biochemistry and Biophysics. 1959;82:70–77. doi: 10.1016/0003-9861(59)90090-6. [DOI] [PubMed] [Google Scholar]
- 24.Wallin R, Stanton C, Hutson SM. Intracellular maturation of the γ-carboxyglutamic acid (Gla) region in prothrombin coincides with release of the propeptide. Biochemical Journal. 1993;291(3):723–727. doi: 10.1042/bj2910723. [DOI] [PMC free article] [PubMed] [Google Scholar]
- 25.Matthews DR, Hosker JP, Rudenski AS. Homeostasis model assessment: insulin resistance and β-cell function from fasting plasma glucose and insulin concentrations in man. Diabetologia. 1985;28(7):412–419. doi: 10.1007/BF00280883. [DOI] [PubMed] [Google Scholar]
- 26.Ziegler D, Sohr CGH, Nourooz-Zadeh J. Oxidative stress and antioxidant defense in relation to the severity of diabetic polyneuropathy and cardiovascular autonomic neuropathy. Diabetes Care. 2004;27(9):2178–2183. doi: 10.2337/diacare.27.9.2178. [DOI] [PubMed] [Google Scholar]
- 27.Piwowar A, Knapik-Kordecka M, Warwas M. AOPP and its relations with selected markers of oxidative/antioxidative system in type 2 diabetes mellitus. Diabetes Research and Clinical Practice. 2007;77(2):188–192. doi: 10.1016/j.diabres.2006.12.007. [DOI] [PubMed] [Google Scholar]
- 28.Kasznicki J, Kosmalski M, Sliwinska A, et al. Evaluation of oxidative stress markers in pathogenesis of diabetic neuropathy. Molecular Biology Reports. 2012;39(9):8669–8678. doi: 10.1007/s11033-012-1722-9. [DOI] [PMC free article] [PubMed] [Google Scholar]
- 29.Moussa SA. Oxidative stress in diabetes mellitus. Romanian Journal of Biophysics. 2008;18:225–236. [Google Scholar]
- 30.Savu O, Ionescu-Tirgoviste C, Atanasiu V, et al. Increase in Total Antioxidant Capacity of Plasma Despite High Levels of Oxidative Stress in Uncomplicated Type 2 Diabetes Mellitus. The Journal of International Medical Research. 2012;40:709–716. doi: 10.1177/147323001204000235. [DOI] [PubMed] [Google Scholar]
- 31.Kimura F, Hasegawa G, Obayashi H, et al. Serum extracellular superoxide dismutase in patients with type 2 diabetes: relationship to the development of micro- and macrovascular complications. Diabetes Care. 2003;26(4):1246–1250. doi: 10.2337/diacare.26.4.1246. [DOI] [PubMed] [Google Scholar]
- 32.Maechler P, Jornot L, Wollheim CB. Hydrogen peroxide alters mitochondrial activation and insulin secretion in pancreatic beta cells. Journal of Biological Chemistry. 1999;274(39):27905–27913. doi: 10.1074/jbc.274.39.27905. [DOI] [PubMed] [Google Scholar]
- 33.Evans JL, Goldfine ID, Maddux BA, Grodsky GM. Oxidative stress and stress-activated signaling pathways: a unifying hypothesis of type 2 diabetes. Endocrine Reviews. 2002;23(5):599–622. doi: 10.1210/er.2001-0039. [DOI] [PubMed] [Google Scholar]
- 34.Ramasamy R, Vannucci SJ, Yan SSD, Herold K, Yan SF, Schmidt AM. Advanced glycation end products and RAGE: a common thread in aging, diabetes, neurodegeneration, and inflammation. Glycobiology. 2005;15(7):16R–28R. doi: 10.1093/glycob/cwi053. [DOI] [PubMed] [Google Scholar]
- 35.Quagliaro L, Piconi L, Assaloni R, Martinelli L, Motz E, Ceriello A. Intermittent high glucose enhances apoptosis related to oxidative stress in human umbilical vein endothelial cells: the role of protein kinase C and NAD(P)H-oxidase activation. Diabetes. 2003;52(11):2795–2804. doi: 10.2337/diabetes.52.11.2795. [DOI] [PubMed] [Google Scholar]
- 36.Yang Z, Laubach VE, French BA, Kron IL. Acute hyperglycemia enhances oxidative stress and exacerbates myocardial infarction by activating nicotinamide adenine dinucleotide phosphate oxidase during reperfusion. Journal of Thoracic and Cardiovascular Surgery. 2009;137(3):723–729. doi: 10.1016/j.jtcvs.2008.08.056. [DOI] [PMC free article] [PubMed] [Google Scholar]
- 37.Marfella R, Quagliaro L, Nappo F, et al. Acute hyperglycemia induces an oxidative stress in healthy subjects. Journal of Clinical Investigation. 2001;108(4):635–636. doi: 10.1172/JCI13727. [DOI] [PMC free article] [PubMed] [Google Scholar]
- 38.D’Archivio M, Annuzzi G, Varì R, et al. Predominant role of obesity/insulin resistance in oxidative stress development. European Journal of Clinical Investigation. 2012;42(1):70–78. doi: 10.1111/j.1365-2362.2011.02558.x. [DOI] [PubMed] [Google Scholar]
- 39.Park K, Gross M, Lee D-H, et al. Oxidative stress and insulin resistance: the Coronary Artery Risk Development in Young Adults study. Diabetes Care. 2009;32(7):1302–1307. doi: 10.2337/dc09-0259. [DOI] [PMC free article] [PubMed] [Google Scholar]
- 40.Memişoğullari R, Bakan E. Levels of ceruloplasmin, transferrin, and lipid peroxidation in the serum of patients with Type 2 diabetes mellitus. Journal of Diabetes and Its Complications. 2004;18(4):193–197. doi: 10.1016/S1056-8727(03)00032-1. [DOI] [PubMed] [Google Scholar]
- 41.Ínal ME, Kanbak G, Sunal E. Antioxidant enzyme activities and malondialdehyde levels related to aging. Clinica Chimica Acta. 2001;305(1-2):75–80. doi: 10.1016/s0009-8981(00)00422-8. [DOI] [PubMed] [Google Scholar]
- 42.Janiszewski PM, Janssen I, Ross R. Does waist circumference predict diabetes and cardiovascular disease beyond commonly evaluated cardiometabolic risk factors? Diabetes Care. 2007;30:3105–3109. doi: 10.2337/dc07-0945. [DOI] [PubMed] [Google Scholar]
- 43.Urakawa H, Katsuki A, Sumida Y, et al. Oxidative stress is associated with adiposity and insulin resistance in men. Journal of Clinical Endocrinology and Metabolism. 2003;88(10):4673–4676. doi: 10.1210/jc.2003-030202. [DOI] [PubMed] [Google Scholar]
- 44.Block G, Dietrich M, Norkus EP, et al. Factors associated with oxidative stress in human populations. American Journal of Epidemiology. 2002;156(3):274–285. doi: 10.1093/aje/kwf029. [DOI] [PubMed] [Google Scholar]
- 45.Khouri H, Collin F, Bonnefont-Rousselot D, Legrand A, Jore D, Gardès-Albert M. Radical-induced oxidation of metformin. European Journal of Biochemistry. 2004;271(23-24):4745–4752. doi: 10.1111/j.1432-1033.2004.04438.x. [DOI] [PubMed] [Google Scholar]
- 46.Sáez GT, Tormos C, Giner V, et al. Factors related to the impact of antihypertensive treatment in antioxidant activities and oxidative stress by-products in human hypertension. American Journal of Hypertension. 2004;17(9):809–816. doi: 10.1016/j.amjhyper.2004.05.022. [DOI] [PubMed] [Google Scholar]
- 47.Ghiadoni L, Magagna A, Versari D, et al. Different effect of antihypertensive drugs on conduit artery endothelial function. Hypertension. 2003;41(6):1281–1286. doi: 10.1161/01.HYP.0000070956.57418.22. [DOI] [PubMed] [Google Scholar]
- 48.Podhaisky H-P, Abate A, Polte T, Oberle S, Schröder H. Aspirin protects endothelial cells from oxidative stress—possible synergism with vitamin E. FEBS Letters. 1997;417(3):349–351. doi: 10.1016/s0014-5793(97)01307-0. [DOI] [PubMed] [Google Scholar]
- 49.Prasad K, Lee P. Suppression of oxidative stress as a mechanism of reduction of hypercholesterolemic atherosclerosis by aspirin. Journal of Cardiovascular Pharmacology and Therapeutics. 2003;8(1):61–69. doi: 10.1177/107424840300800i109. [DOI] [PubMed] [Google Scholar]
- 50.Ceriello A, Assaloni R, Da Ros R, et al. Effect of atorvastatin and irbesartan, alone and in combination, on postprandial endothelial dysfunction, oxidative stress, and inflammation in type 2 diabetic patients. Circulation. 2005;111(19):2518–2524. doi: 10.1161/01.CIR.0000165070.46111.9F. [DOI] [PubMed] [Google Scholar]
- 51.Evans M, Anderson RA, Smith JC, et al. Effects of insulin lispro and chronic vitamin C therapy on postprandial lipaemia, oxidative stress and endothelial function in patients with type 2 diabetes mellitus. European Journal of Clinical Investigation. 2003;33(3):231–238. doi: 10.1046/j.1365-2362.2003.01120.x. [DOI] [PubMed] [Google Scholar]