Abstract
Imaging of photochemical yield of photosystem II (PSII) computed from leaf chlorophyll fluorescence images and gas-exchange measurements were performed on Rosa rubiginosa leaflets during abscisic acid (ABA) addition. In air ABA induced a decrease of both the net CO2 assimilation (An) and the stomatal water vapor conductance (gs). After ABA treatment, imaging in transient nonphotorespiratory conditions (0.1% O2) revealed a heterogeneous decrease of PSII photochemical yield. This decline was fully reversed by a transient high CO2 concentration (7400 μmol mol−1) in the leaf atmosphere. It was concluded that ABA primarily affected An by decreasing the CO2 supply at ribulose-1,5-bisphosphate carboxylase/oxygenase. Therefore, the An versus intercellular mole fraction (Ci) relationship was assumed not to be affected by ABA, and images of Ci and gs were constructed from images of PSII photochemical yield under nonphotorespiratory conditions. The distribution of gs remained unimodal following ABA treatment. A comparison of calculations of Ci from images and gas exchange in ABA-treated leaves showed that the overestimation of Ci estimated from gas exchange was only partly due to heterogeneity. This overestimation was also attributed to the cuticular transpiration, which largely affects the calculation of the leaf conductance to CO2, when leaf conductance to water is low.
Our understanding of the response of leaf photosynthesis to environmental factors is highly dependent on the interpretation of photosynthetic gas exchange and particularly on the relationship between net CO2 assimilation and Ci (Farquhar and Sharkey, 1982). Ci estimations from gas exchange, which are formally estimations of the CO2 mole fraction at the evaporating sites (Parkhurst, 1994), are based on the assumption that photosynthesis and transpiration are relatively uniform over the leaf area. This assumption appears to be adequate for most leaves when stomatal conductance is maximal, as most stomata are open. When stomatal conductance decreases, however, this assumption may not be valid. Upon application of ABA, short-term water stress, or low humidity, the occurrence of a nonuniform distribution or patchy distribution of the stomatal aperture and photosynthesis has been reported (Downton et al., 1988a, 1988b; Terashima et al., 1988; Daley et al., 1989; Raschke et al., 1990; Mott et al., 1993; Mott, 1995).
Upon ABA treatment, photosynthetic capacity measured under nonlimiting CO2 availability remained unaffected, and since the patterns of distribution of stomatal aperture and photosynthesis were identical, the patchy response has been primarily attributed to a nonuniform distribution of stomatal closure (Terashima et al., 1988). In this context, the commonly reported unresponsiveness of Ci relative to net CO2 assimilation decline under these conditions, classically described as a nonstomatal inhibition of photosynthesis (Seemann and Sharkey, 1987), has been interpreted as an artifact due to patchy response (Downton et al., 1988a, 1988b; Terashima et al., 1988; Raschke et al., 1990; Mott, 1995).
Potential overestimation of Ci when the distribution of stomatal aperture over the leaf is heterogeneous has been pointed out previously (Laisk et al., 1980). By modeling a bimodal distribution of leaf stomatal conductance, several authors (Downton et al., 1988a, 1988b; Terashima et al., 1988; Van Kraalingen, 1990) have concluded that the occurrence of heterogeneous stomatal distribution fully explains the behavior of Ci under ABA or short-term water stress. Using a modeling approach, Cheeseman (1991) and very recently Buckley et al. (1997) have shown that such large overestimation of Ci could not be fully accounted for by heterogeneous stomatal conductance if a unimodal distribution of the stomatal aperture was assumed. Recently, a corresponding unimodal distribution of photosynthesis under ABA treatment has been reported (Meyer and Genty, 1995; Mott, 1995).
The aim of this study was to assess the significance of Ci under patchy photosynthesis induced by ABA treatment in Rosa rubiginosa leaves. By using an experimental approach that allows the mapping of the photochemical yield of PSII from leaf chlorophyll fluorescence images (Genty and Meyer, 1995), we have demonstrated that ABA primarily affects photosynthesis by decreasing stomatal conductance. Assuming the CO2 assimilation versus Ci relationship was not affected by ABA, high-resolution images of Ci were constructed from images of the photochemical yield of PSII. Calculations of Ci from gas exchange and images were compared and it was confirmed that Ci estimated from gas exchange is largely overestimated. We have shown that this overestimation is only partly due to stomatal closure heterogeneity, in contrast to previous understanding. This overestimation also results from an overestimation of leaf conductance to CO2 calculated from conductance to H2O, which we attribute to cuticular transpiration. Important implications for the interpretation of photosynthetic gas-exchange data are discussed. A preliminary account of some of this work was presented earlier (Meyer and Genty, 1995).
MATERIALS AND METHODS
Plants of Rosa rubiginosa L. were cultivated in pots in a greenhouse under natural sunlight and photoperiod during the summer (1994 and 1995). Daily maximum and minimum air temperatures were 35 and 15°C, respectively. Detached, fully expanded leaves were used, with the petiole kept in distilled water throughout the experiment. Leaves were dark adapted for 1 h before the experiment and the apical leaflet was used for measurement.
Transverse leaflet sections and replicas of epidermis have shown that R. rubiginosa leaves were heterobaric and hypostomatous (Bro et al., 1996). In this early study, the mean leaflet area was 6.3 ± 1.5 (n = 7 leaves) cm2, the mean surface of an areole (Terashima, 1992) was 0.221 ± 0.055 mm2 (n = 9), and the stomatal density was 112 ± 69 (n = 12) stomata mm−2.
Gas-Exchange Measurements
An open-flow gas-exchange system and a clamp on the leaf cuvette described in Genty and Meyer (1995) were used for the measurements of CO2 and water vapor net exchanges. Cuvette foam gaskets were coated with paraffin for minimal water adsorption. Cuvette temperature was kept constant at 25°C. The vapor pressure deficit between the leaflet and air was maintained between 0.8 and 1.2 kPa. Gas-exchange parameters and leaflet temperature were calculated according to the method of von Caemmerer and Farquhar (1981) and Parkinson (1985), respectively, for the leaflet projected area and one transpiring surface (since R. rubiginosa leaflets are hypostomatous). By using a leaf energy-balance method, an average temperature for the area of the leaflet under consideration was provided. gb was 1.94 mol m−2 s−1.
Mapping of PSII Photochemical Yield using Chlorophyll Fluorescence Imaging
The method is described in detail in Genty and Meyer (1995). A video charge-coupled-device camera imaged the chlorophyll fluorescence of the upper side of the whole-leaf surface from which gas-exchange measurements were performed. Routine cycles of two images, one of steady-state relative fluorescence yield, Φ, and the other of maximal relative fluorescence yield, Φm, were digitized and used to construct in near-real time an image of the photochemical yield of PSII, ΦPSII by computing pixel by pixel (1 − Φ/Φm) (Genty et al., 1989).
Images of ΦPSII were stored as 512 × 512 pixels frames with an 8-bit resolution. Frequency distribution histograms were computed from native images of ΦPSII in floating- point mode with 32-bit precision using Labview software (National Instruments, Austin, TX) and dedicated processing routines (Concept VI, Graphtek, Mirmande, France). All images used for quantitative analysis of distribution of gas-analysis parameters correspond to the open area (6.25 cm2) of the gas-exchange chamber, which comprised more than 75 to 90% of the total leaflet area. The single areoles of R. rubiginosa leaflets correspond to about 150 pixels, and 3 to 4 pixels refer to about 1 stoma and 10 epidermal cells.
Mapping of Intercellular CO2 Mole Fraction, CO2 Assimilation, Water Vapor Conductance, Transpiration, and Leaf Temperature from Images of the Photochemical Yield of PSII
A, An, Ci, gt, gs, wi, Tl, E, and R correspond to global measurements (conventional gas-exchange data): A, gross CO2 assimilation; An, net CO2 assimilation; Ci, intercellular CO2 mole fraction; gt, total water vapor conductance; wi, intercellular mole fraction of water vapor; Tl, leaf temperature; E, rate of transpiration; and R, respiration in the dark.
Ai, Ani,
Cii, gti,
gsi, wii,
Tii, Ei,
(1 − Φ/Φm)i, and
Ri correspond to local measurements (pixel
i) and Ā,
Ān,
C̄i,
ḡt,
ḡs,
w̄i,
T̄l, Ē, 
 , and R̄
correspond to the means of local measurements.
In nonphotorespiratory conditions, (1 − Φ/Φm), which is a relative estimate of the quantum yield of gross CO2 assimilation (Genty et al., 1989), can be used to estimate Ai as:
 |
1 |
where I is the incident photon flux density,
k and d are the slope, and the Y is
the intercept obtained from the linear regression of the relationship
between the mean of the photochemical yield of PSII, 
 , and the quantum yield of gross
CO2 assimilation of the considered experiment
(typical regression slope k was 11.4 with d
= 0.06).
According to Farquhar et al. (1980), in ribulose-bisphophate saturated and nonphotorespiratory conditions, Ai can be described by a hyperbolic function of Cii as:
 |
2 |
where a and b were obtained from the best fit of Equation 2 for the gas-exchange data obtained in uniform photosynthesis (before ABA feeding Cii and Ai equal Ci and A, respectively). We have substituted Ai of Equation 2 by its expression in Equation 1 to resolve for Cii. These calculations assume no change of the relationship between A and Ci during the course of a considered experiment. The validity of this assumption will be examined in Results and in Discussion.
Making the same assumption, the total conductance to H2O, gti, the transpiration, Ei, and the leaf temperature, Tli, were calculated from (1 − Φ/Φm)i, for each pixel of images of the photochemical yield of PSII by solving numerically for the unknowns gti, Ei, Tli and wii, the system of Equations 3, 4, 5, and 6:
 |
3 |
where Ani = Ai − Ri, with Ri taken as R and where Ai and Cii were substituted by their expression in function of (1 − Φ/Φm)i using Equations 1 and 2. Ca is the ambient CO2 mole fraction in the chamber.
 |
4 |
where wa is the ambient H2O mole fraction in the chamber.
 |
5 |
where Ta is the air temperature (°C) in the chamber, Is is the total short-wave irradiance on the leaf, α represents the fraction absorbed, λ is the latent heat of vaporization of water, ρ is the air density, Cp is its specific heat capacity, ε is the thermal emissivity of the leaf, and ς is the Stefan-Boltzmann constant. The factor 0.93 is for converting the boundary layer conductance of water vapor (gb) into heat- transfer conductance for a laminar boundary layer. The factor 2 in the denominator accounts for the two-sided heat conductance of the leaf, since gb is a one-sided conductance in the first term of the denominator, and thermal absorption and emission by both sides of the leaf in the second term.
 |
6 |
where Pa is the ambient total pressure (kPa).
Equations 3 and 4 were derived from von Caemmerer and Farquhar (1981). In Equation 3, gi was directly calculated from the 1.6 ratio of diffusivities of water vapor and CO2, since stomatal conductance was low in the presence of ABA; so the correction for the “laminar flow”-like transport of water vapor and CO2 in the boundary layer can be neglected. Equation 5 was derived from the energy-balance method described by Parkinson (1985). In this expression, neither the possible heat-conduction exchange from a local site to another local site nor the small contribution of net energy storage were taken into account. Equation 6 was derived from Buck (1981).
From gti, stomatal conductance to water vapor, gsi, was calculated by assuming that gb was constant over the leaflet. Images of Cii, Ani, gti, gsi, Tli, and Ei were constructed from a given image of (1 − Φ/Φm)i and the means C̄i, Ān, ḡt, ḡs, T̄l, and Ēwere computed from images. All calculations were computed from native images of ΦPSII in floating-point mode with 64-bit precision using Labview software and dedicated processing routines (Concept VI, Graphtek).
Protocol
Experiments were performed at a photon flux density of 385 to 420 μmol m−2 s−1 in air. After a steady state was reached, leaf chamber CO2 mole fraction was varied in steps between ambient air composition and around 100 μmol mol−1 and back to air composition. cis-trans ABA (99% purity, Sigma) was then added to the water supply of the leaf petiole to bring its concentration to 10−4 m. Sets of images of PSII photochemical yield were recorded just before and during a brief transition to 0.1% O2, before ABA feeding, for the various external CO2 mole fraction, and after ABA feeding, when a pseudo-steady state was reached.
A subsaturating photon flux density of 385 to 420 μmol m−2 s−1 was chosen to remain in ribulose-bisphosphate-saturated condition for Rubisco activity at 340 μmol mol−1 CO2 during transition in nonphotorespiratory conditions while keeping a large enough quantum yield of CO2 assimilation for maximal accuracy of (1 − Φ/Φm)i imaging.
RESULTS
Time Course of the Leaf Gas-Exchanges Response to ABA Treatment
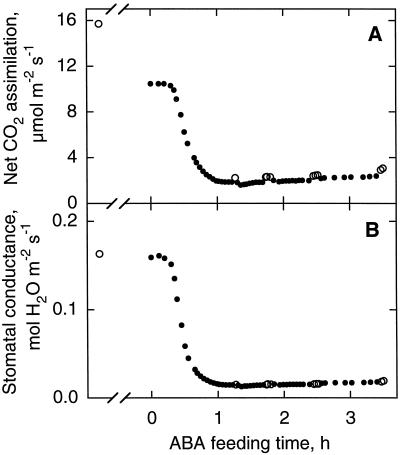
Figure 1 shows the time course of An and gs measured by gas exchange during the ABA feeding of a R. rubiginosa leaflet. The decline of gs began 10 min after the addition of ABA and preceded the decrease of An. A steady state was reached 1 h later. In response to ABA, An and gs decreased by 80 and 90%, respectively, as commonly reported (Cummins et al., 1971; Farquhar and Sharkey, 1982; Raschke and Hedrich, 1985; Mott, 1995). When brief transitions to nonphotorespiratory conditions were performed (open symbols in Fig. 1), An increased by about 50 and 25% before and after ABA treatment, respectively, whereas gt remained unchanged. Thus, stomatal conductance was not significantly affected by transition to an oxygen-depleted atmosphere. After each transition, 5 to 15 min were required for the recovery of steady An in air.
Figure 1.
Time course of An (A) and gs (B) during ABA feeding of a leaf of R. rubiginosa. ABA was added to the water supply of the petiole to bring its concentration to 10−4 m. Leaflet atmosphere was 340 μmol mol−1 CO2, 21% (•) or 0.1% (○) O2, and 70% RH. The photon flux density was 410 μmol m−2 s−1.
Distribution of Photosynthesis in ABA-Fed Leaves
CO2 and O2 Dependency
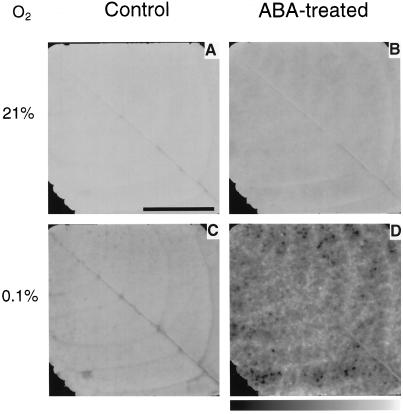
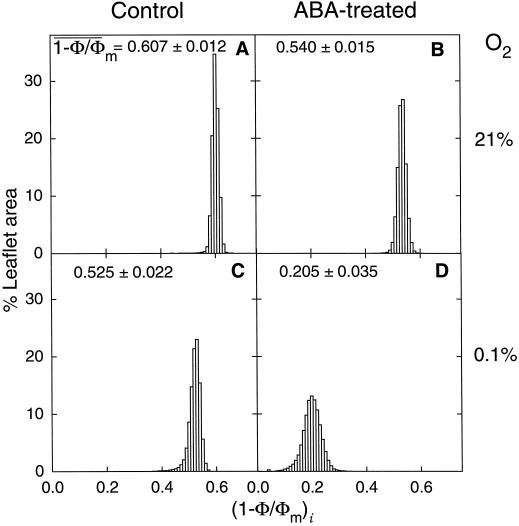
Figure 2 shows images of the photochemical yield of PSII obtained in air (A and B), and during transition to 0.1% O2 (C and D), before (A and C) and after (B and D) addition of ABA at near-air external CO2 concentration. Relative pixel intensity was scaled to an 8-bit gray scale, where black and white corresponded to a photochemical yield of 0 and 0.75 (A–C) or 0.4 (D), respectively. Before adding ABA, the distribution of PSII photochemical yield was uniform and the mean photochemical yield was high both in air and during transition in 0.1% O2 (Figs. 2, A and C, and 3, A and C). In response to the treatment in air, no heterogeneity was observed and photochemical yield was high (Figs. 2B and 3B), whereas a heterogeneous distribution of photochemical yield was revealed in nonphotorespiratory conditions (Fig. 2D). The corresponding distribution of frequencies shows that the mean photochemical yield markedly decreased under nonphotorespiratory conditions and that the distribution function was unimodal (Fig. 3D). This was the case in all experiments, but the shape of the distribution varied from experiment to experiment.
Figure 2.
Images of (1 − Φ/Φm)i taken before (A and C) and during (B and D) treatment of a leaf of R. rubiginosa with 10−4 M ABA. Leaflet atmosphere was 340 μmol mol−1 CO2, 21% (A and B) or 0.1% (C and D) O2, and 70% RH. The photon flux density was 390 μmol m−2 s−1. The bar indicates 1 cm. Three to four pixels represent about 1 stoma and 10 epidermal cells. Pixel intensity was scaled using an 8-bit gray scale where black and white correspond to a photochemical yield of 0 and 0.75, respectively (A–C), or 0 and 0.4, respectively (D). An was 9.1, 2.9, 14.3, and 3.6 μmol m−2 s−1 for A through D, respectively, and gs was 142, 23, 153, and 22 mmol m−2 s−1 for A through D, respectively.
Figure 3.
Frequency distributions of (1 −
Φ/Φm)i (expressed as a leaflet area
percentage) corresponding to the images A through D of Figure 2.

 with sd are
indicated. The class size is 0.01.
Before the addition of ABA, the PSII photochemical yield barely depended on O2 concentration. After transiently suppressing photorespiration in 0.1% O2, the mean photochemical yield only decreased by 13.5% (Fig. 2, A and C), although total conductance to water vapor did not decline. This suggests that CO2 fixation was an electron transport sink almost large enough to compensate for the lack of photorespiration, as predicted by models based on kinetic properties of Rubisco for subsaturating irradiances (Farquhar et al., 1980). In air, O2-dependent processes other than photorespiration may also have occurred, however, they are not considered in this discussion, since their contribution is likely to be very small in steady-state experiments where Ci never dropped below CO2 compensation (see Genty and Harbinson, 1996). During the transition to nonphotorespiratory conditions, the PSII photochemical yield especially decreased in mesophyll cells bordering the midrib of the leaflet (Fig. 2C) corresponding to the “tail” of low values of the (1 − Φ/Φm)i distribution (Fig. 3C). In this area (2% of all the mapped leaflet), which was not seen in air, CO2 availability was presumably lower than in surrounding mesophyll because of a diffusive limitation (Bro et al., 1996).
O2 dependency of PSII photochemical yield was markedly enhanced after the ABA treatment. The suppression of photorespiration induced a decrease of the mean photochemical yield of 62% (Fig. 3, B and D), which indicates that the allocation of electron transport to the fixation of CO2 had markedly decreased, as shown by the reduction of net CO2 assimilation after ABA treatment in an O2-depleted atmosphere. On the other hand, in air, O2 reduction by the glycolate pathway and internal reassimilation of evolved CO2 were able to uniformly drive a large photochemistry over the ABA-treated leaflet. Actually, in air, photorespiration almost masked the heterogeneous decrease in CO2 fixation, which was revealed by imaging (1 − Φ/Φm)i during the transition in nonphotorespiratory conditions (Figs. 2D and 3D). It is worth noting that a slight decrease of mean photochemical yield occurred in air, in response to ABA (Fig. 3, A and B). This was similar to the one seen after O2 depletion in the control leaflet (Fig. 3, A and C). However, in contrast to what happens in nonphotorespiratory conditions (Fig. 2C), this slight decrease in photochemical yield occurred randomly distributed over the leaflet area (Fig. 2B) and the distribution of frequencies was narrower and symmetrical (Fig. 3B). This further supports the suggestion that O2-dependent processes were the major sink for electron transport in ABA-treated leaves, since local internal O2 concentration is likely to be uniform over the leaflet area.
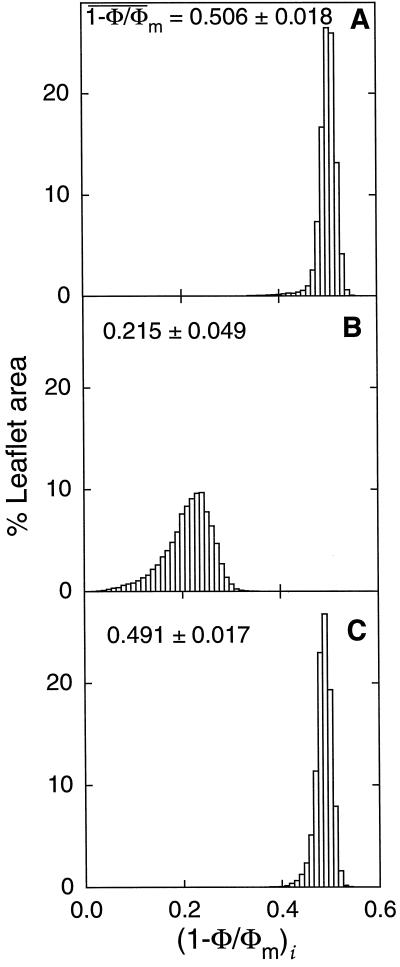
ABA-treated leaves were exposed to a short pulse of high-CO2 concentration in nonphotorespiratory conditions to test whether a CO2-supply limitation of photosynthesis could be ruled out. Within 1 min, transient high CO2 (7400 μmol mol−1 CO2) fully reversed the heterogeneous decrease of (1 − Φ/Φm)i in response to ABA (Figs. 4 and 5). The fast kinetics of the reversion of the photochemical quantum yield of PSII and therefore of CO2 assimilation showed that the response of photosynthesis to ABA only involved diffusive phenomena and was unlikely to result from a down-regulation of carboxylation demand, hypothesized as a long-term effect of leaf CO2 deficiency (Terashima et al., 1988; Ort et al., 1994). This confirmed the intactness and the uniformity of the photosynthetic capacity in ABA-treated leaves. These data provide unambiguous support for the hypothesis that ABA treatment only reduced the diffusion of CO2 into the leaflet through the closure of stomata, as suggested by previous studies (Downton et al., 1988a; Terashima et al., 1988; Ward and Drake, 1988; Graan and Boyer, 1990; Lauer and Boyer, 1992; Raschke et al., 1990). This also supported the assumption we used in subsequent calculations and discussion of significance of Ci, that no change should occur in the A/Ci relationship during the course of the experiment.
Figure 4.
Images of (1 − Φ/Φm)i taken before (A) and during (B and C) the ABA treatment of a leaflet fraction area of R. rubiginosa at normal (A and B) and high (C) external CO2 mole fraction for 1 min. Leaflet atmosphere was 330 μmol mol−1 CO2 (A and B) or about 7400 μmol mol−1 CO2 (C), 0.1% O2, and 65% RH. The photon flux density was 420 μmol m−2 s−1. The bar indicates 4 mm. Pixel intensity was scaled using an 8-bit gray scale where black and white correspond to a photochemical yield of 0 and 0.6, respectively (A and C), or 0 and 0.4, respectively (B). For the whole leaflet area (5.5 cm2), An and gs were 16.1 (A), 4.1 (B) μmol m−2 s−1, and 165 (A), 27 (B) mmol m−2 s−1, respectively.
Figure 5.
Frequency distributions of (1 −
Φ/Φm)i (expressed as a leaflet area
percentage) corresponding to images of Figure 4. 
 and sd are indicated. The class
size is 0.01.
Pattern of Heterogeneity
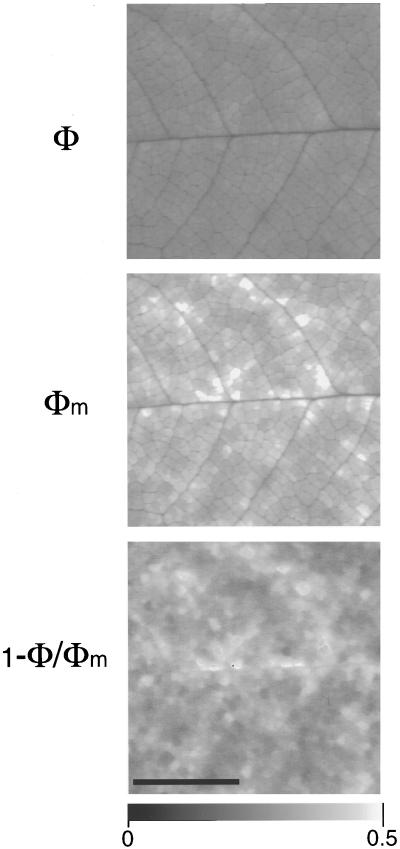
In response to ABA, the decrease in PSII photochemical yield was seen all over the leaflet in nonphotorespiratory conditions (Figs. 2D and 3D). However, the extent of the decrease varied spatially, resulting in a mosaic of patches of about 0.2 mm2 (Figs. 2D and 6). In the experiment depicted in Figure 2, patches of similar yield were grouped in such a way that they formed larger areas that drew the net of the major veins that diverged from the midrib; (1 − Φ/Φm)i was the highest in groups of patches close to major veins (Fig. 2D). This pattern varied from experiment to experiment.
Figure 6.
Detail of images of Φ and Φm and
of the corresponding (1 − Φ/Φm)i
taken during the treatment of leaflet of R. rubiginosa
with ABA (10−4 m). Typical surface of an
areole was about 0.2 mm2. Leaflet atmosphere was 340 μmol
mol−1 CO2, 0.1% O2, and 70% RH.
The photon flux density was 385 μmol m−2
s−1. The bar indicates 4 mm. Eight to 10 pixels correspond
to about 1 stoma and 10 epidermal cells. 
 was 0.329 ± 0.046 for the leaf area
depicted. For the Φ and Φm images, the scaling of pixel
intensity was done using an 8-bit gray scale where black and white
pixels correspond to a relative fluorescence yield of 0 and 0.72,
respectively (Φ), or 0 and 1, respectively (Φm). For
the image of (1 − Φ/Φm), black and white pixels
correspond to 0 and 0.5, respectively.
Figure 6 shows a detail of images of Φ and Φm and the corresponding image of (1 − Φ/Φm) for an ABA-treated leaflet during a transition in O2-depleted atmosphere. Contrast of the image of Φ has been enhanced to better illustrate the local variations of Φ. Images of Φm and (1 − Φ/Φm) show a similar pattern of heterogeneity. Φ also varied according to similar pattern but to a lesser extent. Thus, the patches in which Φ and Φm were low also showed a low (1 − Φ/Φm). It is worth noting that in five out of nine experiments, in some patches (no more than 1.5% of all the leaflet area), in nonphotorespiratory conditions, the photochemical yield could be very low (values of about 30% of the mean (1 − Φ/Φm)). This was due to a large increase in Φ and Φm, which became almost equal (not shown). It mimicked the action of an inhibitor of electron transport-like DCMU (Genty and Meyer, 1995), and was reversible following either a brief addition of high CO2 or the restoration of normal O2 concentration. This suggests that ABA could locally inhibit the photochemical efficiency of PSII in some areoles of the leaflet under nonphotorespiratory conditions. This may be the consequence of the severe depletion of sinks that drive electron transport in nonphotorespiratory conditions in these areoles (Genty and Harbinson, 1996). In most experiments after ABA treatment, Φm decreased by about 30% and Φ increased by about 10%. In all experiments the percentage of heterogeneity (estimated by the ratio of the sd versus the mean of pixel values over the leaflet area) of Φ and Φm distributions was greater than that of (1 − Φ/Φm)i before the ABA treatment (Fig. 6, Φ, Φm, (1 − Φ/Φm); 7, 9, and 3%, respectively), and lower after the treatment (Fig. 6, Φ, Φm, (1 − Φ/Φm); 6, 11, and 14%, respectively). Variations of (1 − Φ/Φm)i were not linearly related to variations of Φm. This is a consequence of the fact that the quantum yield of PSII is not linearly related to the qN of Φm (Genty et al., 1989; Siebke and Weis, 1995).
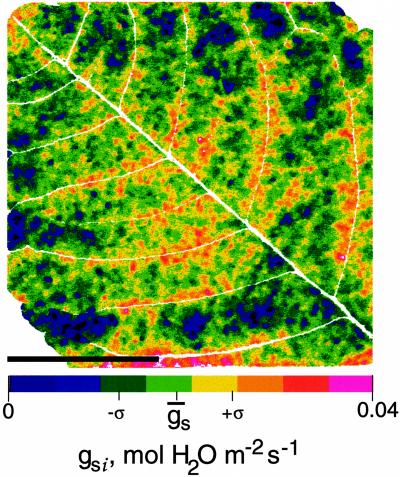
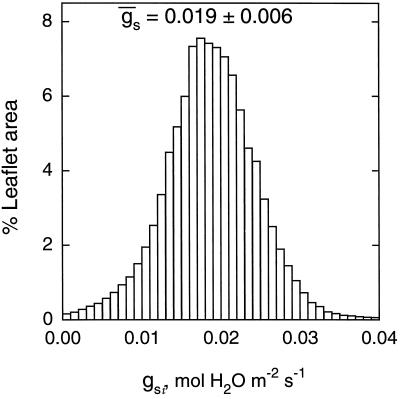
Using Equations 1 to 6, images of An, gs, Ci, E, and Tl were derived from the image of (1 − Φ/Φm)i obtained for an ABA-treated leaflet in nonphotorespiratory conditions. Figure 7 shows the image of gsi corresponding to the image of (1 − Φ/Φm)i shown in Figure 2D. The frequency distribution remained unimodal (Fig. 8), which was also the case for images of Ani, Cii, Ei, and Tli (not shown). The histogram of the frequency distribution of gs was wider than that of (1 − Φ/Φm)i. The low values of gsi indicated that most of the stomata were almost closed. The percentage of heterogeneity was twice that of (1 − Φ/Φm)i (Fig. 8). The histogram was truncated for zero conductance because of the fact that some spots on the source image of (1 − Φ/Φm)i (only 0.8% of the leaflet area) corresponded to a negative conductance not taken into account in computation of the histogram of gsi. This problem mainly resulted from the assumption we used in Equations 1 through 3 that Ri (local respiration) remained constant over the leaf area and during the time course of an experiment. It is interesting that, although the coefficient of variation was large in images of An, gs, Ci, and E, the coefficient of variation of Tl over the leaf area was always small (i.e. 0.08% for the image of Tl corresponding to the data of Fig. 7, where Tl was 25.6°C). This implies that in our conditions, leaf thermal imaging would have been almost unusable to resolve such a heterogeneous pattern of photosynthesis.
Figure 7.
Image of gsi computed from image of (1 − Φ/Φm)i taken during ABA treatment (Fig. 2D). Image was calculated according to the method detailed in Methods. The bar indicates 1 cm. The 3-bit color scale corresponds to a gsi scale from 0 to 0.04 mol m−2 s−1. ḡs with sd are indicated. Major veins are shown by the white pixels of the image.
Figure 8.
Frequency distributions of gsi (expressed as a leaflet area percentage) corresponding to Figure 7. ḡs with sd are indicated. The class size is 0.001 mol m−2 s−1. gs computed from gas exchange was 0.022 mol m−2 s−1. The image of gsi was computed from an image of (1 − Φ/Φm)i (Fig. 2D) according to Methods: Ān, C̄i, and ḡs were 14 ± 0.7, 118 ± 8.6, and 0.105 ± 0.010, respectively, before the ABA treatment and, 3.6 ± 1.1, 25 ± 7.1, and 0.019 ± 0.006, respectively, after the treatment.
Figures 2D, 4B, 6, and 7 show that dark areoles with low (1 − Φ/Φm)i and low gsi could be in contact with brighter areoles with higher (1 − Φ/Φm)i and higher gsi. Only veins separated them. These veins sustained extensions constituted by tightly joined living cells (Wylie, 1952; Terashima, 1992). These vein extensions are an obligate liquid-phase diffusion pathway for CO2 and consequently may prevent a rapid homogenization of gases in intercellular spaces when stomatal closure is heterogeneous. However, in spite of the compartmentation of gas exchanges, the frequency distributions of heterogeneous (1 − Φ/Φm)i and gsi over the whole leaflet area were unimodal according to Figures 3D and 8, as were the distributions of the corresponding images of Φ and Φm (not shown).
The Relationship between  , Net CO2 Assimilation, and
Intercellular CO2 Mole Fraction
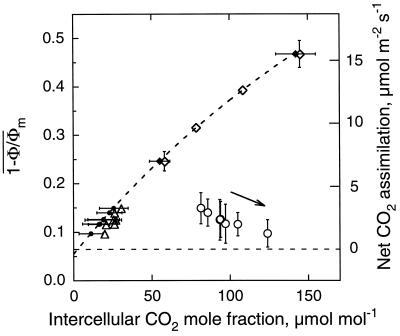
Figure 9 shows  and
An versus Ci
relationship in a control leaflet obtained in transient
nonphotorespiratory conditions (0.1% O2) before
addition of ABA under varying Ca. After ABA
treatment in air,
 determined in transient
O2-depleted air (0.1% O2)
markedly declined (by 70–80%), whereas Ci
was relatively less inhibited (circles in Fig. 9). This confirms the
well-documented departure from the control
An (and therefore
 ) versus
Ci relationship after ABA treatment as
usually reported in air (Farquhar and Sharkey, 1982; Mott, 1995). Such
a departure should not be expected for a limitation of
CO2 supply induced by stomatal closure only, as
evidenced in the previous section.
Figure 9.
Relationship between  and intercellular CO2 mole
fraction in 0.1% O2 before (⋄, ♦) and after (○, •,
Δ) ABA-treatment of a leaf of R. rubiginosa. (⋄,
○) are global Ci conventionally calculated
from gas exchange; (♦, •) are
C̄i calculated from the image
of Cii and (Δ) are Ci
predicted for gas exchange and calculated from
[(ḡt/1.6 −
Ē/2)Ca −
Ān]/[ḡt/1.6
+ Ē/2]. The experiment was the same as Figure 1.
Before the treatment, the relationship was obtained by varying the
external CO2 mole fraction. Fit was done according to
Equation 2 for data of global Ci (⋄). During
the treatment external CO2 was kept at 340 μmol
mol−1. The arrow indicates the temporal trend of the data
during the treatment. sds of
 and C̄i are
indicated by bars. The corresponding An scale,
computed from Equation 1 with k = 10.5 and
d = 0.055 and with An = A − R
and R = 0.35 μmol m−2
s−1, is shown on the right axis.
Figure 9 also shows the corresponding
C̄i calculated from the image of
Cii computed from images of (1 −
Φ/Φm)i assuming that
ABA treatment did not change the An and

 versus Ci control
relationship. Under the same assumptions, taking into account
heterogeneous distribution of stomatal conductance, another estimation
of global Ci we called
Ci predicted for gas exchange can be
derived from images of (1 −
Φ/Φm)i as
[(ḡt/1.6 −
Ē/2)Ca −
Ān]/[ḡt/1.6
+ Ē/2] (rearrangement of Eq. 3 with
Ān,
ḡt, and Ē computed
from images of Ani,
gti, and Ei,
respectively). In Figure 9, the Ci
predicted from these calculations are the
Ci values that should be obtained using
gas-exchange techniques if ABA solely induced heterogeneous stomatal
closure. This predicted value corresponds to the
Ci described by equation 30b in Farquhar
(1989), where Ci was simply modeled as
(Ca −
1.6Ān/ḡt)
(see also Meyer and Genty, 1995). The difference between
C̄i and the
Ci predicted for gas exchange was
rather small and the Ci predicted for gas
exchange remained substantially smaller than the global Ci
estimated from gas exchange (Fig. 9). Consequently, the ABA induced
large departure from control An versus
conventional Ci relationship could only be
partly explained by heterogeneity of stomatal closure.
DISCUSSION
In this study we interpreted the decline of photosynthesis after ABA treatment as having been caused by stomatal closure only. The short time scale of the reversion (within less than 1 min) of low assimilation rate under transient high-CO2 availability was the strongest indication that stomatal closure was determining the ABA-induced inhibition of photosynthesis. In our experimental conditions the reversion was always almost complete, such that a significant inhibition of metabolic capacity for photosynthesis caused by low-CO2 supply was unlikely to occur. The weak dependency of photosynthetic electron transport activity on O2 shown in air, before and after ABA treatment, provides further evidence for the maintenance of a fully competent photosynthetic apparatus. Thus, O2-dependent processes were able to drive almost as large a photochemical activity as before ABA treatment when maximal An occurred. Maintenance of Rubisco activity via O2 reduction by the glycolate pathway and reassimilation of evolved CO2 appears as a likely interpretation for such a response. A similar interpretation has been proposed to explain the occurrence of a large photochemical activity in water-stressed leaves (Cornic and Massacci, 1996).
By imaging PSII photochemical yield during a short transition to O2-depleted air, it was possible to accurately quantify the distribution of A, Ci, and gs. Thus, in our study, maximal deviation between Ān measured by gas exchange and Ān estimated by fluorescence imaging was 8%. Such a precision was a prerequisite for an accurate analysis of the significance of Ci.
Continuous frequency distributions of gs were always seen in contrast to reports of bimodal distributions observed using imaging of qN (Daley et al., 1989). Recently, Mott (1995) using a similar qN imaging also found no evidence for bimodal distribution after ABA treatment. However, in these two earlier studies no experimental basis was provided to characterize the diffusive or metabolic origin of the inhibition of photosynthetic activity induced by ABA treatment. A pure diffusive limitation is a prerequisite for the validity of the assumption used in these imaging studies: the relationship between fluorescence parameters An and Ci did not change during the experiment, which allowed the derivation of distributions of A, Ci, and gs from heterogeneous fluorescence images. In this context, it is important to note that an ABA treatment in O2-depleted air (Daley et al., 1989) and in air (Mott, 1995; present study) may provide different results (e.g. stomatal closure in O2-depleted air do not allow a maintenance of Rubisco and photochemical activities). This remark is also valid for many studies where long-term nonphotorespiratory conditions have been used to reveal a heterogeneous photosynthetic activity from fluorescence imaging (e.g. Raschke et al., 1990; Mott et al., 1993; Cardon et al., 1994; Genty and Meyer, 1995; Siebke and Weis, 1995). Equally important is the nonlinearity of the relationship between qN and A, gt, or Ci both in air and in nonphotorespiratory conditions, which warrants a correct quantification from straight interpretation of qN distribution. Thus, Mott (1995) noted that in air, qN was almost insensitive to Ci at Ci near the CO2 compensation point. Finally, leaf area probed by gas exchange and imaging may need to be identical for a valid quantification of heterogeneity, which was not the case in previous reports. A selective image of a small fraction of the leaf area may provide a different distribution pattern than an image of a whole leaf or leaflet.
From our comparative analysis of Ci predicted from imaging and global Ci estimated conventionally from gas exchange, it is clear that the large overestimation of Ci observed after ABA treatment can only be partly explained by heterogeneous stomatal closure, in contrast to conclusions of previous studies but in support of the modeling work of Cheeseman (1991) and Buckley et al. (1997). The remaining large difference between global and predicted Ci for gas exchange corresponded to a difference in E and gt of 58 ± 9 μmol m−2 s−1 and 3.3 ± 0.8 mmol m−2 s−1 for the data of Figure 9, respectively. A difference in gt of 5.6 ± 2.1 mmol m−2 s−1 was obtained for four experiments (gs of the control and ABA treated leaflet were 209 and 26 mmol m−2 s−1, respectively) (Table I). This difference agrees well with the value of cuticular water permeance given for leaves of trees (Kerstiens, 1995). Considering that cuticular conductance to CO2 is likely to be insignificant (Holmgren et al., 1965), this indicates that the main overestimation of Ci may result from cuticular transpiration, which is not taken into account in the usual calculation of leaf conductance to CO2 from total conductance to H2O. As cuticular transpiration occurred on both sides of the hypostomatous R. rubiginosa leaf, we estimated cuticular conductance as 2.8 ± 1.0 mmol m−2 s−1. Recent data have shown that in Vitis vinifera cuticular conductance to CO2 was measurable and was approximately 6% of cuticular conductance to H2O (Boyer et al., 1997). This indicates that the difference between global and predicted gt for gas exchange may slightly underestimate cuticular conductance to H2O. Water vapor adsorption by the leaf chamber and the sealing gaskets may also contribute to a residual water vapor net flux we interpreted as cuticular transpiration. However, this problem was minimized by coating the chamber and gaskets with Teflon and paraffin, respectively (maximal error due to water vapor adsorption and release from foam gaskets and walls of the leaf chamber was lower than 9% of the mean Δgt).
Table I.
Estimated mean difference of gt, Δgt, corresponding to the difference between global Ci and Ci predicted for gas exchange
| Δgt | gs Control | gs + ABA |
|---|---|---|
| mmol m−2 s−1 | ||
| 5.6 ± 2.1 | 209 ± 55 | 26.2 ± 9.5 |
For each measurement, Δgt was estimated as Δgt = (gt − ḡt). gs at steady state before (gs control) and after (gs + ABA) the treatment were also given. Mean values and sd are given for four experiments in nonphotorespiratory (0.1% O2). Leaf atmosphere contained 340 to 345 μmol mol−1 CO2 and 66 to 70% RH. The photon flux density was 385 to 420 μmol m−2 s−1. Maximal error due to water vapor adsorption and release from foam gaskets and walls of the leaf chamber was lower than 9% of the mean Δgt.
Reduction of stomatal pore size induced by ABA treatment may change the relationship between molecular diffusivity of water vapor and CO2 and offer an alternative explanation for a break of the relationship between stomatal conductance to water and CO2. However, this possibility is unlikely, since the ratio of conductance to water over the one to CO2 has been shown to remain close to the ratio of the free diffusion coefficient for a wide range of width of the stomatal pore (0.01–5 μm) and insensitive to the aperture-dependent change of the diffusion coefficients (Milthorpe and Penman, 1967).
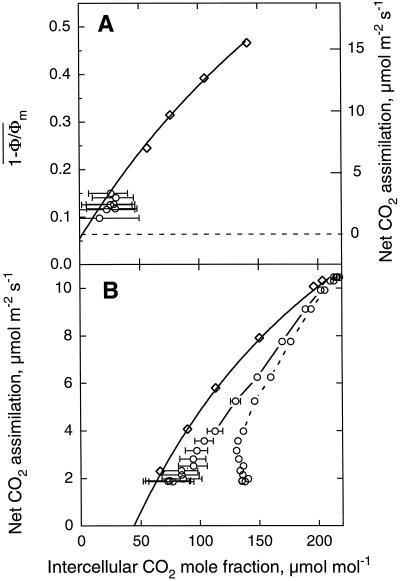
Figure 10 depicts the control relationship between An and Ci in nonphotorespiratory (A) and photorespiratory (B) conditions and shows the consequence of not taking into account the cuticular transpiration for the estimation of Ci during ABA treatment for the experiment of Figure 9. The overestimation of Ci resulted mainly from the occurrence of cuticular transpiration when most of the stomata were closed. However, during the early phase of ABA treatment in air when stomatal conductance remained high, heterogeneous stomatal closure was likely to be the only cause of this overestimation (Fig. 10B).
Figure 10.
Corrected relationship of  or An versus
intercellular CO2 mole fraction for cuticular transpiration
in nonphotorespiratory (A) and in photorespiratory (B) conditions
before (⋄) and after (○) ABA treatment. The experiment was the same
as Figure 9. Data were corrected for a cuticular conductance of
3.3 ± 0.8 mmol m−2 s−1 derived from the
difference between conventional Ci and
Ci predicted by
[(ḡt/1.6 −
Ē/2)Ca −
Ān]/[ḡt/1.6 + Ē/2]
(see Fig. 9). A, Fit was done according to Equation 2 for data of
global Ci (⋄). For indication, the
corresponding Ān scale, computed as in
Figure 9, is shown on the right axis. B, Fit was done according to
Farquhar et al. (1980) for data of global
Ci (⋄). Not corrected data obtained after ABA
treatment (○, dotted line) are also shown. Bars indicate the range of
Ci predicted for gas exchange for the range of
cuticular conductance between the mean values minus sd and
the mean values plus sd.
In conclusion, we show that both nonuniform stomatal closure and cuticular transpiration have to be taken into account to accurately predict Ci from gas-exchange measurements when stomatal conductance is low. Our data clearly show that after ABA treatment, heterogeneous decline of Ān results only from stomatal closure. In mildly water-stressed leaves where a maintenance of the full integrity of photosynthetic capacity remains questionable (see e.g. contradictory reports of Cornic and Massacci [1996] and Lauer and Boyer [1992]), our approach appears very promising for characterizing the significance of Ci and for separating stomatal from nonstomatal inhibition of photosynthesis.
ACKNOWLEDGMENTS
We thank F. Badeck for helpful comments and C. White for reading the manuscript.
Abbreviations:
- (1 − Φ/Φm)i
 , local and mean
ΦPSII
, local and mean
ΦPSII- A
Ai, Ā, An, Ani, Ān, global (conventional gas-exchange data), local (pixel value), and mean (spatial average) gross and net rate of CO2 assimilation, respectively
- Ca
ambient CO2 mole fraction inside the cuvette
- Ci
Cii, C̄i, global, local, and mean intercellular CO2 mole fraction
- E
Ei, Ē, global, local, and mean rate of transpiration
- gb
boundary layer conductance to H2O
- gs
gsi, ḡs, global, local, and mean stomatal conductance to H2O
- gt
gti, ḡt, global, local, and mean total conductance to H2O
- Φ
Φm, steady-state and maximal fluorescence yields
- ΦPSII
photochemical yield of PSII
- qN
nonphotochemical quenching of chlorophyll fluorescence
- Tl
Tli, T̄l, global, local, and mean leaf temperature
- wi
wii, w̄i, global, local, and mean intercellular mole fraction of water vapor
Footnotes
Funding for this project was provided by the Hasselblad Foundation.
LITERATURE CITED
- Boyer JS, Wong SC, Farquhar GD. CO2 and water vapor exchange across leaf cuticle (epidermis) at various water potentials. Plant Physiol. 1997;114:185–191. doi: 10.1104/pp.114.1.185. [DOI] [PMC free article] [PubMed] [Google Scholar]
- Bro E, Meyer S, Genty B. Heterogeneity of leaf CO2 assimilation during photosynthetic induction. Plant Cell Environ. 1996;19:1349–1358. ; erratum Bro E, Meyer S, Genty B (1997) Plant Cell Environ 20: 275–276. [Google Scholar]
- Buck AL. New equations for computing vapor pressure and enhancement factor. J Appl Meteor. 1981;20:1527–1532. [Google Scholar]
- Buckley TN, Farquhar GD, Mott KA. Qualitative effects of patchy stomatal conductance distribution features on gas-exchange calculations. Plant Cell Environ. 1997;20:867–880. [Google Scholar]
- Cardon ZG, Mott KA, Berry JA. Dynamics of patchy stomatal movements, and their contribution to steady-state and oscillating stomatal conductance calculated using gas-exchange techniques. Plant Cell Environ. 1994;17:995–1007. [Google Scholar]
- Cheeseman JM. PATCHY: simulating and visualizing the effects of stomatal patchiness on photosynthetic CO2 exchange studies. Plant Cell Environ. 1991;14:593–599. [Google Scholar]
- Cornic G, Massacci A. Leaf photosynthesis under drought stress. In: Baker N, editor. Photosynthesis and the Environment: Advances in Photosynthesis, Vol. 5. Dordrecht, The Netherlands: Kluwer Academic Publishers; 1996. pp. 347–366. [Google Scholar]
- Cummins WR, Kende H, Raschke K. Specificity and reversibility of the rapid stomatal response to abscisic acid. Planta. 1971;99:347–351. doi: 10.1007/BF00385826. [DOI] [PubMed] [Google Scholar]
- Daley PF, Raschke K, Ball JT, Berry JA. Topography of photosynthetic activity of leaves obtained from video images of chlorophyll fluorescence. Plant Physiol. 1989;90:1233–1238. doi: 10.1104/pp.90.4.1233. [DOI] [PMC free article] [PubMed] [Google Scholar]
- Downton WJS, Loveys BR, Grant WJR. Stomatal closure fully accounts for the inhibition of photosynthesis by abscisic acid. New Phytol. 1988a;108:263–266. doi: 10.1111/j.1469-8137.1988.tb04161.x. [DOI] [PubMed] [Google Scholar]
- Downton WJS, Loveys BR, Grant WJR. Non-uniform stomatal closure induced by water stress causes putative non-stomatal inhibition of photosynthesis. New Phytol. 1988b;110:503–509. [Google Scholar]
- Farquhar GD. Models of integrated photosynthesis of cells and leaves. Phil Trans R Soc Lond B. 1989;323:357–367. [Google Scholar]
- Farquhar GD, Sharkey TD. Stomatal conductance and photosynthesis. Annu Rev Plant Physiol. 1982;33:317–345. [Google Scholar]
- Farquhar GD, von Caemmerer S, Berry JA. A biochemical model of photosynthetic CO2 assimilation in leaves of C3 species. Planta. 1980;149:78–90. doi: 10.1007/BF00386231. [DOI] [PubMed] [Google Scholar]
- Genty B, Briantais JM, Baker NR. The relationship between the quantum yield of photosynthetic electron transport and quenching of chlorophyll fluorescence. Biochim Biophys Acta. 1989;990:87–92. [Google Scholar]
- Genty B, Harbinson J. Regulation of light utilization for photosynthetic electron transport. In: Baker N, editor. Photosynthesis and the Environment: Advances in Photosynthesis, Vol 5. Dordrecht, The Netherlands: Kluwer Academic Publishers; 1996. pp. 67–99. [Google Scholar]
- Genty B, Meyer S. Quantitative mapping of leaf photosynthesis using leaf chlorophyll fluorescence imaging. Aus J Plant Physiol. 1995;22:277–284. [Google Scholar]
- Graan T, Boyer JS. Very high CO2 partially restores photosynthesis in sunflower at low water potentials. Planta. 1990;181:378–384. doi: 10.1007/BF00195891. [DOI] [PubMed] [Google Scholar]
- Holmgren P, Jarvis PG, Jarvis MS. Resistances to carbon dioxide and water vapour transfer in leaves of different plant species. Physiol Plant. 1965;18:557–573. [Google Scholar]
- Kerstiens G. Cuticular water permeance of european trees and shrubs grown in polluted and unpolluted atmospheres, and its relation to stomatal response to humidity in beech (Fagus sylvatica L.) New Phytol. 1995;129:495–503. [Google Scholar]
- Laisk A, Oja V, Kull K. Statistical distribution of stomatal apertures of Vicia faba and Hordeum vulgare and the Spannungs-phase of stomatal opening. J Exp Bot. 1980;31:49–58. [Google Scholar]
- Lauer MJ, Boyer JS. Internal CO2 measured directly in leaves. Abscisic acid and low leaf water potential cause opposing effects. Plant Physiol. 1992;98:1310–1316. doi: 10.1104/pp.98.4.1310. [DOI] [PMC free article] [PubMed] [Google Scholar]
- Meyer S, Genty B. Mapping intercellular CO2 mole fraction (Ci) in Rosa leaf fed with ABA: significance of Ci estimated from leaf gas exchange. In: Mathis P, editor. Photosynthesis from Light to Biosphere, Vol IV. Dordrecht, The Netherlands: Kluwer Academic Publishers; 1995. pp. 603–606. [Google Scholar]
- Milthorpe FL, Penman HL. The diffusive conductivity of the stomata of wheat leaves. J Exp Bot. 1967;18:422–457. [Google Scholar]
- Mott KA. Effects of patchy stomatal closure on gas exchange measurements following abscisic acid treatment. Plant Cell Environ. 1995;18:1291–1300. [Google Scholar]
- Mott KA, Cardon ZG, Berry JA. Asymmetric patchy stomatal closure for the two surfaces of Xanthium strumarium L. leaves at low humidity. Plant Cell Environ. 1993;16:25–34. [Google Scholar]
- Ort DR, Oxborough K, Wise RR. Depressions of photosynthesis in crops with water deficits. In: Baker NR, Bowyer JR, editors. Photoinhibition of Photosynthesis, from Molecular Mechanisms to the Field. Oxford, UK: Bios Scientific Publishers; 1994. pp. 315–329. [Google Scholar]
- Parkinson KJ. Porometry. In: Marshall B, Woodward FI, editors. Instrumentation for Environmental Physiology. Cambridge, UK: Cambridge University Press; 1985. pp. 182–184. [Google Scholar]
- Parkhurst DF. Diffusion of CO2 and other gases inside leaves. New Phytol. 1994;126:449–479. doi: 10.1111/j.1469-8137.1994.tb04244.x. [DOI] [PubMed] [Google Scholar]
- Raschke K, Hedrich R. Simultaneous and independent effects of abscisic acid on stomata and the photosynthetic apparatus in whole leaves. Planta. 1985;163:105–118. doi: 10.1007/BF00395904. [DOI] [PubMed] [Google Scholar]
- Raschke K, Patzke J, Daley PF, Berry JA. Spatial and temporal heterogeneities of photosynthesis detected through analysis of chlorophyll-fluorescence images of leaves. In: Baltscheffsky M, editor. Current Research in Photosynthesis, Vol IV. Dordrecht, The Netherlands: Kluwer Academic Publishers; 1990. pp. 573–578. [Google Scholar]
- Seemann JR, Sharkey TD. The effect of abscisic acid and other inhibitors on photosynthetic capacity and the biochemistry of CO2 assimilation. Plant Physiol. 1987;84:696–700. doi: 10.1104/pp.84.3.696. [DOI] [PMC free article] [PubMed] [Google Scholar]
- Siebke K, Weis E. Assimilation images of leaves of Glechoma hederacea: analysis of non-synchronous stomata related oscillations. Planta. 1995;196:155–165. [Google Scholar]
- Terashima I (1992) Anatomy of non-uniform leaf photosynthesis. Photosynth Res 31, 195–212 [DOI] [PubMed]
- Terashima I, Wong SC, Osmond CB, Farquhar GD. Characterisation of non-uniform photosynthesis induced by abscisic acid in leaves having different mesophyll anatomies. Plant Cell Physiol. 1988;29:385–394. [Google Scholar]
- Van Kraalingen DWG. Implications of non-uniform stomatal closure on gas exchange calculations. Plant Cell Physiol. 1990;13:1001–1004. [Google Scholar]
- von Caemmerer, Farquhar GD. Some relationships between the biochemistry of photosynthesis and the gas exchange of leaves. Planta. 1981;153:367–396. doi: 10.1007/BF00384257. [DOI] [PubMed] [Google Scholar]
- Ward DA, Drake BG. Osmotic stress temporarily reverses the inhibitions of photosynthesis and stomatal conductance by abscisic acid: evidence that abscisic acid induces a localized closure of stomata in intact detached leaves. J Exp Bot. 1988;199:147–155. [Google Scholar]
- Wylie RB. The bundle sheath extensions in leaves of dicotyledons. Am J Bot. 1952;39:645–651. [Google Scholar]


