
Fig. 1.
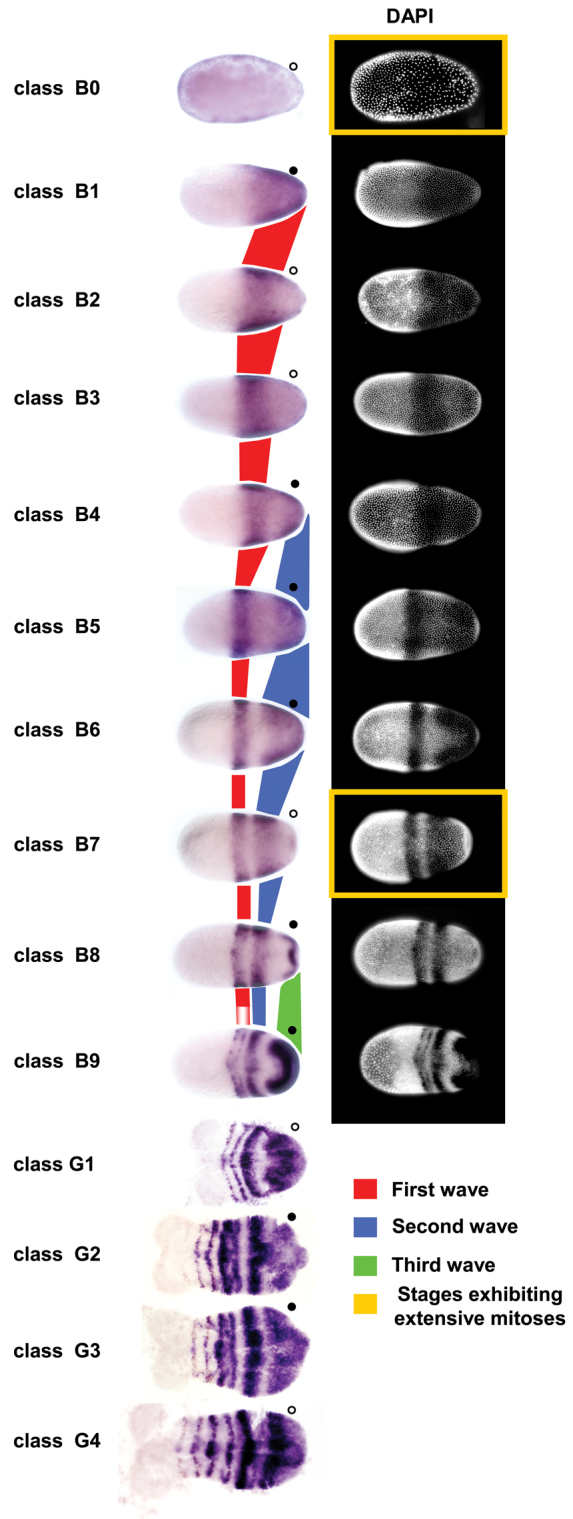
Waves of Tc-eve expression propagate from posterior to anterior in both blastoderm and germband stages of Tribolium development. Progression of Tc-eve expression from early blastoderm to early germband stages is shown. Classes B0-B9 (blastoderm stages) and G1-G4 (germband stages) represent distinct Tc-eve expression patterns, arranged in a putative temporal sequence (see Fig. 2). Propagation of the first three waves of Tc-eve expression is highlighted in red (first stripe), blue (second stripe) and green (third stripe). Tc-eve oscillation in the posterior end of the embryo is marked by circles; high expression levels are marked by filled circles, low levels by open circles. DAPI staining of blastoderm stages is shown on the right. Classes coinciding with extensive mitoses are enclosed in yellow rectangles. Anterior to the left.