Abstract
The aim of this study was to examine the temporal relationship between behaviorally measured visual thresholds, photoreceptor degeneration and dysfunction, synaptic and neuronal morphology changes in the retina in the S334ter line 4 rat. Specifically, we examined the optokinetic tracking (OKT) behavior in S334ter rats daily and found that OKT thresholds reflected normal values at eye-opening but quickly reduced to a non-response level by postnatal day (P) 22. By contrast, the scotopic electroretinogram (ERG) showed a much slower degeneration, with substantial scotopic function remaining after P90 as previously demonstrated for this line of rats. Photopic b-wave amplitudes revealed functional levels between 70 and 100% of normal between P30 and P90. Histological evidence demonstrated that photoreceptor degeneration occurred over many months, with an outer nuclear layer (ONL) roughly half the thickness of a normal age-matched control at P90. Immunohistochemical analysis revealed a number of changes in retinal morphology in the Tg S334ter line 4 rat that occur at or before P40 including: elevated levels of rod opsin expression in the ONL, cone photoreceptor morphology changes, glial cell activation, inner retinal neuron sprouting, and microglial cell activation. Many of these changes were evident at P30 and in some cases as early as eye opening (P15). Thus, the morphological changes occurred in concert with or before the very rapid loss of the behavioral (OKT) responses, and significantly before the loss of photoreceptors and photoreceptor function.
Keywords: rhodopsin, optokinetic tracking, transgenic, retinal degeneration, retinal remodeling
1. Introduction
Retinitis Pigmentosa (RP) is a collection of retinal degenerative diseases (RDD) in which an inherited genetic mutation results in the progressive death of photoreceptor cells leading to severe photoreceptor loss and subsequent permanent visual impairment. A popular model of RP used to examine retinal pigment epithelium (RPE) dysfunction is the Royal College of Surgeons (RCS) rat, which has been used extensively for functional, anatomical, and therapeutic studies. Indeed, numerous studies have shown that the RCS rat undergoes a progressive decay of photoreceptors and subsequent loss of visual function (DiLoreto et al., 1996; LaVail et al., 1975; McGill et al., 2004; McGill et al., 2007a; Mullen and LaVail, 1976; Perlman, 1978; Trejo and Cicerone, 1987). Although the RCS rat is a useful model for such studies, the patient population affected with the same MERTK gene mutation is relatively small, which limits the translation of research findings to clinical application.
Transgenic (Tg) rats have been developed that express a mutation encoding the rhodopsin protein and some of these mutations represent the largest patient population with autosomal dominant RP (Dryja et al., 1990a; Dryja et al., 1990b). In total, three P23H and five S334ter Tg lines have been developed, each with a different degree of transgene expression that results in vastly different rates of photoreceptor degeneration (http://www.ucsfeye.net/mlavailRDratmodels.shtml). The slowest degenerating lines maintain an outer nuclear layer (ONL) thickness similar to that of normal Long-Evans (LE) controls until 120 days of age or later (S334ter line 9; S334ter-9 hereafter), at which point photoreceptor death becomes more evident. Conversely, the early onset of photoreceptor degenerations are seen as an increase in the incidence of pyknotic photoreceptor nuclei in the ONL beginning at postnatal day 8 (P8), with many more present and obvious disorganization of photoreceptor inner segments at P10, just as photoreceptor outer segment development begins (Liu et al., 1999). Photoreceptor cell loss is then rapid, and only a single row of photoreceptor nuclei remains in the central retina at P20 (Liu et al., 1999), and no rod outer segments ever develop in the S334ter-3 rat (Liu et al., 1999; Martinez-Navarrete et al., 2011).
Previously, we have found that the optokinetic tracking (OKT) behavior in the lines of Tg rats is almost reciprocal to the daily rate of their photoreceptor degeneration. That is, the rapidly degenerating lines maintain OKT thresholds for months after loss of photoreceptor cells, and more slowly degenerating lines showed a reduction and loss of OKT threshold responses long before the loss of photoreceptor cells (McGill et al., Invest Ophthalmol Vis Sci 2007;48: E-Abstract 3448). Therefore, we asked the question of what changes in the retina occur that might cause the dramatic reduction of OKT thresholds before or during the photoreceptor degeneration. To address this issue in the present study, we have examined functional, anatomical, and morphological changes in the S334ter-4 Tg rat retinal prior to significant photoreceptor degeneration.
2. Materials and methods
2.1. Experimental animals
All animals were maintained in accordance with the NIH statement for the use of animals in research, and the research was approved by the Animal Care and Use Committees at the University of Lethbridge and University of California, San Francisco. The Tg S334ter rats were produced by Xenogen Biosciences (formerly Chrysalis DNX Tg Sciences, Princeton, NJ), with the support of the National Eye Institute and were supplied by Dr. Matthew LaVail, University of California San Francisco (http://www.ucsfeye.net/mlavailRDratmodels.shtml). Pigmented animals were required for this study because albino animals have significant visual deficits including significantly impaired OKT thresholds. Therefore, homozygous albino S334ter-4 rats were crossed with Long-Evans (LE) rats (Charles River) to produce pigmented heterozygous offspring used in this study.
2.2 Optokinetic Tracking (OKT)
In brief, S334ter and LE rats were placed on a platform in the center of an arena consisting of 4 computer monitors forming the faces of an open cube that displayed sine wave gratings as a virtual cylinder. Each animal’s daily maximal threshold was generated by incrementally increasing the spatial frequency until the rats no longer tracked the stimulus as described previously (Douglas et al., 2005; Prusky et al., 2004). The spatial frequency threshold of naïve adult LE rats is 0.53 cycles-per-degree (c/d) (Douglas et al., 2005; McGill et al., 2007b), which was used to generate percent of control values to describe the developmental pattern of OKT thresholds in the Tg rats.
2.3 Tissue Processing and Morphometry
Rats were killed with an overdose of carbon dioxide, then immediately perfused with a fixative of 2% paraformaldehyde and 2.5% glutaraldehyde in phosphate buffered saline. Both eyes were enucleated following marking for orientation and were immersed in the same fixative for 1 hour. The eyes were then bisected along the vertical meridian and embedded in an Epon-Araldite mixture, with sections cut at 1 μm thickness as described (LaVail and Battelle, 1975). Measurements of the ONL thickness were taken as an index of the stage of retinal degeneration (Michon et al., 1991), and were obtained from 54 locations around the retina (Faktorovich et al., 1992).
2.4 Electroretinography
The ERG procedure has been described previously (McGill et al., 2007b). Briefly, the rats were dark-adapted overnight and then, in dim red light, were anesthetized as described earlier. Bilateral, simultaneous, full-field scotopic ERGs were elicited with 10-μs flashes of white light, and responses were recorded with contact lens electrodes (UTAS-E 3000 Visual Electrodiagnostic System; LKC Technologies, Inc., Gaithersburg, MD). Scotopic stimuli were presented at an intensity of 0.4 log cd-s/m2 at 2-minute intervals, and the response to two successive flashes was averaged, followed by a single stimulus at 2.4 log cd-s/m2. The rats were then exposed to a background light of 29 cd/m2 for 10 minutes before photopic responses were recorded to stimuli presented at a rate of 2 Hz at 0.4 log cd-s/m2; 20 successive flashes were averaged. Responses were amplified at a gain of 4000, filtered between 0.3 and 500 Hz, and digitized at a rate of 2000 Hz on two channels. The amplitude of the a- and b-waves was measured. Scotopic a-waves were measured from the baseline to the peak in the cornea-negative direction in response to a stimulus of +2.4 log cd-s/m2, and the b-waves were measured from the cornea-negative peak to the major cornea positive peak in response to a stimulus of +0.4 log cd-s/m2.
2.5. Immunohistochemistry
Pigmented S334ter-4 rats (n=18; 3 at each age, P15, 20, 25, 30, 35, 40) and Long-Evans (LE) rats (n=18; 3 at each age, P15, 19, 25, 30, 35, 50) were euthanized using a lethal dose of sodium pentobarbital (120mg/kg). Eyes were enucleated and immersion-fixed in 4% paraformaldehyde for 24 hours at 4°C, at which time they were washed with 0.1 M Na-phosphate buffer, pH 7.2 and shipped to the University of California Santa Barbara. Upon arrival, the corneas and lenses were removed, and the eyecups rinsed in PBS, embedded in low-melt agarose (5%; Sigma, St Louis, MO), and sectioned at 100 μm using a vibratome (Technical Products International, Polysciences, Warrington, PA). Sections were incubated in normal donkey serum (1:20) in PBS containing 0.5% BSA, 0.1% Triton X-100, and 0.1% Azide (PBTA) overnight at 4°C on a rotator. After rinsing in PBTA, specific probes were added and incubated overnight at 4°C on a rotator in PBTA. A list of probes is found in Table 1. Following rinsing of the primary antibodies in PBTA, the secondary probes (Table 1) were added together, each at 1:200 in PBTA, overnight at 4°C on a rotator. The sections were then rinsed in PBTA, mounted on glass slides in 5% n-propyl gallate in glycerol, and viewed on an Olympus Fluoview 500 laser scanning confocal microscope (Center Valley, PA). Each image represents a projection from a z-stack of 6–10 images collected at 0.5-μm increments. Images were opened in Photoshop CS2 for study. (Adjustments to image parameters were applied equally to images from control and experimental animals.).
Table 1.
Primary and secondary antibodies.
| Antibody | species | concentration | source |
|---|---|---|---|
| Rod opsin | mouse | 1 to 100 | Gift from Dr. Robert Molday, UBC |
| Chat | goat | 1 to 50 | Chemicon, Temcula, CA |
| Neurofilament | rabbit | 1 to 400 | Chemicon, Temcula, CA |
| PDE gamma | rabbit | 1 to 100 | Cytosignal, Irvine, CA |
| Calbindin | mouse | 1 to 1000 | Abcam, Cambridge, MA |
| Synaptophysin | rabbit | 1 to 400 | Dako, Carpinteria, CA |
| PKC beta | mouse | 1 to 50 | Santa Cruz Biotech |
| GFAP | rabbit | 1 to 400 | Dako, Carpinteria, CA |
| Vimentin | mouse | 1 to 500 | Dako, Carpinteria, CA |
| CtBP2 (ribeye) | mouse | 1 to 250 | BD Transduction labs, San Jose, CA |
| Biotinlyated lectins | |||
| PNA | 1 to 200 | Vector Labs, Burlingame, CA | |
| Isolectin B4 | 1 to 50 | Vector Labs | |
| Secondary Antibodies | |||
| Donkey anti-mouse, anti-rabit, anti-goat conjugated to either Cy2, Cy3 or Cy 5 | |||
| Streptavidin conjugated to either Cy2, Cy3, or Cy5 (to detect biotinylated lectins) | |||
| All from Jackson ImmunoResearch, West Grove, PA | |||
| All used at 1 to 200 concentration | |||
| Blocking serum (normal donkey serum), 1 to 20, JacksonImmunoResearch | |||
3. Results
3.1) Tg Rhodopsin mutation – S334ter-4
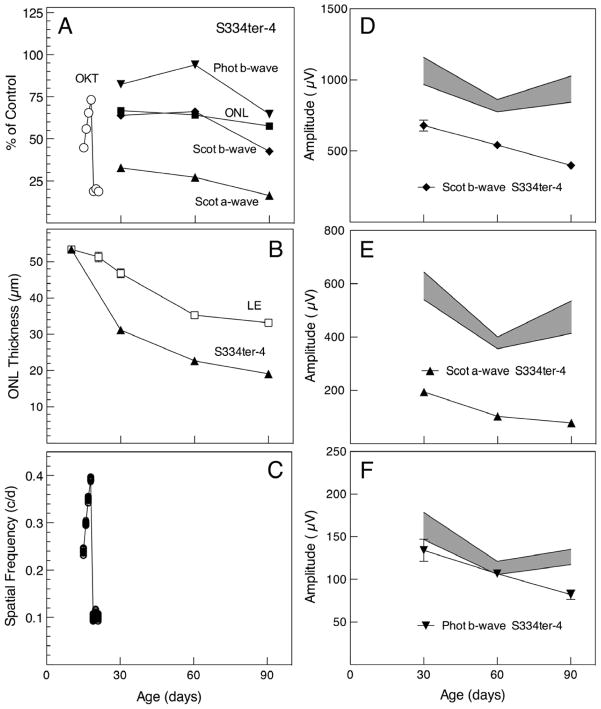
The rate of photoreceptor degeneration in the pigmented S334ter-4 rat has been described elsewhere [Leonard, 2007 #1117; http://www.ucsfeye.net/mlavailRDratmodels.shtml], and the rate of degeneration, as measured by ONL thickness, was virtually identical to those published values. Briefly, by P30, ONL thickness was approximately 65% of age-matched non-dystrophic LE controls and decreased to 60% by P90 (Figs. 1A, B). Scotopic ERG b-wave amplitudes followed ONL thickness closely (Figs. 1A, D). Scotopic a-wave amplitudes were significantly reduced from ~30% of normal control values at P30 down to ~10% by P90 (Figs. 1A, E). Photopic b-wave amplitudes ranged from ~80% to almost 100% of control values at P30 and P60, respectively, subsequently declining to ~70% by P90 (Figs. 1A, F). By contrast, daily testing of behavioral OKT thresholds that began at eye opening (P15) (Figs. 1A, C) revealed a developmental pattern similar to that observed in LE rats (Prusky et al., 2008), but by P19, OKT thresholds declined sharply to a near unmeasurable level, and S334ter-4 rats no longer tracked the rotating stimulus after P22 (Figs. 1A, C). The absolute values of the ONL, OKT and ERG measurements are given in Figs. 1B, C, and D–F, respectively.
Figure 1.
Quantification of S334ter-4 OKT thresholds, ONL thickness and ERG response amplitudes. (A) Mean values expressed as percent of control mean. OKT thresholds (open circles) measured daily increased from P15 to P19, as expected with retinal development. However, they fell dramatically thereafter, and were no longer measurable after P22. ONL thickness (solid squares) shows a relatively slow degeneration resulting in decline from ~65% to 60% of normal thickness from P30–P90. Scotopic ERG b-wave amplitudes (solid diamonds) were reduced from normal closely resembling the ONL thickness, while scotopic a-waves (solid triangles) were severely impaired, only ~30% of normal at P30 declining to less than 20% by P90. Photopic ERG b-waves (inverted solid triangles) were least impaired, ranging from ~80% to almost 100% of control at P30 and P60, declining to about 65–70% of control at P90. (B) ONL thickness. In this and the remaining panels, the data are shown as mean ± SEM; the variance was so small in many of the values that the error bars fell within the symbols. Unless indicated n = 4 in every case. The ONL thickness reflected the loss of photoreceptor cells in the S334ter-4 animals and was significantly thinner than in the Long-Evans (LE) wild-type control rats (each P<1 × 10⁻⁵). (C) OKT measurements from each eye of 6 rats tested daily from P15–P22 (open circles). Many of the values were so close to one another that the symbols overlapped. The error bars are smaller than the symbols and therefore are not visible. The line represents the mean. (D–F) ERG response amplitudes to stimulus intensities of 0.4 log cd sec/m2 for dark-adapted b-wave (D) and light-adapted b-wave (F), and 2.4 log cd sec/m2 for dark-adapted a-wave (E). The shaded areas are the mean ± SEM of normal control (LE) values. All of the scotopic responses from the mutant S334ter-4 rats were significantly lower than those of LE controls, as were those for the photopic b-wave at P90 (all P<0.005), but the photopic b-wave responses at P30 and P60 were not different from those of the controls.
3.2) Photoreceptors
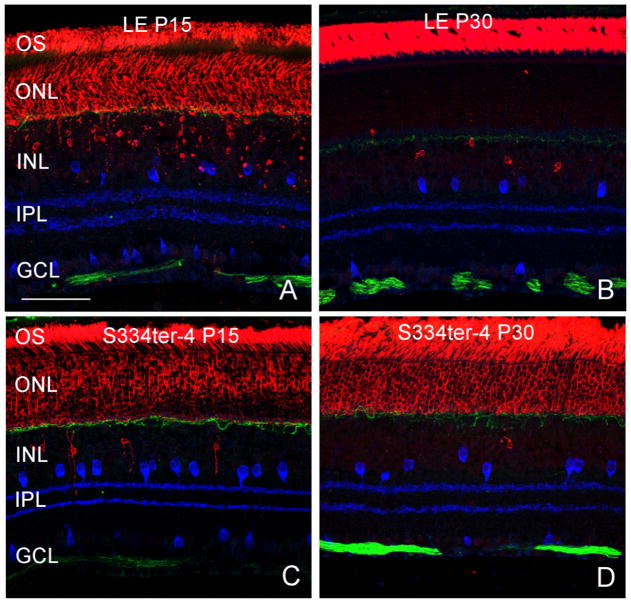
Rod photoreceptor OS of both LE and S334ter-4 rats stained strongly for rod opsin (Rho-4D2, gift from Dr. Robert Molday) at both P15 and P30 (Fig. 2; Red). At P15, rod opsin also stained the photoreceptor cell bodies in the ONL in both LE and S334ter-4 animals as well as an occasional cell body in the inner nuclear layer (INL; Figs. 2A, C). These displaced rod photoreceptors are most likely the result of the normal developmental pattern (Johnson et al., 1999). By P30 in LE rats, rod opsin staining was primarily localized to the OS with the exception of the occasional positively stained cell in the ONL and INL (Fig. 2B). By contrast, rod opsin staining was still present in the ONL in S334-4 rats by P30.
Figure 2.
LE controls and S334ter-4 rats at P15 and P30. Rod Opsin (red) was expressed throughout the ONL and occasionally in the INL in both LE and S334ter rats at P15 (Fig. 2A, C). By P30, expression of rod opsin was localized only to the OS in the LE rat (Fig. 2B), however, in the S334ter-4 rats, rod opsin did not localize to the ONL (Fig. 2D). Amacrine cells (blue, Chat) were unremarkable. Neurofilament antibody was present in horizontal cell processes (Green) and ganglion cell axons in the optic fiber layer. No differences in these cells were observed between normal and Tg S334-4 retinas from P15 to P30. Scale bar: 50 μm.
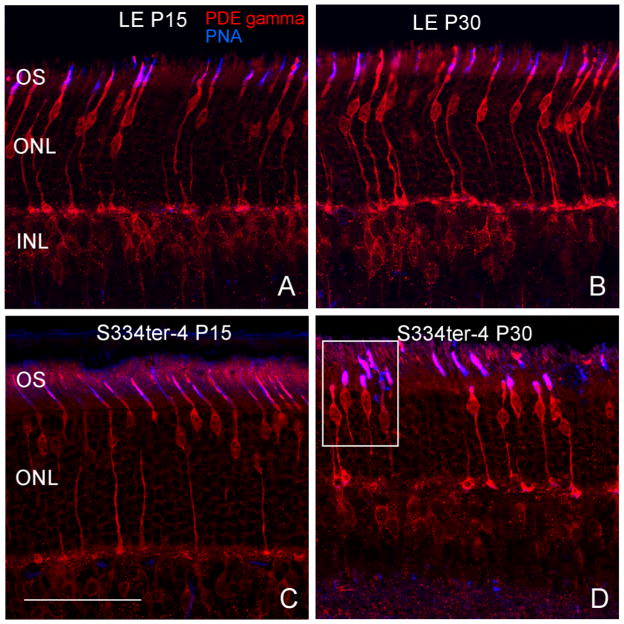
Cone photoreceptor survival was examined through immunohistochemistry: cones were double-labeled with antibodies against phosphodiesterase (PDE) gamma and peanut agglutinin (PNA; biotinylated). PDE stains the entire cone profile, while PNA primarily only stains cone matrix sheaths. In the normal LE retina, there were no obvious changes in the thickness of the ONL, cone number, or cone OS length from P15 to P30 (Fig. 3A, B). At P15, Tg retinas were similar to LE retinas (Fig. 3C). At P30, Tg retinas exhibited marked differences in cone structure. The thickness of the ONL and overall length of the cone photoreceptors appeared reduced. Cone OS were much more disorganized, tortuous, and reduced in length (Fig. 3D, white box).
Figure 3.
Cone photoreceptors were double-labeled with antibodies against phosphodiesterase (PDE) gamma and peanut agglutinin (PNA; biotinylated). In the normal LE retina at P15 and P30 and the Tg retinas at P15, there were no obvious changes in the thickness of the ONL, cone number, or apparent cone OS length (Figs. 3A, B, C). At P30, Tg retinas (Fig. 3D) exhibited marked differences in cone structure: the thickness of the ONL and overall length of the cone photoreceptors appeared shortened, and the cone OS were much more disorganized, tortuous, and in some cases absent as highlighted within the white square. Scale bar: 50 μm.
3.3) Inner retinal neurons
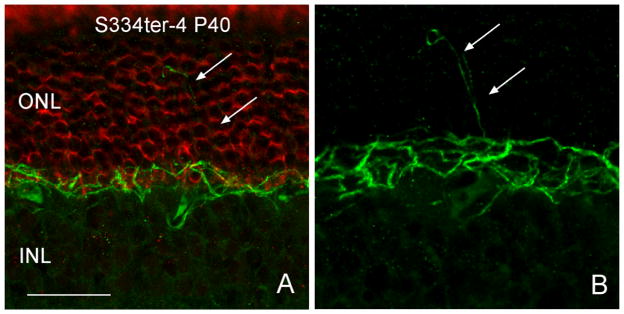
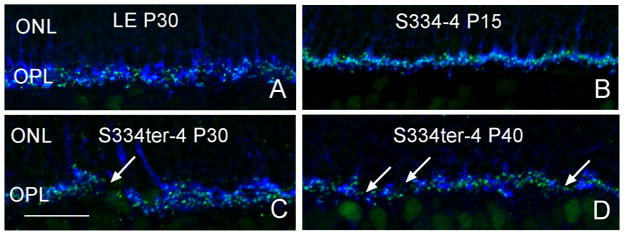
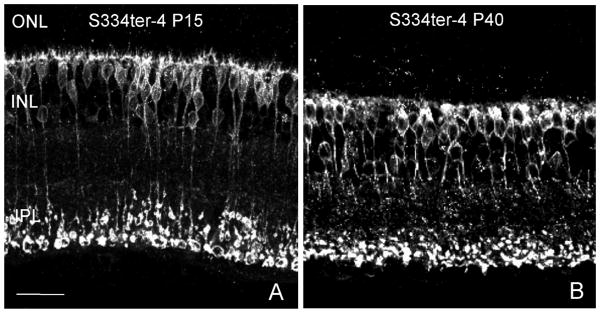
Cholinergic amacrine cells are stained in both the normal and Tg retina by the ChAT antibody (Fig 2; Blue). The cells form two mirror symmetric populations of neurons in the inner nuclear layer (INL) and ganglion cell layer (GCL; (Strettoi and Volpini, 2002)) and do not exhibit sprouting of neurites from P15 to P30 in either the normal or Tg retina. Anti-neurofilament labeling of horizontal cell processes (Fig. 2; Green) and ganglion cell axons appeared identical in control and Tg S334-4 retinas at P15 and P30, however, by P40, horizontal cells exhibited extensive outgrowths into the ONL in the Tg animals (Fig. 4). Anti-CtBP2 and -synaptophysin, which stain synaptic ribbons and synaptic terminals, respectively, showed some disorganization of synaptic proteins at the junction of the ONL and outer plexiform layer (OPL) and gaps in staining in the OPL in the Tg retina. This pattern became more prominent as the animals aged (Fig. 5C, D, arrows). Anti PKC beta positive bipolar cells, exhibited normal morphology with the exception of minor attenuation of bipolar cell dendrites (Fig. 6B).
Figure 4.
Horizontal cells (Neurofilament, green) exhibit outgrowth (arrows in B) from the outer plexiform layer into the ONL by P40. Scale bar: 20 μm.
Figure 5.
Synaptic makers CtbP2 (green) and synaptophysin (blue). Disorganization of synaptic proteins at the junction of the ONL and OPL in Tg retina compared to the normal retina by P30 (Fig. 5), which occurs more frequently as the animals aged (Fig. 5C, D). Arrows indicate gaps in labeling. Scale bar: 20 μm.
Figure 6.
Attenuation of dendrites in Anti-PKC positive bipolar cells. Scale bar: 20 μm.
3.4) Müller Cells and microglia
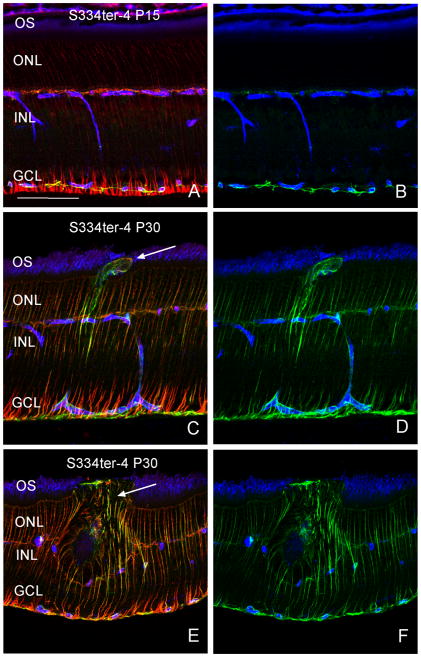
In the LE retina, anti-glial fibrillary acidic protein (GFAP), stains only astrocytes, whereas anti-vimentin staining, is present primarily in Müller cells (data not shown; (Luna et al., 2010)). In degenerating retinas, increased expression of both GFAP and vimentin are evident (Jones and Marc, 2005; Jones et al., 2003). Here, at P15 in Tg retinas, Müller cells exhibit normal expression of GFAP and vimentin (Fig. 7A, B). However, at P30, both proteins were upregulated in Müller cells, and outgrowths from Müller cells often were observed extending past the outer limiting membrane into the OS layer (Fig. 7C, D, arrow). The hypertrophy of these cells can disrupt normal retinal architecture, ultimately causing the disruption of photoreceptors in the immediate area (Fig. 7E, arrow).
Figure 7.
Glial cell activation. Panels B, D, and F are identical to A, C, and E, respectively, with the red channel removed. At P15 in Tg retinas, Müller cells show little evidence of activation with either GFAP (green) or Vimentin (red; Fig. 6A, B). However, at P30, both proteins were upregulated in Müller cells and often outgrowths from Müller cells were observed extending past the outer limiting membrane into the OS layer (Fig. 6C, D, arrow). A glial scar is observed (Fig. 6E, F, arrow). Scale bar: 100 μm.
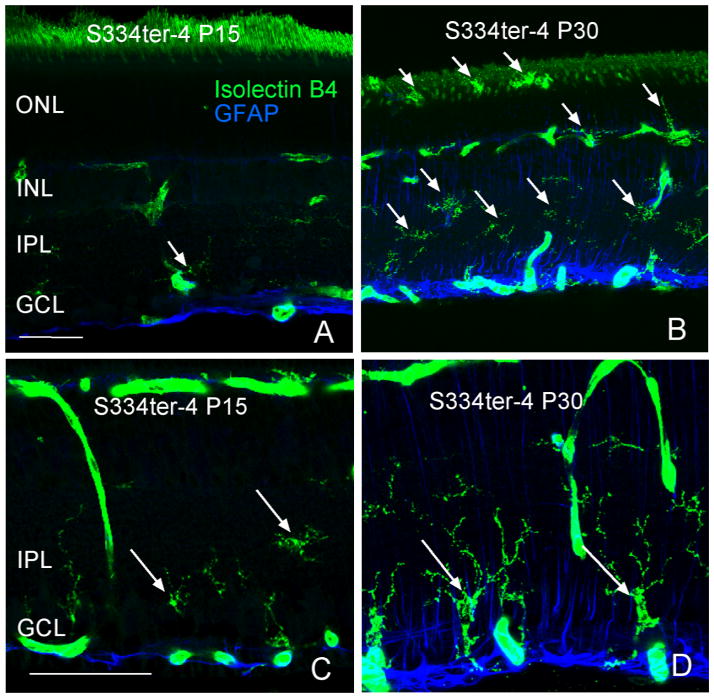
Isolectin B4 stained microglia in retinal sections at P15, and P30. At P15, some microglia are present in the IPL (Fig. 8A). By P30, the size of the microglia cell bodies appears to have increased (Fig. 8B).
Figure 8.
Arrows indicate positively stained (Isolectin B4), activated microglia throughout the retina. Microglia increased both in number and size from P15 to P30. Scale bar: 50 μm.
4. Discussion
The data reported here show a number of morphological changes that occur early in the degeneration profile of the Tg S334ter-4 rhodopsin mutant rat. These changes include mis-localization of the rod opsin protein, disorganization and shortening of the photoreceptor OS, occasional sprouting of horizontal cell neurites, abnormal expression pattern of synaptic proteins such as synaptophysin and CtbP2 likely due to a loss of terminals, and activation of Müller glial cells. These morphologic changes occur concurrently with the drastic decline in OKT thresholds, while ERG responses remain near the higher, expected values given the relatively slow rate of photoreceptor degeneration.
Previous studies using models of retinal degeneration have reported discordant anatomical, functional, and behavioral measurements. For example, behavioral studies that examined Royal College of Surgeons (RCS) rat vision report visual acuity measured long after significant photoreceptor degeneration has occurred (McGill et al., 2004; McGill et al., 2007a). Specifically, in the Visual Water Task, visual acuity was measured at ~0.5 cpd (50% of non-dystrophic value)(McGill et al., 2004) and OKT thresholds remained at 0.300 cpd (~60% of non-dystrophic values) (McGill et al., 2007b) at P90, an age at which the ONL is reduced to 1 or fewer photoreceptor cell nuclei in these rats (Cuenca et al., 2005; LaVail and Battelle, 1975). In addition, acuity measurements in both tasks have been measured up to ~300 days of age, despite the highly pathological state of the retina. Visual stimuli in both tasks were generated with average luminance levels bright enough to saturate rod photoreceptors, indicating that the thresholds are likely a reflection of the function of remaining cone photoreceptors. Photopic flicker ERG waves in RCS rats can be measured up to P200 suggesting that some cones remain in the retina, and retain some function at late ages (Pinilla et al., 2005). The fact that vision measured in the RCS rat using behavioral tasks extends beyond ages at which electrophysiological responses are elicited, suggests that behavioral assessments of vision are perhaps more sensitive than current electrophysiological techniques. This pattern has also been described in S334ter line 3 rats. Sagdullaev et al. (2003) reported that by P28, photoreceptor cell death is nearly complete in the central retina, and multi-unit recordings from a corresponding area of the superior colliculus (SC) are non-responsive. By P63, the entire SC was non-responsive (Sagdullaev et al., 2003), however, Thomas et al. (2004) reported OKT at P205 in the same line. In the present study, however, despite the changes in cone morphology and substantial photopic ERG b-wave amplitude values, minimal cone function is lost before P60, indicating that cone function, or the lack thereof, is not responsible for the lack of OKT thresholds beyond P22 in the S334ter line 4 rat.
Numerous studies have examined inner retinal changes that occur during retinal degeneration. Martinez-Navarrete et al. (2011) report the retraction of rod bipolar cells dendrites forming clusters along the OPL in both S334ter-3 and S334ter-5 rats. Similarly, P23H-1 rats (Cuenca et al., 2004) and rd10 mice (Barhoum et al., 2008) have been observed to express these same bipolar cell changes at P270 and P30, respectively. In this study, it appeared that there was some attenuation of bipolar cell dendrites, but not to the extent observed in previous studies with other models. Horizontal cell processes diminish between P11 and P30 in both line 3 and 5 (Martinez-Navarrete et al., 2011) and horizontal cell density is decreased by P60 in line 3 (Ray et al., 2010). Here, we found that horizontal cells exhibit process outgrowth by P40, but these outgrowths were not evident at earlier ages (data not shown). We did not see evidence of horizontal cell death or a decrease in horizontal cell density, although we did not quantify this as done in previous studies. In the present study, the horizontal cell process outgrowth is observed at an age where the retina retains more than 60% of normal photoreceptor counts suggesting that these changes are more likely to occur concurrent with advanced photoreceptor degeneration. Martinez-Navarrete et al. (2011) also report that in both S334ter-3 and S334ter-5 rats, synaptic terminals were different from controls as early as P11-13, and by P30, clear synaptic terminals were difficult to recognize in the mutant retinas. Furthermore, they found that at P60, gaps exist in the OPL of both lines, and by P90 no synaptic terminal exist (Martinez-Navarrete et al., 2011). In the present study, we also found differences in synaptic terminals, which became more evident with age, consistent with previous reports.
Several hypotheses have been put forward for the role of activated microglia in degenerating retinas. While it is generally presumed that activation of microglia benefits surviving cells by removing debris that may be toxic, recent evidence suggests that activated microglia may be detrimental to central nervous system neuron survival ((Langmann, 2007); for review). Indeed, it has been shown that media taken from microglial cell cultures kills photoreceptors (Roque et al., 1999), while inhibiting the activation of microglia slows photoreceptor degeneration in the RCS rat (Glybina et al., 2009). Finally, microglia are known to secrete molecules such as proteases, pro-inflammatory cytokines, tumor necrosis factor, and nitric oxide, all of which can kill neurons and presumably lead to reduced visual acuity (Langmann, 2007; Ma and Streilein, 1999; Ng and Streilein, 2001; Thanos, 1992).
The cause of the dramatic decline in OKT thresholds at ~P20 remains unclear. The relatively minor degree of reorganization of retinal neurons, minimal cone photoreceptor cell loss, and retained photopic ERG function suggest that the cause might not be retina specific. Prusky et al., (2008) report that repeated testing of OKT thresholds from eye opening through P25 in LE rats can engage visual system plasticity that is cortex dependent, enhancing OKT thresholds above that of naïve rats. Monocular deprivation (MD) during this period causes function measured through both eyes to decline sharply to sub-naïve rat levels after the MD is removed. Bilateral visual cortex ablation in these same animals at P30 restores thresholds measured through the deprived eye to naïve levels, indicating that the cortex can actively inhibit OKT thresholds. In addition, a dramatic loss of function in the non-deprived eye can be observed when early OKT experience is combined with MD and the MD is removed restoring binocular vision (Tschetter et al., 2010. SFN abstract 739.6). The mechanism of visual cortex mediated enhancement and suppression of OKT thresholds is not yet elucidated but may help explain the unique OKT results observed in the present study.
4. Conclusion
This report describes changes in visual thresholds and retinal morphology in the Tg S334ter-4 rat that occur prior to photoreceptor degeneration in this model; changes in cell morphology occurred as early as P30, and in some cases as early as eye opening (P15). These morphological changes occurred in concert with, or before rapid loss of the behavioral (OKT) responses and significantly before the loss of photoreceptors and photoreceptor function.
Highlights.
We characterized retinal function and morphology in the transgenic rhodopsin mutant S334ter line 4 rat.
We examined changes in retinal neuronal cell morphology measured immunohistochemically.
Visual function (OKT) did not correlate well with retinal function (ERG) or retinal morphology.
Changes in retinal neurons and glial cells occur in concert with, or before decline in OKT thresholds is observed.
Acknowledgments
Support: This study was supported by NIH grants EY001919, EY006842, EY002162; and the Foundation Fighting Blindness; an Unrestricted Grant from Research to Prevent Blindness Foundation; Fighting Blindness Canada; Knights Templar Eye Foundation; and NSF grants 0941717 and IIS-0808772. The authors acknowledge Nazia Alam, Wayne Tschetter, Douglas Yasumura, and Michael T. Matthes for their efforts on this project.
Footnotes
Publisher's Disclaimer: This is a PDF file of an unedited manuscript that has been accepted for publication. As a service to our customers we are providing this early version of the manuscript. The manuscript will undergo copyediting, typesetting, and review of the resulting proof before it is published in its final citable form. Please note that during the production process errors may be discovered which could affect the content, and all legal disclaimers that apply to the journal pertain.
Literature cited
- Barhoum R, Martinez-Navarrete G, Corrochano S, Germain F, Fernandez-Sanchez L, de la Rosa EJ, de la Villa P, Cuenca N. Functional and structural modifications during retinal degeneration in the rd10 mouse. Neuroscience. 2008;155:698–713. doi: 10.1016/j.neuroscience.2008.06.042. [DOI] [PubMed] [Google Scholar]
- Cuenca N, Pinilla I, Sauve Y, Lu B, Wang S, Lund RD. Regressive and reactive changes in the connectivity patterns of rod and cone pathways of P23H transgenic rat retina. Neuroscience. 2004;127:301–317. doi: 10.1016/j.neuroscience.2004.04.042. [DOI] [PubMed] [Google Scholar]
- Cuenca N, Pinilla I, Sauve Y, Lund R. Early changes in synaptic connectivity following progressive photoreceptor degeneration in RCS rats. The European journal of neuroscience. 2005;22:1057–1072. doi: 10.1111/j.1460-9568.2005.04300.x. [DOI] [PubMed] [Google Scholar]
- DiLoreto D, Jr, del Cerro M, Reddy SV, Janardhan S, Cox C, Wyatt J, Balkema GW. Water escape performance of adult RCS dystrophic and congenic rats: a functional and histomorphometric study. Brain research. 1996;717:165–172. doi: 10.1016/0006-8993(96)00095-9. [DOI] [PubMed] [Google Scholar]
- Douglas RM, Alam NM, Silver BD, McGill TJ, Tschetter WW, Prusky GT. Independent visual threshold measurements in the two eyes of freely moving rats and mice using a virtual-reality optokinetic system. Vis Neurosci. 2005;22:677–684. doi: 10.1017/S0952523805225166. [DOI] [PubMed] [Google Scholar]
- Dryja TP, McGee TL, Hahn LB, Cowley GS, Olsson JE, Reichel E, Sandberg MA, Berson EL. Mutations within the rhodopsin gene in patients with autosomal dominant retinitis pigmentosa. The New England journal of medicine. 1990a;323:1302–1307. doi: 10.1056/NEJM199011083231903. [DOI] [PubMed] [Google Scholar]
- Dryja TP, McGee TL, Reichel E, Hahn LB, Cowley GS, Yandell DW, Sandberg MA, Berson EL. A point mutation of the rhodopsin gene in one form of retinitis pigmentosa. Nature. 1990b;343:364–366. doi: 10.1038/343364a0. [DOI] [PubMed] [Google Scholar]
- Faktorovich EG, Steinberg RH, Yasumura D, Matthes MT, LaVail MM. Basic fibroblast growth factor and local injury protect photoreceptors from light damage in the rat. J Neurosci. 1992;12:3554–3567. doi: 10.1523/JNEUROSCI.12-09-03554.1992. [DOI] [PMC free article] [PubMed] [Google Scholar]
- Glybina IV, Kennedy A, Ashton P, Abrams GW, Iezzi R. Photoreceptor neuroprotection in RCS rats via low-dose intravitreal sustained-delivery of fluocinolone acetonide. Investigative ophthalmology & visual science. 2009;50:4847–4857. doi: 10.1167/iovs.08-2831. [DOI] [PubMed] [Google Scholar]
- Johnson PT, Williams RR, Cusato K, Reese BE. Rods and cones project to the inner plexiform layer during development. The Journal of comparative neurology. 1999;414:1–12. [PubMed] [Google Scholar]
- Jones BW, Marc RE. Retinal remodeling during retinal degeneration. Experimental eye research. 2005;81:123–137. doi: 10.1016/j.exer.2005.03.006. [DOI] [PubMed] [Google Scholar]
- Jones BW, Watt CB, Frederick JM, Baehr W, Chen CK, Levine EM, Milam AH, Lavail MM, Marc RE. Retinal remodeling triggered by photoreceptor degenerations. The Journal of comparative neurology. 2003;464:1–16. doi: 10.1002/cne.10703. [DOI] [PubMed] [Google Scholar]
- Langmann T. Microglia activation in retinal degeneration. J Leukoc Biol. 2007;81:1345–1351. doi: 10.1189/jlb.0207114. [DOI] [PubMed] [Google Scholar]
- LaVail MM, Battelle BA. Influence of eye pigmentation and light deprivation on inherited retinal dystrophy in the rat. Experimental eye research. 1975;21:167–192. doi: 10.1016/0014-4835(75)90080-9. [DOI] [PubMed] [Google Scholar]
- LaVail MM, Sidman RL, Gerhardt CO. Congenic strains of RCS rats with inherited retinal dystrophy. The Journal of heredity. 1975;66:242–244. doi: 10.1093/oxfordjournals.jhered.a108621. [DOI] [PubMed] [Google Scholar]
- Liu C, Li Y, Peng M, Laties AM, Wen R. Activation of caspase-3 in the retina of transgenic rats with the rhodopsin mutation s334ter during photoreceptor degeneration. J Neurosci. 1999;19:4778–4785. doi: 10.1523/JNEUROSCI.19-12-04778.1999. [DOI] [PMC free article] [PubMed] [Google Scholar]
- Luna G, Lewis GP, Banna CD, Skalli O, Fisher SK. Expression profiles of nestin and synemin in reactive astrocytes and Muller cells following retinal injury: a comparison with glial fibrillar acidic protein and vimentin. Mol Vis. 2010;16:2511–2523. [PMC free article] [PubMed] [Google Scholar]
- Ma N, Streilein JW. T cell immunity induced by allogeneic microglia in relation to neuronal retina transplantation. J Immunol. 1999;162:4482–4489. [PubMed] [Google Scholar]
- Martinez-Navarrete G, Seiler MJ, Aramant RB, Fernandez-Sanchez L, Pinilla I, Cuenca N. Retinal degeneration in two lines of transgenic S334ter rats. Experimental eye research. 2011;92:227–237. doi: 10.1016/j.exer.2010.12.001. [DOI] [PMC free article] [PubMed] [Google Scholar]
- McGill TJ, Douglas RM, Lund RD, Prusky GT. Quantification of spatial vision in the Royal College of Surgeons rat. Investigative ophthalmology & visual science. 2004;45:932–936. doi: 10.1167/iovs.03-0964. [DOI] [PubMed] [Google Scholar]
- McGill TJ, Lund RD, Douglas RM, Wang S, Lu B, Silver BD, Secretan MR, Arthur JN, Prusky GT. Syngeneic Schwann cell transplantation preserves vision in RCS rat without immunosuppression. Investigative ophthalmology & visual science. 2007a;48:1906–1912. doi: 10.1167/iovs.06-1117. [DOI] [PubMed] [Google Scholar]
- McGill TJ, Prusky GT, Douglas RM, Yasumura D, Matthes MT, Nune G, Donahue-Rolfe K, Yang H, Niculescu D, Hauswirth W, Girman S, Lund R, Duncan JL, LaVail MM. Intraocular CNTF Reduces Vision in Normal Rats in a Dose-Dependent Manner. Investigative ophthalmology & visual science. 2007b;48:5756–5766. doi: 10.1167/iovs.07-0054. [DOI] [PubMed] [Google Scholar]
- Michon JJ, Li ZL, Shioura N, Anderson RJ, Tso MOM. A comparative study of methods of photoreceptor morphometry. Investigative ophthalmology & visual science. 1991;32:280–284. [PubMed] [Google Scholar]
- Mullen RJ, LaVail MM. Inherited retinal dystrophy: primary defect in pigment epithelium determined with experimental rat chimeras. Science (New York, NY. 1976;192:799–801. doi: 10.1126/science.1265483. [DOI] [PubMed] [Google Scholar]
- Ng TF, Streilein JW. Light-induced migration of retinal microglia into the subretinal space. Investigative ophthalmology & visual science. 2001;42:3301–3310. [PubMed] [Google Scholar]
- Perlman I. Dark-adaptation in abnormal (RCS) rats studied electroretinographically. The Journal of physiology. 1978;278:161–175. doi: 10.1113/jphysiol.1978.sp012298. [DOI] [PMC free article] [PubMed] [Google Scholar]
- Pinilla I, Lund RD, Lu B, Sauve Y. Measuring the cone contribution to the ERG b-wave to assess function and predict anatomical rescue in RCS rats. Vision research. 2005;45:635–641. doi: 10.1016/j.visres.2004.09.014. [DOI] [PubMed] [Google Scholar]
- Prusky GT, Alam NM, Beekman S, Douglas RM. Rapid quantification of adult and developing mouse spatial vision using a virtual optomotor system. Investigative ophthalmology & visual science. 2004;45:4611–4616. doi: 10.1167/iovs.04-0541. [DOI] [PubMed] [Google Scholar]
- Prusky GT, Silver BD, Tschetter WW, Alam NM, Douglas RM. Experience-dependent plasticity from eye opening enables lasting, visual cortex-dependent enhancement of motion vision. J Neurosci. 2008;28:9817–9827. doi: 10.1523/JNEUROSCI.1940-08.2008. [DOI] [PMC free article] [PubMed] [Google Scholar]
- Ray A, Sun GJ, Chan L, Grzywacz NM, Weiland J, Lee EJ. Morphological alterations in retinal neurons in the S334ter-line3 transgenic rat. Cell and tissue research. 2010;339:481–491. doi: 10.1007/s00441-009-0916-5. [DOI] [PubMed] [Google Scholar]
- Roque RS, Rosales AA, Jingjing L, Agarwal N, Al-Ubaidi MR. Retina-derived microglial cells induce photoreceptor cell death in vitro. Brain research. 1999;836:110–119. doi: 10.1016/s0006-8993(99)01625-x. [DOI] [PubMed] [Google Scholar]
- Sagdullaev BT, Aramant RB, Seiler MJ, Woch G, McCall MA. Retinal transplantation-induced recovery of retinotectal visual function in a rodent model of retinitis pigmentosa. Investigative ophthalmology & visual science. 2003;44:1686–1695. doi: 10.1167/iovs.02-0615. [DOI] [PubMed] [Google Scholar]
- Strettoi E, Volpini M. Retinal organization in the bcl-2-overexpressing transgenic mouse. The Journal of comparative neurology. 2002;446:1–10. doi: 10.1002/cne.10177. [DOI] [PubMed] [Google Scholar]
- Thanos S. Sick photoreceptors attract activated microglia from the ganglion cell layer: a model to study the inflammatory cascades in rats with inherited retinal dystrophy. Brain research. 1992;588:21–28. doi: 10.1016/0006-8993(92)91340-k. [DOI] [PubMed] [Google Scholar]
- Trejo LJ, Cicerone CM. Changes in visual sensitivity with age in rats with heredity retinal degeneration. Vision research. 1987;27:915–918. doi: 10.1016/0042-6989(87)90007-1. [DOI] [PubMed] [Google Scholar]


