

Abstract
Age-related cognitive and behavioral slowing may be caused by changes in the speed of neural signaling or by changes in the number of signaling steps necessary to achieve a given function. In the mammalian cortex, neural communication is organized by a 30–100 Hz “gamma” oscillation. There is a putative link between the gamma frequency and the speed of processing in a neural network: the dynamics of pyramidal neuron membrane time constants suggest that synaptic integration is framed by the gamma cycle, and pharmacological slowing of gamma also slows reaction times on behavioral tasks. The present experiments identify reductions in a robust 40–70 Hz gamma oscillation in the aged rat medial frontal cortex. The reductions were observed in the form of local field potentials, later peaks in fast-spiking neuron autocorrelations, and delays in the spiking of inhibitory neurons following local excitatory signals. Gamma frequency did not vary with movement speed, but rats with slower gamma also moved more slowly. Gamma frequency age differences were not observed in hippocampus. Hippocampal CA1 fast-spiking neurons exhibited interspike intervals consistent with a fast (70–100 Hz) gamma frequency, a pattern maintained across theta phases and theta frequencies independent of fluctuations in the average firing rates of the neurons. We propose that an average lengthening of the cortical 15–25 ms gamma cycle is one factor contributing to age-related slowing and that future attempts to offset cognitive declines will find a target in the response of fast-spiking inhibitory neurons to excitatory inputs.
Introduction
Age-dependent behavioral and cognitive slowing is well documented (Salthouse, 1985, 1996; Birren and Fisher, 1995), and neurophysiological signatures, in the form of scalp-recorded event-related potentials (ERPs), have also been shown to slow with age (Bashore, 1990). Biological explanations for slowing have generally focused on age-related reductions in axon myelination, thought to slow conduction speeds (Peters, 2009; Penke et al., 2010). Some have also argued that slowing is caused by age-related degradation of the synaptic network in aged brains, requiring increases in the number of processing steps necessary to complete a task (Cerella, 1990). Yet another, complementary possibility is that behavioral slowing is caused by slower interactions between networks of neurons. Addressing this latter hypothesis has been constrained by difficulties in defining the temporal framework of network computation.
In the brain, neural activity oscillates at 30–100 Hz, the gamma frequency, as a result of the activity of fast-spiking inhibitory neurons (Whittington et al., 1995; Hasenstaub et al., 2005; Cardin et al., 2009), as well as their interactions with local excitatory neurons (Kopell and LeMasson, 1994; Traub et al., 1997; Whittington et al., 2000; Csicsvari et al., 2003; Hajos et al., 2004; Economo and White, 2012; for review, see Wang, 2010). The activity of neurons that are engaged in the same computation can become dynamically synchronized within the gamma cycle (Gray et al., 1989; Engel and Singer, 2001; Womelsdorf et al., 2006; Harris et al., 2003; Fries, 2009), which may lend stability to the communicating assembly (Borgers and Kopell, 2008; Borgers et al., 2008; Fries, 2009). The gamma period also frames the interval in which inputs to a cortical pyramidal neuron can be integrated: membrane time constants in pyramidal neurons have been estimated to be as long as 16–20 ms (McCormick et al., 1985; Kim and Connors, 1993; Koch et al., 1996), and signal integration during inhibitory phases of gamma are restricted, or shunted, by chloride conductances. Thus, synchronization within the gamma frequency suggests that neural communication, and therefore computation, is organized into steps defined by the gamma period. Consistent with this hypothesis, pharmacological actions of barbiturates, which widen the gamma step by increasing the inhibitory GABAA receptor time constant (Whittington et al., 1995), also increase the latency of ERPs and behavioral reaction times (Meador et al., 1995). Age-dependent changes in the properties of gamma may provide a mechanism that explains the slowing of behavior and cognition with age.
The present experiments examine gamma frequency in aged and young adult rats as a potential physiological substrate for slowing. Decision and movement speeds on a three-arm, two-choice task are compared against local field potential (LFP) and single-unit data recorded in the dorsal anterior cingulate cortex. The anterior cingulate cortex was chosen because it is a widely connected region of frontal cortex thought to participate in action selection and attention (Botvinick et al., 2001; Ridderinkhof et al., 2004; Rushworth et al., 2004). The data described here identify a relationship between gamma frequency and behavioral speed and make progress toward identifying the circuit-level mechanisms of age-related gamma slowing.
Materials and Methods
Subjects, task, and surgeries
Frontal cortex.
All experimental procedures were in accordance with National Institutes of Health guidelines. Six 9- to 14-month-old rats (young adults) and six 25- to 31-month-old (aged adult) male rats were used for the main recording experiment, and an additional set of three 9-month-old male rats were used for the drug manipulation. The set of aged rats represents a subset that were capable of performing the visual portion of the Morris water task and localizing auditory sounds on the task platform (approximately two-thirds of aged rats that passed the visual task were able to run and localize sounds on the task platform). Of the 12 rats used in the main recording study, putative inhibitory neurons (classification methods described below) were recorded in only five aged and five young adults; thus, most recording analyses only included this subset of 10 rats.
Animals were food restricted until they were motivated to run for liquid food reward, vanilla Ensure (Abbott Laboratories) (normally 80–90% of free feeding weight). The experimental apparatus was a platform with three arms radiating from a circular, central region (Fig. 1A). Rats were trained to shuttle to the ends of platform arms to follow an auditory cue (a 10 kHz tone broken each 50 ms by a 25 ms delay) and visual cue (a 4 Hz blinking white light). In the majority of trials, both cues were presented simultaneously, each from a randomly selected arm, and the rewarded cue was experimentally reversed once each week. The experiment was controlled by software custom-written in Visual Basic 6 (Microsoft) and the Basic-X programming language (NetMedia).
Figure 1.

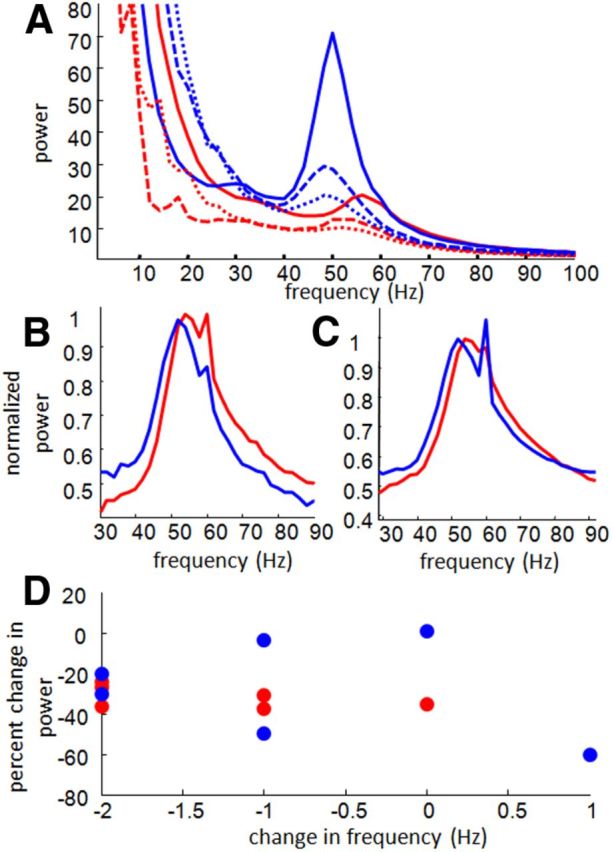
Gamma frequency between trial phases and age groups. A, Rats performed a decision task on a raised, three-armed platform. When a rat entered the central zone, an auditory and a visual cue was presented from the ends of randomly selected arms (left). If the rat correctly navigated to the end of the arm with the rewarded cue, it received liquid food reward (right); if an incorrect choice was made, an error sound was presented. Neural data on the task was normally analyzed after binning trials into seven 500-ms phases (detailed in Materials and Methods). B, LFP and spectral data from an example 500 ms block as a rat performed the decision task (within top dashed line) and average spectral data across all trials and sessions from all rats (within bottom solid line). The three panels in the top window display the raw LFP trace, the frequency spectrum of the trace, and the same frequency spectrum after applying a whitening filter. The two panels of the bottom window display averages before and after applying a whitening filter. Both the example and averages reveal a strong signal in the 40–70 Hz band peaking ∼55 Hz. C, Whitened power spectrum across trial phases. Spectral frequency (y-axis) is averaged across trials and sessions, normalized by peaks and then averaged across rats for the seven 500-ms trial phases (x-axis). Vertical dashed lines between columns in the figure indicate the time of cue initiation and outcome delivery. The gap at the 59–61 Hz band represents its removal from analyses. Right edge graph displays power spectra averaged across trial phases (aged, blue; young, red). Top edge graph displays normalized mean gamma amplitude for each trial phase. Frequency of peak gamma was significantly lower in aged rats across all trial phases. D, Although the speed that rats were moving was highly dependent on trial phase (top), gamma frequency exhibited only minor variations across trial phases (bottom), and these variations were identical between age groups (aged, blue; young, red).
For purposes of analysis, a trial on the decision task could be broken up into seven 500 ms trial phases: (1) initiation of return from feeder zone to cue zone; (2) the middle 500 ms during return to cue zone; (3) the interval immediately before cue presentation; (4) immediately after initiation of the cue; (5) 500 ms around the time of decision (computed as the final acceleration toward feeder zone); (6) immediately before reaching feeder zone; and (7) immediately after entry into feeder zone. Time spent at the feeder between these intervals was subject to licking artifact and not analyzed.
Implantation surgeries were performed under isoflurane anesthesia. Implants were micromanipulator devices that centered 12, independently adjustable electrodes at ∼1.3 mm to the right of midline, tilted 9° medially, and 2.4–3.2 mm anterior to bregma. Additional LFP electrodes were implanted to target the right dorsal hippocampus.
Hippocampus.
A follow-up study was performed on data collected from the CA1 region of the hippocampus in six aged (25–28 months) and six young (9–12 month) adult Fischer-344 rats from a separate experiment (L. A. Schimanski, P. Lipa, and C. A. Barnes, unpublished observations). Rats were trained to run both directions on a rectangular U-shaped track for chocolate Ensure at the track ends. During the main experiment, they were transferred to a similar, but circular, platform in which they also were required to run in both directions for chocolate Ensure at the track ends. Rats were implanted with electrode manipulator devices at 2.0 mm to the right of midline and 3.8 mm posterior to bregma. Animals were also implanted with subcutaneous eyelid electrode wires, the stimulation of which was used during the experiment as a spatially selective, mildly aversive unconditioned stimulus.
Recordings
Frontal cortex.
Recordings were collected while rats performed a three-choice, two-cue decision task, which allowed examination of neural activity and reaction times during both decision and non-decision periods (Fig. 1A). Recordings were also collected during rest sessions before and after the task, which took place in a towel-lined flowerpot next to the experimental apparatus. All recordings were collected using a Neuralynx 32-bit Analog Cheetah Data Acquisition System (Neuralynx). Neurophysiological data were recorded using four-twisted wire electrodes (“tetrodes”), which reached analog amplifiers by way of a head stage (containing unity gain amplifiers), cables, and a commutator, all of which allowed the rat to move and rotate freely on the experimental apparatus. Continuously recorded LFPs were sampled at 1989 Hz (two aged, three young) or 1659 Hz (four aged, three young) and filtered at 1–475 Hz. Action potentials were detected online by thresholding 32 kHz sampled, 600–6000 Hz filtered signals. Spikes were sorted offline as originating from independent single neurons according to clusters of waveform shapes and features across the four channels of the tetrode. The sorting procedure used a combination of the open-source software packages Klustakwik (K. D. Harris, Imperial College London, London, UK; http://klustakwik.sourceforge.net/), MClust (A. D. Redish, University of Minnesota, Minneapolis, MN; http://redishlab.neuroscience.umn.edu/MClust/MClust.html), and Waveform Cutter (S. L. Cowen, University of Arizona, Tucson, AZ). Video tracker data were collected at 60 Hz from an overhead camera. Events taking place in the experimental task, controlled by a Basic-X microcontroller, were timestamped by parallel outputs from the Basic-X into the Cheetah acquisition system.
Hippocampus.
Electrophysiological recordings were performed using the same methods as in frontal cortex, with the exception that all LFP data were collected at 1900 Hz and that all recordings were collected when rats shuttled back and forth between a barrier on a circular platform.
Analyses
Frontal cortex.
All analyses were custom written in MATLAB (MathWorks). For behavioral analyses, the video data were smoothed with a 20-step (∼330 ms) hamming window. Instantaneous velocity, which was used to compute time of trial decision and return from feeders, was calculated by the position change between sequential, 50% overlapping, 33 ms time steps.
LFP analyses were performed on data from electrodes lowered 2000–2600 μm from the brain surface, estimated to be within the dorsal anterior cingulate. Only LFP data from a single tetrode for a given session were included, selected as a tetrode that recorded neurons within the position range. A total of 103 sessions across 12 rats were included, with 8–10 sessions per rat for all but two aged rats that contained tetrodes estimated to be in the cingulate for only four and six sessions each. Data were analyzed (1) raw, (2) filtered with a whitening filter (second-order Yule–Walker autoregressive coefficients, averaged across non-licking task periods), or (3) filtered with a 40–70 Hz bandpass filter (fourth-order Chebyshev Type 1, forward and backward for zero phase distortion using the “filtfilt” function in MATLAB). Spectral data were computed as the discrete Fourier transformation on 500 ms blocks (providing 0.5 Hz resolution) on each trial for each trial phase. In most analyses, the spectral data were then averaged across trials within a given trial phase and session and then averaged across sessions for each rat. Rest epoch spectral data were computed for alternating 500 ms LFP blocks throughout the rest epoch and then averaged across blocks.
The primary measure used to compare frequency between aged and young adult rats was peak gamma frequency, the frequency that exhibited relatively highest power. In unwhitened data, the 1/F factor made it difficult to interpret peaks below 40 Hz, and it was likely that unwhitened peak frequencies are shifted to lower values as a result of 1/F spillover. Use of a whitening filter was therefore valuable in identifying relatively strong frequencies. In whitened data, spectral peaks above 20 Hz were identified; in unwhitened data, peaks above 40 Hz were identified. Peaks between 59 and 61 Hz were not considered to avoid artifact from 60-cycle alternating current in the building. Peak frequency during rest periods were identified in the same manner as during task. To measure relative changes in the gamma signal, such as between trial phases, LFPs were bandpass filtered at 40–70 Hz, and instantaneous amplitude was calculated as the absolute value of the Hilbert transform (normalized by means across non-licking periods, which controlled for impedance differences across electrodes).
Theta signals from the cortical electrodes were weak, but segments of theta activity could be identified by selecting intervals longer than 500 ms during non-licking periods, in which the 6–10 Hz, Hilbert-transformed LFP signal exceeded 1 SD. To control for the possibility that the parameter selection influenced results, theta analyses were also run after selecting theta periods as 300 ms intervals that exceeded 2 SDs. High-voltage spindles during rest periods were identified as increases in 7–9 Hz amplitude >2 SDs of mean amplitude that occurred within 3 min or more of motionlessness (instantaneous velocity was zero or within tracker jitter).
To examine relationships between instantaneous gamma power and theta phase, we used the phase-amplitude modulation index described by Torte et al. (2010). Specifically, we first computed instantaneous gamma amplitude by filtering the LFP at 40–70 Hz and taking the absolute value of the Hilbert transform (as described above). We then computed the instantaneous theta phase of the same LFP signal (or hippocampal LFP, in the case of analyzing hippocampal–frontal theta–gamma coupling) by bandpass filtering the LFP between 6 and 10 Hz, taking the Hilbert transformation, and finding the arctangent (atan2 function in MATLAB) between the imaginary and real component of the spectrum. Theta phases were binned into 18 bins. The distribution of gamma amplitude across the 18 bins of theta phase was found for each trial, between when rats left one feeder until they reached the next (thus removing licking artifact). This vector was normalized to sum to “1,” and the distributions were averaged across trials to compute session phase–power distributions. The modulation index was then computed as the Kullback–Leibler distance between this distribution and the uniform distribution. Modulation index values were averaged across sessions, within rats to make age comparisons. To control for non-uniform phase–power distributions that may arise from the nonstationarity of the signal (i.e., the self-similarity of both gamma power and theta phase from one moment to the next), distributions were also generated for a control signal. The “shift control” signal was created by taking the original LFP and switching the first and second half of the session data. Theta phases were then computed in the same way as above, so that gamma power fluctuations were completely misaligned to theta phases. A second “scramble control” was also used, in which the phase–power distributions were computed after randomly scrambling the instantaneous theta phases throughout the session. The difference between modulation indices for shift and scramble control conditions revealed the effect of nonstationarity on the power–phase relationships, whereas the difference between modulation indices for the original signal and shift control signals revealed theta–gamma coupling interpreted to be physiological.
To identify the phase of firing of single neurons, LFP data were filtered between 40 and 70 Hz using a bandpass filter, as described above. Both positive and negative zero crossings were identified in the filtered LFP, and spike phase was inferred based on where it fell between two positive and two negative zero crossings. Spike-triggered averages (STAs) were generated by averaging filtered LFP traces windowed around the times that the action potentials of a neuron were recorded (described in more detail in Results). For presentation purposes, STAs were generated from LFPs filtered between 20 and 200 Hz, to remove low-frequency components. For analysis purposes, gamma period length and the inhibitory–excitatory phase relationships were computed from STAs generated by using a 40–70 Hz filter, to remove higher-frequency components that were not the subject of investigation.
To classify single neurons, cross-correlations were first computed between all neurons with >1 Hz firing rates during the task. Candidate inhibitory neurons were identified as cross-correlations that exhibited a dip lower than 2 SDs from baseline (assuming a Poisson distribution) for more than one 1-ms bin within the first 5 ms after spike alignment. These neurons tended to have narrower waveforms (peak-to-trough and half-amplitude width); neurons with similar waveform properties were classified as putative inhibitory neurons; neurons in the larger grouping of wider waveforms were classified as putative excitatory neurons (presented in more detail in Results). Classifications based on firing characteristics used 500 ms autocorrelation (with 1 ms bin size) peak latency and slope of decay. The specific parameters used included the following: (1) fast-spiking neurons had autocorrelations peaks = 15–25 ms and −log(slopes) < −3.2; (2) burst-firing neurons had autocorrelation peaks < 12 ms and −log(slopes) > −3.2; and (3) regular-firing neurons had autocorrelation peaks = 47–175 ms (where “log” is the natural logarithm). All autocorrelations and cross-correlations used 1 ms bin sizes. Baseline mean and variance in cross-correlations were calculated from ±10–50 ms periods.
Hippocampus.
Both single-neuron and LFP analyses were performed to examine gamma frequency in the hippocampus. Single-neuron data were analyzed from 60–62 sessions over 30–31 d in each of 12 rats (a singular exception was one aged adult rat who became ill after completing 15 d on the task). For all analyses, including spike sorting, the two sessions during a single day were combined. For LFP analyses, data from 4 d (recording days 10–13) were selected. Only one recording channel was examined, selected according to whichever tetrode contained the highest number of isolated single neurons. To minimize electrical and mechanical artifact from task events (eyeblink stimulation, feeder licking, grooming), LFP data were only analyzed from a particular segment of each trial that was free from these potential artifacts. The segment began when rats entered a position of the circular track immediately after the position in which the eye was stimulated and ended when rats reached the feeder position [the time between these points ranged from >1 s to several minutes, with a median of 4.3 s (averaged across sessions) in young adult rats and 8.1 s in aged rats].
For each LFP trial segment, power spectra were computed using either a discrete Fourier transform, as with the frontal cortex analyses, or using a multitaper method. Power spectra were then averaged across all trials.
Single-neuron data were classified using similar methods to those used for classifying neurons recorded from frontal cortex. Neurons within a cluster of shorter peak-to-trough, half-amplitude widths, as well as half-valley widths were used to classify putative inhibitory neurons. Neurons were also classified using autocorrelograms and histograms of interspike intervals. Decay slopes were computed from 500 ms autocorrelograms as described above; using the same criteria as in frontal cortex, for a neuron to be classified as fast spiking, the negative log of the slope had to be below −3.2. Autocorrelation peaks from 500 ms autocorrelograms were also used. Observation of distributions of peaks motivated a shift from classification parameters to 8–18 ms. The activity of fast-spiking and burst-firing neurons in the CA1 region of hippocampus are highly regulated by the theta oscillation, and secondary peaks between 100 and 140 ms in the autocorrelogram often disguise burst dynamics between 0 and 60 ms. Therefore, an additional classification scheme was used that substituted autocorrelogram peaks for interspike interval peaks. Using this scheme, fast-spiking neurons were defined as units with interspike intervals peaking between 8 and 18 ms.
Results
Frequency of LFP gamma was reduced in aged rats
LFPs recorded from the dorsal anterior cingulate revealed a strong gamma oscillation peaking between 50 and 60 Hz (Fig. 1B). To examine the relationship between the gamma signal and behavior, trials in the decision task were divided into seven 500-ms trial phases, beginning with the rat's initiation of return to the central platform where cues were delivered and ending with a 500 ms interval after rats received the outcome (food reward or error sound) at the feeder zones (see Materials and Methods). The strength of the gamma signal was found to change between trial phases (Fig. 1C, top), suggesting that gamma synchronization of neural activity in anterior cingulate varied with the changing cognitive and movement demands between trial phases. Comparisons of signal amplitude between age groups were not performed because of the dependence on electrode impedance and position. Gamma frequency was found to differ between aged and young adult rats (mean peak frequencies of 53.5 vs 56.4 Hz, respectively, in whitened spectra, two-sample t test, p = 0.005; 52.5 vs 54.7 Hz in unwhitened spectra, p = 0.02; Fig. 1C, vertical panel). These results held independent of whether the distributions were assumed to be Gaussian (medians, 53.3 Hz in aged vs 56.3 Hz in young adults, rank-sum test, p = 0.007; comparing trials pooled within rats, 54.4 Hz in aged vs 57.8 Hz in young adults, rank-sum test, p = 0.002). The differences were also not caused by outliers, because tests remained significant after the removal of any individual rat. The trial-to-trial variance of gamma frequency did not appear to differ between age groups (average SDs of 6.9 Hz in aged vs 7.2 Hz in young adults, coefficients of variation ranging from 9.5 to 17.2%; rank sum test comparing coefficient of variation between age groups, p = 1.0), although there was a trend for increased between-rat variance among the aged adult rats (F test, p = 0.09). Only subtle changes in gamma frequency were observed over phases of the trial, and these were found to be identical between the two age groups (two-way ANOVA interaction between age and trial phase, F(6,70) = 0.17, p = 0.98; Fig. 1D). Thus, although gamma power reflected the behavioral demands of the task, gamma frequency was relatively consistent across behaviors but differed between age groups.
Additional evidence that gamma frequency differences between age groups did not depend on different cognitive or movement demands could be found by comparing gamma frequency between session types and between session epochs. Performance levels on the decision task varied according to how many days had passed; for example, both aged and young adult rats performed better on the day before a switch compared with the day after a switch (two-sample t test, p = 0.0096 for aged, p = 3.2 × 10⁻⁵ for young Fig. 2A). Despite performance changes, no evidence could be found that gamma frequency changed across session types (two-sample t test on sessions before vs after switch, p = 0.86 for aged, p = 0.17 for young; Fig. 2B). Age differences in peak gamma frequency were also observed during rest periods. The effects of session epoch on the gamma oscillation are illustrated in Figure 3 Averaged, raw spectral data from task and rest epochs in an example aged and young adult rat reveal reductions in both frequency and power during rest epochs, although spectral power between rats was highly variable (Fig. 3A). Peak gamma frequency was lower in both age groups during the preceding rest (two-sample t test, p = 0.006; Fig. 3B), as well as the rest epoch subsequent to the task (p = 2.3 × 10−04; Fig. 3C). Although gamma frequency and power both tended to be reduced during rest compared with during task periods, the magnitude of the difference did not differ between age groups (pre-task rest, p = 0.41; post-task rest, p = 1; Fig. 3D).
Figure 2.

Task performance and gamma frequency before and after task switch. A, Performance on the visual version of the three-choice, two-cue task (y-axis) across sessions (x-axis). Performance of both aged (blue) and young (red) adult rats exceeded 80% on the session and the trials before a switch to rewarded auditory cues. After a switch from rewarded auditory to rewarded visual cues, performance dropped and recovered over subsequent days. Performance on the auditory task followed these same patterns, though aged rats performed more poorly than did young adults both before and after cue-reward reversals (data not shown). B, Mean peak gamma frequencies for the same sessions and trials shown in A. Gamma frequency did not significantly change for either age group across sessions and was consistently lower in the aged rats.
Figure 3.
Gamma during rest epochs. A, Example spectrograms showing non-whitened spectral power averaged across all sessions from one aged (blue traces) and one young adult (red traces) rat during performance of the task (solid traces), preceding rest epochs (dashed traces) and subsequent rest epochs (dotted traces). Although in this particular example gamma power in the aged adult rat appeared to be higher than that of the young adult, this pattern did not hold across rats, and between-rat comparisons of gamma power were confounded by variations in electrode position. B, Spectral data from rest epochs preceding task performance for all aged (blue) and young adult (red) rats, whitened, averaged, and normalized within rats. Note that the upward “spikes” at 60 Hz in both aged and young adult averages were caused by varying levels of 60-cycle noise; signals between 59 and 61 Hz were not included in any analysis. C, Spectral data from rest epochs after task performance for all aged (blue) and young adult (red) rats, whitened, averaged, and normalized within rats. Age differences in gamma frequency were observed during both rest epochs. D, The change in gamma power during task compared with during the preceding rest (y-axis; computed as the difference during task and rest divided by the power during task) for each of the six aged and six young adult rats are plotted against difference in peak gamma frequency during task compared with rest (x-axis). The cluster of points below and to the left of the origin indicates that both power and peak frequency tended to be lower during rest periods, but the two did not appear to be related to one another. Additionally, reductions of gamma frequency during rest did not differ between age groups.
One variable that could account for frequency differences of the gamma oscillation between age groups is recording electrode position. However, this potential confound cannot account for the present data because peak gamma frequency did not differ across medial–lateral, anterior–posterior, or dorsal–ventral axes in the electrode configurations of individual aged or young adult rats, and there was no systematic difference observed in the placement of electrodes between age groups (Fig. 4).
Figure 4.

Electrode positions in young and aged rats. A, Peak gamma frequency is plotted against electrode position, pooled across four sessions for an example of one aged (blue) and one young adult (red) rat. Position is separated into lateral–medial, posterior–anterior, and ventral–dorsal axes according to electrode position and the depth to which the electrodes were moved. The absence of correlation between position and peak frequency suggests that gamma slowing occurs throughout frontal cortex and possibly across many cortical regions. It also suggests that age differences cannot be explained by inconsistencies in electrode position between rats. B, Histological electrode lesion examples from the same rats as data presented in A, showing the site of the electrode marker lesion (indicated by the arrows). C, Approximate location of electrode positions in aged and young adult rats (blue and red circles) after electrodes were lowered 3 mm from the brain surface. Positions are plotted relative to an atlas rendering of a horizontal brain section at 3.1 mm from bregma. Electrodes were localized by electrical lesions made at electrode tips after recordings were completed (as in B). There was substantial overlap in recording locations across the aged and young adult group of animals, both centered at the targeted recording locations.
Reduced LFP gamma accompanied slower movement times between rats
If gamma slowing is related to behavioral slowing, then one would expect to observe a correlation between a rat's peak gamma frequency and the rat's “behavioral speed.” There was a significant correlation between the median time, across all trials and sessions, a rat took to reach a chosen feeder after cue presentation and a rat's peak gamma frequency (r = −0.60, p = 0.04). Significant correlations were also found between peak gamma frequency and median decision time (r = −0.58, p = 0.04), as well as the median time it took the rat to run from its decision point to the feeder (r = −0.74, p = 0.006; Fig. 5A). Unexpectedly, partial correlations that controlled for age did not reach statistical significance (cue to feeder, p = 0.38; decision time, p = 0.43; decision to feeder time, p = 0.06).
Figure 5.
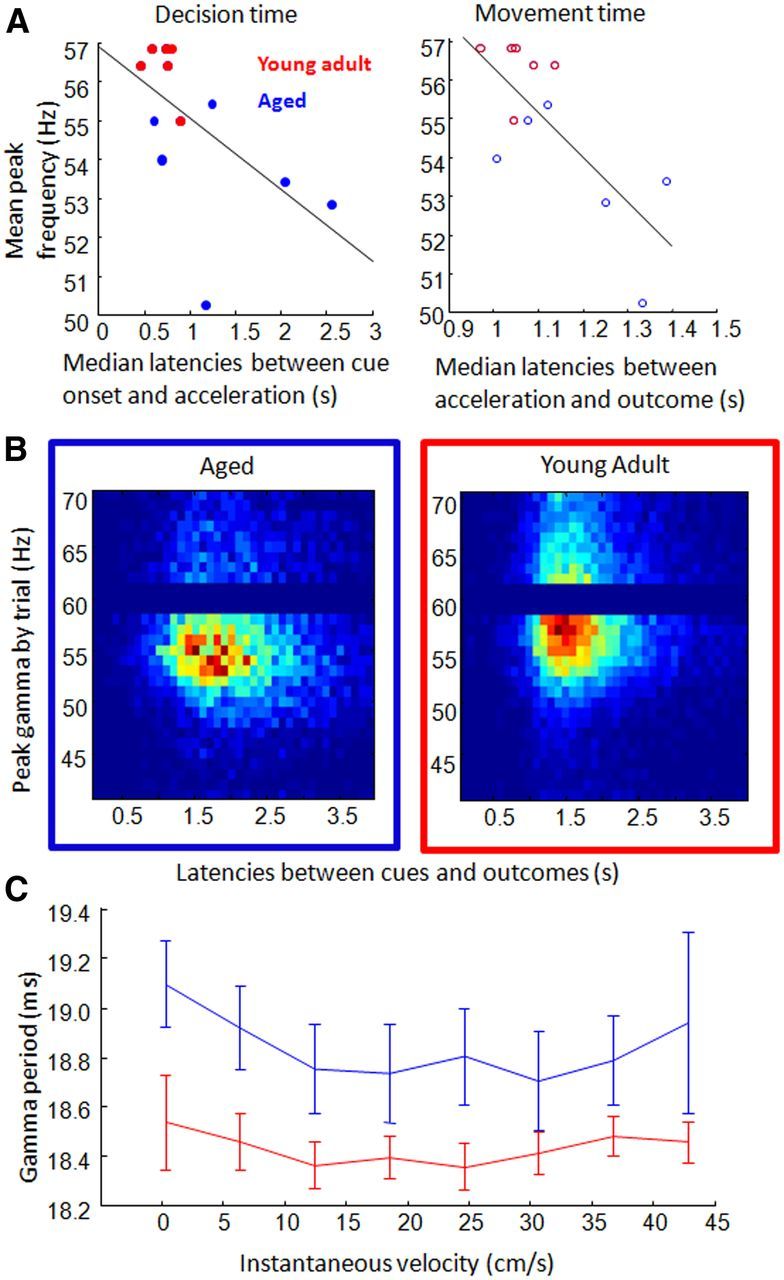
Correlations between behavioral speed and peak gamma. A, Average decision (left) and running (right) latency measures for each rat (x-axis) were significantly correlated with rats' peak gamma frequency (y-axes; blue, aged; red, young adult). B, Three-dimensional histograms for aged (left) and young adult (right) rats show the distribution of peak gamma frequencies across different trial completion times (time between cues and outcomes). Hotter colors represent more trials in which gamma was strongest at that frequency (rows) and in which the trial was completed in a specific amount of time (columns, binned at 0.1 s). Within rats, there was no significant correlation between the peak gamma frequency and completion time of a trial. C, Examination of gamma period length and velocity during brief segments of high-amplitude gamma revealed a persistent age difference across movement speeds (blue, aged; red, young adult).
An important question is whether slower gamma frequency caused slower cognition and movement, or if, alternatively, slower movement speeds and accompanying changes in sensory flow led to slower gamma oscillations. Several observations suggest that movement speed was not responsible for determining gamma frequency. First, there was no relationship between mean, instantaneous velocity and peak gamma frequency across trial phases (Fig. 1D). Second, no correlation was observed between peak frequency and trial completion time in any individual aged or young adult rat (p > 0.05/12, Bonferroni's correction; p < 0.05 in one rat, as expected by chance; a frequency distribution of trial completion times across gamma frequencies is presented in Fig. 5B). Third, when examining the relationship between instantaneous velocity and the width of the gamma period during high-amplitude gamma events (amplitude > 2 SD from mean), gamma periods were observed to differ between age groups across the range of velocities (two-way ANOVA; age, F(1,80) = 27.42, p = 0; instantaneous velocities, F(7,80) = 0.68, p = 0.7; interaction, F(7,80) = 0.18, p = 1.0; Fig. 5C). Finally, as presented in the previous section, age differences in gamma frequency were present even during rest epochs, when there were no experimental incentives to move and the range of movement was restricted by limited space (Fig. 3).
Age did not affect theta frequency or theta–gamma relationships
Age-dependent changes in oscillation frequency appeared to be specific for the gamma spectrum. In LFP electrodes targeting the dorsal hippocampus, the 6–10 Hz theta oscillation increased with movement speed but did not differ between age groups (Fig. 6A). Theta was also examined in the LFPs of the anterior cingulate cortex electrodes. Because strong theta was not observed in frontal electrodes, a thresholding method was used to detect brief intervals of theta frequency activity. The average length of the theta cycles within these intervals was then measured (see Materials and Methods). No age differences were observed in the theta period length in frontal cortex (two-sample t test, p = 0.6; Fig. 6A). There were also no detectable age differences between the period length of sleep spindles (p = 0.5; Fig. 6B). In summary, there was no evidence that oscillation frequencies outside of the 40–70 Hz range were slower in aged rats.
Figure 6.
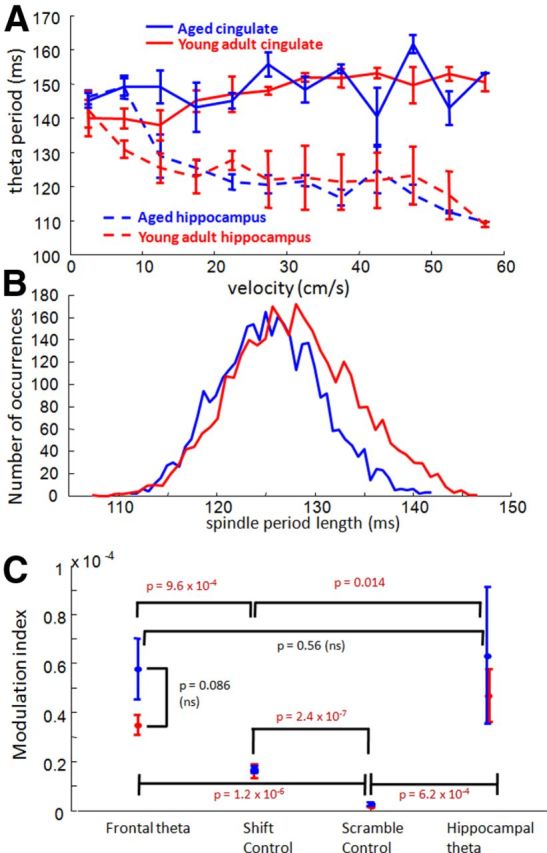
Age comparison of other oscillations: theta, spindles, and theta–gamma coupling. A, The period length of the 6–10 Hz theta oscillation recorded from the cingulate cortex (solid lines) and recorded from electrodes in the dorsal hippocampus (dashed lines), across running speeds. In the hippocampus, theta period length was modulated by the rat's running speed, but there was no overall difference between period length in younger compared with older rats (red and blue traces, respectively; 2-way ANOVA, speed, F(11,88) = 5.76, p = 0; age, F(1,88) = 0.37, p = 0.55; interaction, F(11,88) = 0.99, p = 0.46). Theta frequency in the anterior cingulate cortex also did not differ between age groups (paired t test, p = 0.6). B, A histogram of the spindle period lengths in young (red) and aged (blue) rats. The width of spindles was not significantly different between age groups (p = 0.5). C, The relationship between theta phase and instantaneous gamma amplitude (modulation index, y-axis) was averaged across rats within age groups (left) and compared against modulation indices using shifted theta phases, scrambled theta phases, or theta phases from hippocampal electrodes (x-axis; for more details, see Materials and Methods). Although coupling between theta phase and gamma power was significant (i.e., the modulation indices exceeded shift and scramble control modulation indices), there were no significant age differences in either frontal–frontal or hippocampal–frontal theta–gamma coupling. Differences that did exist between individual rats appeared to depend on the strength (amplitude) of the measured gamma signal (data not shown).
Analyses also examined whether old age influenced the relationship between gamma power and theta phase. Theta–gamma relationships within frontal cortex were examined as well as the relationship between hippocampal theta phase and frontal gamma. These comparisons allowed an assessment of whether age-related changes in gamma frequency disrupted relationships with slower oscillations. As expected from previous reports, theta–gamma coupling was significantly higher than coupling with a control signal (paired t test between frontal–frontal vs shift–control modulation indices, n = 12, p = 9.6 × 10⁻⁴; hippocampal–frontal and shift–control, p = 0.014; Fig. 6C). However, no significant differences were observed in modulation indices between age groups (two-sample t test, n = 6 aged, 6 young adult, p = 0.086). Close inspection of the inter-rat differences revealed that theta–gamma modulation indices were highly related to the strength of the gamma signal (after removal of one outlier, correlation between theta–gamma coupling and the ratio of gamma/theta power, n = 11, r = 0.62, p = 0.04). This result suggests that any interpretation of the apparent trend for aged rats to exhibit stronger coupling must be understood in terms of what factors influence the amplitude of the recorded gamma signal.
Spike–LFP relationships reveal longer excitatory-to-inhibitory latencies
The range of possible cellular and synaptic explanations for gamma slowing is large but can be narrowed by examining the activity of single neurons. The relative firing between excitatory and inhibitory neurons provide information about how gamma is generated and what factors may be responsible for its slowing (Csicsvari et al., 2003; Tiesinga and Sejnowski, 2009). Recordings from 2433 young adult and 915 aged single neurons (young cell median, 404.5; aged cell median, 97.5) were collected from the same anterior cingulate cortex electrodes as were used to record LFPs. Neurons were classified as putative inhibitory (7%) or excitatory (91%) neurons or as axon fibers (2%; Fig. 7A; Bartho et al., 2004). These groups were further classified as fast-spiking, bursting, or regular-firing neurons (Fig. 7B). In contrast with previous reports (Caetano et al., 2012), overall firing rates during task performance were not lower in aged rats, including for fast-spiking neurons (19.3 Hz aged, 16.6 Hz young adult, rank-sum test on neurons pooled within age groups, p = 0.55) or bursting neurons (0.49 Hz aged, 0.45 Hz young adult, p = 0.94). Neuron firing rates in regular-firing neurons may have been higher in aged animals (1.87 Hz aged, 1.41 Hz young adult, p = 6.2 × 10⁻⁴), although this pattern did not generalize across rats (p = 0.52) and was not clearly relevant for behavioral slowing or the gamma frequency.
Figure 7.
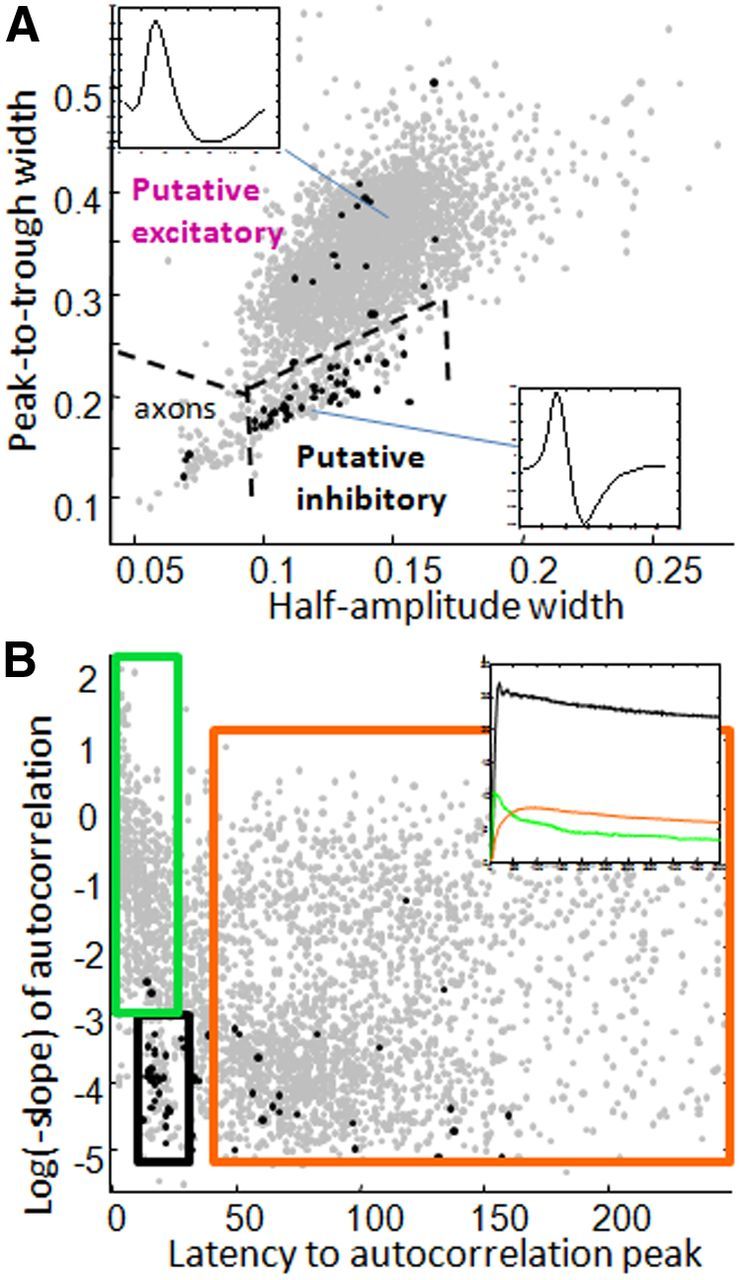
Classification of single neurons. A, A comparison between the width of action potentials from peak-to-trough and the width of the action potential at half-amplitude revealed two major groupings. Top and bottom insets show examples of each action potential type, with lines pointing to the respective locations in feature space. Inhibitory neurons identified using cross-correlation methods (black dots) primarily clustered in the narrow-waveform grouping. All neurons in this lower grouping were subsequently treated as putative inhibitory neurons. An additional group of neurons with exceptionally narrow waveforms were classified as axon fibers and were not used for the present analyses. B, Autocorrelation peak latencies are plotted against autocorrelation slopes for all neurons. At least four groupings are revealed: (1) a distinctive cluster of fast-spiking neurons with peak latencies between 14 and 25 Hz (2.6% of all neurons, of which >60% were also identified as putative inhibitory neurons; black box); (2) a group of bursting-type neurons (autocorrelation peaks <25 ms with steeper slopes, 15% of all neurons; green box); (3) a group of late-peaking (>45 ms) neurons with steeper slopes (31% of all neurons; top portion of orange box); and (4) a group of late-peaking neurons with flatter slopes (35% of neurons; bottom portion of orange box). Many of the steeper-sloped neurons were found to also have a low firing rate during the task epoch; for simplicity and consistency with previous classification analyses, the two groups with late autocorrelation peaks were combined and are referred to as regular-spiking neurons. Approximately 9% of neurons had autocorrelations with peak latencies intermediate between the regular spiking and fast-spiking clusters and are presently left unclassified. Black dots indicate neurons identified as inhibitory using cross-correlations, as in A. Inset shows autocorrelations averaged across neurons in each neuron class, with colors corresponding to box colors.
The majority of recorded neurons were found to fire preferentially at a specific phase of 40–70 Hz gamma (Raleigh's test, 86%, p < 0.05/3, Bonferroni's correction for three trial phases/epochs). There was no age difference in the proportion of neurons significantly locked to gamma; however, there was a difference in the phase of gamma at which aged versus young adult neurons fired most. Treating each gamma peak (i.e., greatest local current sinks, following the “negative-up” convention) as 0° (or 360°), the mean preferred phase of putative excitatory neurons in young rats was 26 ± 2° (mean and 95% confidence interval) and in aged rats was 18 ± 3°; meanwhile, putative inhibitory neurons in young rats fired most at 50 ± 6° and in aged rats at 74 ± 13° (Fig. 8A,B). Thus, there was a larger phase difference between excitatory and inhibitory neuron firing in aged compared with young adult rats (n = 5 young and 5 aged rats with recorded, putative inhibitory neurons; p = 0.006, two-sample t test or two-sample Watson–Williams test for circular data). These patterns were further confirmed by the period lengths observed in the STAs (18.1 ms gamma period in young adult rats and 20.0 ms period in aged rats, n = 5 young and 5 aged, two-sample t test, p = 0.03; Fig. 8C) and the offsets observed between the inhibitory and excitatory STAs (3.0 ms in aged rats, 1.5 ms in young adults, p = 0.002; Fig. 8D).Together, these data suggest that altered excitatory–inhibitory neuron interactions may be responsible for the gamma frequency slowing with age.
Figure 8.
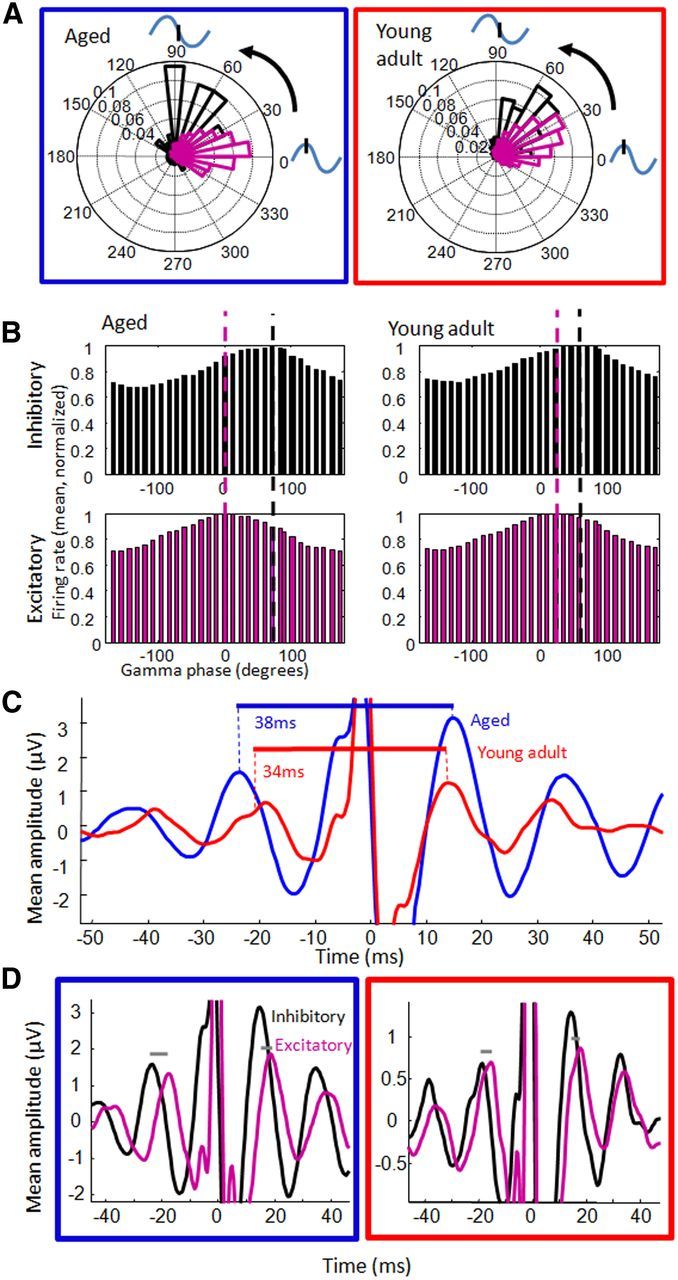
Relationships between LFP gamma oscillations and neuron action potentials. A, Polar plots of preferred firing phase for all putative inhibitory (black) and excitatory (purple) neurons for young (left) and aged (right) adult rats. Inhibitory neurons fired at a slightly later phase of gamma than did excitatory neurons. B, Mean firing rates across phases of gamma for all cells from aged (left) and young adult (right) rats for inhibitory (top) and excitatory (bottom) neurons. For display purposes, averages are normalized to the peak. The vertical purple and black dashed lines represent the gamma phase at which most excitatory and inhibitory neurons fire, which reveals a greater separation in the aged rats. C, STA LFPs (bandpass filtered, 20–200 Hz) of all aged (blue) and young adult (red) putative inhibitory neurons. Traces are averages across neurons; horizontal lines represent the between-rat averages computed from 40 to 70 Hz filtered STAs. D, STA LFPs of putative inhibitory neurons (black) and excitatory neurons (purple) in aged (left) and young adult (right) rats. Offsets between excitatory and inhibitory neurons, referenced to gamma, were longer in aged rats.
Spiking data from single neurons and neuron pairs confirmed LFP patterns
Gamma frequency reductions could be observed independent of LFPs. The firing of fast-spiking neurons is known to be an important part of neural synchronization within the gamma frequency (Buzsáki et al., 1983; Whittington et al., 1995; Hasenstaub et al., 2005; Mann et al., 2005; Freund and Katona, 2007; Cardin et al., 2009; Hajos and Paulsen, 2009). Fast-spiking neurons had significantly later autocorrelation peaks in the aged rats (20.1 ms, ∼50 Hz) compared with fast-spiking neurons recorded in young adult rats (18.1 ms, ∼55 Hz; two-sample t test, n = 21 aged neurons and 51 young adult, p = 0.004; Fig. 9A). Age did not appear to affect autocorrelation peaks in either burst-firing or regular-firing neurons. Changes in excitatory–inhibitory relationships could also be observed independent of LFPs. In both aged and young adult rats, cross-correlations between inhibitory and excitatory neurons exhibited significant, putative monosynaptic coupling (either 1 or 2 ms bins were >3 SDs over baseline, assuming Poisson distributions); however, these were less common in aged rats compared with the young adults (15% in aged compared with 21% of pairs in young adults in which the 1 ms bin was >2 SDs over baseline, χ2 test, χ2 = 8.1, p = 0.005; Fig. 9B). Conversely, cases in which the latency between excitatory and inhibitory neuron spikes was 5–6 ms were more commonly observed in aged rats (15% compared with 11% of pairs with the −5 or −6 ms bins of inhibitory–excitatory cross-correlations >2 SDs over baseline, χ2 = 5.5, p = 0.02). When cross-correlations were viewed at longer latencies, the gamma oscillation could be observed as humps in the excitatory–inhibitory neuron latencies at approximately −20 and 14 ms (Fig. 9B, inset).
Figure 9.

The gamma oscillation, and its slowing with age, was observed in the firing patterns of single neurons and pairs of single neurons. A, Autocorrelation firing rates in a cluster of fast-spiking neurons. All fast-spiking neuron autocorrelations of neurons recorded from aged (blue) and young adult (red) rats are averaged, and the dashed lines show these same traces after smoothing. Autocorrelation peaks were significantly later in aged rat neurons than those of young adults; overall firing rates (height of autocorrelations) were not significantly different. B, Cross-correlations between simultaneously recorded putative excitatory and inhibitory neurons are normalized by converting to z scores and then averaged across all aged and young adult pairs. Putative monosynaptic connections were observed in both age groups, reflected by the strong peak of excitatory neuron firing in the milliseconds before firing of inhibitory neurons. In aged rat cell pairs, there was a significantly higher incidence of excitatory neuron firing 4–6 ms before inhibitory neuron firing, consistent with the observation of larger inhibitory–excitatory offsets in the spike–LFP relationships. Inset shows that gamma oscillations were apparent in the excitatory–inhibitory cross-correlations of both aged and young adult rats.
Barbiturates slow the gamma oscillation in behaving rats, but NMDA antagonists do not
The data suggest that excitatory–inhibitory synapses contribute to the gamma frequency, which is consistent with previous work showing that gamma frequency is modulated by glutamatergic action on NMDA receptors located on the inhibitory cells (Mann and Mody, 2010; Carlen et al., 2012). Previous studies have identified age-related declines in the distribution of NMDA but not GABAA receptors in the cortex of rodents and primates (Wenk et al., 1991). To examine whether NMDA receptors alone could account for the observed changes in gamma frequency, an additional experiment using the same behavioral and electrophysiological methods described above was performed on three young adult rats. Unexpectedly, injection of the NMDA receptor antagonist MK-801 was found to have no effect on gamma frequency (Table 1), although it appeared to increase gamma power (n = 7 sessions, p = 0.04). Injection of the barbiturate sodium pentobarbital (Nembutal) reliably resulted in a reduction in gamma frequency, consistent with the known actions of barbiturates on the GABAA time constant (Whittington et al., 1995).
Table 1.
Drug effects on gamma frequency
| Saline | Nembutal (5 mg/kg) | MK-801 (0.05 mg/kg) | |
|---|---|---|---|
| 56.5 | 51.9 | 57.3 | |
| p = 6 × 10⁻⁵ | p = 0.12 | ||
| Rat 9245 | 56.1 Hz | 50.5 Hz | 57.0 Hz |
| p = 3 × 10⁻⁸ | p = 0.2 | ||
| Rat 9244 | 56.7 Hz | 52.5 Hz | 58.0 Hz |
| p = 0.002 | — | ||
| Rat 9233 | 56.8 Hz | 52.7 Hz | 57.0 Hz |
| p = 3 × 10⁻⁴ | p = 0.9 |
Values are peak gamma frequencies, calculated by averaging across trials and 500 ms trial phases for each session and then averaging across sessions. p values are the results of t test comparisons of peak gamma frequency between drug and saline conditions. Top row shows means and p values across rats, and the bottom rows show means and p values within rats, across session. As a result of poor behavior in rat 9244, data collection under treatment with MK-801 was successfully obtained in only one session, so a within-rat comparison could not be made. Gamma frequency was consistently slower after administration of the barbiturate Nembutal (sodium pentobarbital), but gamma frequency after the NMDA antagonist MK-801 was not different from the saline condition.
Hippocampal LFPs and fast-spiking neurons do not exhibit frequency-related age differences
To examine whether the patterns observed in frontal cortex generalized to the hippocampus, a follow-up study was performed that analyzed the LFP gamma oscillation and fast-spiking neuron firing within the CA1 region of hippocampus. The analyses were performed on a dataset of an additional set of six young and six aged adult rats (Schimanski et al., unpublished observations; see Materials and Methods).
Spectral data of LFP signals from the CA1 region of hippocampus revealed a conspicuous theta oscillations peaking at 8–9 Hz, followed by humps of increased power at theta harmonics (15–19, 23–28, 30–36 Hz, etc.; Fig. 10A). The peak of power in the theta oscillation, as well as the peak power in apparent harmonics, was slower in aged animals, consistent with the known relationship between theta frequency and running velocity (Fig. 6A). Estimates of peak power between 40 and 58 Hz were highly variable between trials and sessions for each rat, and no significant difference between age groups was observed (within-rat average peak frequencies; aged, n = 6, mean = 47.15; young, n = 6, mean = 47.30; paired t test, p = 0.63). Apparent power increases between 62 and 80 Hz and between 80 and 120 Hz were also analyzed, with no apparent differences in peak power between age groups (two-sample t tests, p = 0.59 and p = 0.62, respectively).
Figure 10.
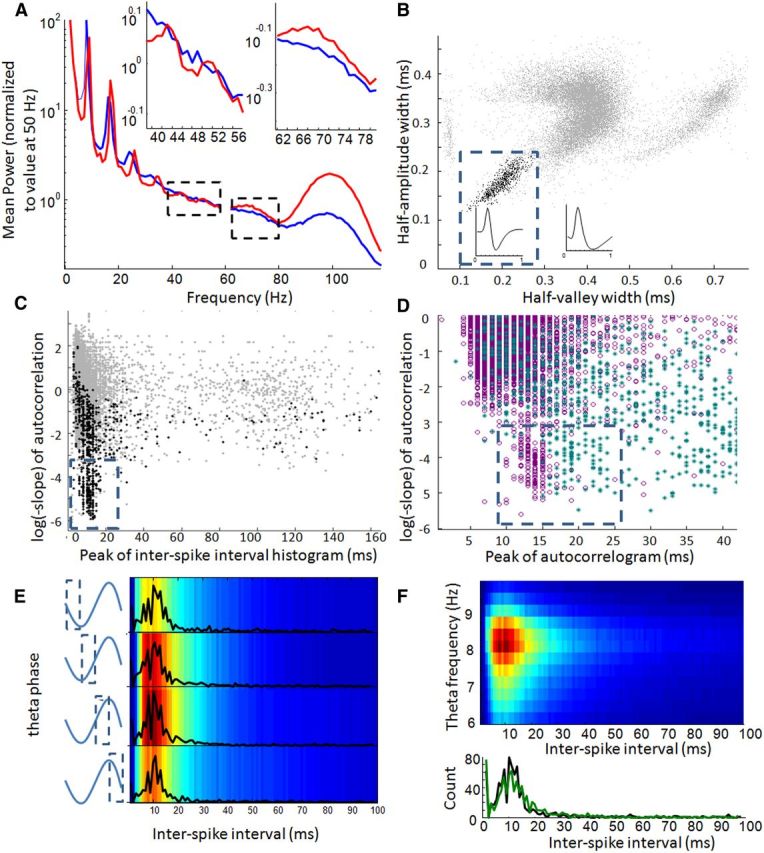
Gamma patterns in LFPs and putative inhibitory neurons from hippocampal region CA1 of young and aged rats. A, Average spectrograms for hippocampal LFP data collected from aged (blue) and young (red) adult rats. Spectral data were computed for a specific segment of each trial, were averaged across trials, and then averaged across four sessions for each rat. For display purposes, within-rat averages were normalized by the power at 50 Hz before data were averaged within age groups. Left and right insets provide an expanded view of the age-group differences between 40–60 and 60–80 Hz, respectively (outlined by dashed-line boxes in main plot). Sharp spectral peaks in the theta (6–10 Hz) band in both age groups appear to reoccur at exponentially reduced amplitudes at theta harmonics (note the log-scale vertical axis). The shifted theta frequency in older rats reflects differences in average running speeds and appear to be reflected by similar shifts at the theta harmonics. In contrast with data from the cingulate, no gamma-band power increases appear to dominate below 60 Hz, although strong power increases are apparent between 60–80 and 90–110 Hz. B, The half-amplitude width of the average waveform of each hippocampal neuron is plotted against the half-valley width (gray points). The dashed line shows the approximate boundaries used to define putative inhibitory neurons (black points). Trace displayed within the dashed box is the average waveform of all neurons within the cluster, and the trace outside the box is the average waveform of all other neurons in the population. C, Autocorrelation slope versus interspike interval peak of all neurons (gray points) as well as cells identified as putative inhibitory neurons (black points). As with neurons in frontal cortex, a subpopulation of neurons exhibited flatter slopes and early peaks; these neurons were classified as fast spiking (outlined by dashed line). D, Autocorrelation slope and autocorrelation peak latency are plotted for all recorded hippocampal (purple) and frontal (cyan) neurons. The latencies between spikes in hippocampal fast-spiking neurons are consistently earlier (12–13 ms) than those of frontal cortex (18–20 ms). Also in contrast with frontal neurons, no age differences were observed between the hippocampal fast-spiking neuron, autocorrelation peaks (data not shown). E, Distribution of interspike intervals of all (aged and young adult) hippocampal putative inhibitory neurons across four phases of theta. Average histograms of 1-ms-binned interspike intervals across all inhibitory neurons (colors) and frequency plots of histogram peaks (overlaid black traces) display variation in average firing rates across theta phases (y-axis) but very little variation in the interval between spike pairs (x-axis). F, Interspike interval histograms of all putative inhibitory neurons (aged and young adult) averaged within 12 frequency bins between 6 and 10 Hz (y-axis). Hotter colors in top represent increased occurrence of sequential spike pairs occurring at a given theta frequency (y-axis) with a given interspike interval (x-axis). Although neurons typically fired when theta frequency was between 7.5 and 9 Hz, changes in the shape of interspike interval histograms across theta frequencies were minor. Bottom shows the frequency distribution of interspike interval histogram peaks when theta oscillated at 7 Hz (black trace) compared with when theta oscillated at 9 Hz (green trace). In both cases, the central tendency of the distribution was at 11 ms.
For a complimentary way to determine the frequency of hippocampal gamma, fast-spiking, putative inhibitory interneurons were isolated from aged and young adult rats, and their autocorrelations and interspike intervals were examined. As described above, fast-spiking inhibitory neurons play an integral role in gamma frequency synchronization. Identification of fast-spiking, putative inhibitory neurons involved two steps. First, neurons that exhibited shorter peak-to-trough, half-amplitude, and half-valley widths were classified as putative inhibitory neurons (Fig. 10B). In aged adult rats, 293 of 9807, or 3% of isolated single units, met this criteria; in young adult rats, 501 of 11572, or 4% of isolated single units, met this criteria. Besides possible regional differences, the small percentage compared with cortical putative inhibitory neurons likely reflected additional usage of the half-valley feature, to overcome ambiguities in waveform feature distributions and difficulty in isolating smaller neurons in the presence of the densely packed neurons of the CA1 pyramidal cell layer. Second, a cluster of neurons with short-latency interspike interval peaks (Fig. 10C) or autocorrelation peaks (Fig. 10D) and flatter autocorrelation slopes was identified (Fig. 10C). Interspike interval peaks were used in addition to autocorrelation peaks so that cells with higher, secondary peaks at the theta period were not excluded from analyses. In aged adults, 60 of 99 (autocorrelogram peaks/interspike interval peaks) met this criteria; in young adult rats, 118 of 179 (autocorrelogram peaks/interspike interval peaks), or 1.7% of the total number of recorded units, met this criteria. In general, 81–87% of neurons classified as fast spiking were also classified as putative inhibitory neurons, depending on whether autocorrelation or interspike interval peaks were used.
The autocorrelogram peak latencies of hippocampal fast-spiking neurons distributed between 8 and 18 ms, with means at 12.5 ms (or 11.5 using interspike interval peaks; Fig. 10D). This is in contrast with frontal cortex, in which the average fast-spiking neuron autocorrelogram peak was at 18.6 ms (described above and in Fig. 9A). Also in contrast with the frontal cortex, no age differences were observed in the peak latencies for fast-spiking neuron autocorrelations (aged mean, 12.7 ms; young mean, 12.4 ms; paired t test, p = 0.41) or interspike intervals (aged, 11.7 ms; young, 11.3; two-sample t test, p = 0.10). The same patterns were observed when age groups were compared after averaging within rats (n = 6 aged and 6 young adult, two-sample t test, p = 0.70) or when comparing within-rat medians of interspike intervals from putative inhibitory neurons (two-sample t test, p = 0.30).
Additional analyses were performed to examine whether there was a relationship between interspike intervals of fast-spiking neurons and the theta oscillation. The motivation behind these analyses was to determine whether the influence of age on gamma frequency was restricted to particular theta phases or theta period lengths. Previous studies have reported relationships between theta phase and gamma frequency (Colgin et al., 2009; Belluscio et al., 2011). Recent reports also have suggested a relationship between gamma frequency and running speed (Ahmed and Mehta, 2012). If local, fast-spiking, putative inhibitory neurons participate in multiple gamma frequencies, then the interval between pairs of spikes may also vary between theta phases.
There was a strong and significant relationship between putative inhibitory or fast-spiking neuron activity and theta phase (theta phase binned into four phases, spike numbers compared across bins using Friedman's test; putative inhibitory, X(3,2379)2 = 310.9, p = 4 × 10−67; fast spiking, X(3,831)2 = 249.6, p = 8 × 10−54). There was no apparent effect of age on the relationship between spike number and theta phase (repeated-measures ANOVA, interaction between age and phase, F(3,30) = 0.60, p = 0.62). Despite differences in number of spikes, theta phase had only a minor effect on the intervals between pairs of fast-spiking neuron spikes. This pattern can be illustrated with frequency distributions of interspike intervals during four different bins of theta phase (Fig. 10E). It could be quantified across the population of all neurons by identifying the peak of the interspike interval distribution for each neuron, within each theta phase bin (median across neurons for negative theta phases, 12 ms; during positive theta phases, 11 ms; Friedman's test, putative inhibitory neurons, X(3,2379)2 = 34.6, p = 1.5 × 10⁻⁷; fast-spiking neurons, X(3,831)2 = 37.7, p = 3 × 10⁻⁸). There was no apparent effect of age on the relationship between interspike intervals and theta phase (repeated-measures ANOVA, effect of theta phase on within-rat median interspike intervals, F(3,30) = 4.0, p = 0.017; effect of age on median interspike intervals, F(1,30) = 0.50, p = 0.50; interaction between age and theta phase, F(3,30) = 0.92, p = 0.44). These data suggest that fast-spiking inhibitory neurons within or adjacent to the CA1 pyramidal cell layer contributed only to a 70–100 Hz gamma oscillation across theta phases, and this does not appear to change across age.
Interspike interval patterns of fast-spiking neurons in CA1 were also influenced in only minor ways by theta period length (median peaks ranging from 11 to 12 ms at longer theta periods in putative inhibitory neurons, X(11,9527)2 = 100, p = 1.2 × 10⁻¹⁶ or from 11 to 13 ms across fast-spiking neurons X(11,3047)2 = 103, p = 6.7 × 10⁻¹⁷; Fig. 10F, bottom). It is therefore unlikely that fast-spiking inhibitory neurons in CA1 by themselves participate in LFP gamma frequency shifts at different running speeds.
Altogether, hippocampal LFP and single-neuron firing patterns indicate that the gamma oscillation generated in hippocampal region CA1 is faster than the gamma oscillation recorded from frontal cortex. In contrast to the gamma oscillation in frontal cortex, the mechanisms or modulators of CA1 gamma frequency are unaffected by the aging process.
Discussion
The data from the present experiments demonstrate that the frequency of the 40–70 Hz gamma rhythm recorded from the dorsal anterior cingulate cortex is reduced in aged relative to young adult rats. This frequency reduction was observed across all behavioral epochs and between trial phases within the decision task. It was observed in both the LFP and the firing patterns of single neurons. No relationship was observed between gamma frequency and the speed a rat was moving at a given time, as would be expected if changes in the animal's perceptual or motor experiences were driving frequency. Furthermore, gamma frequency did not appear to depend on the recording location within the dorsal medial frontal cortex, and there was no evidence for frequency reductions in other neural oscillations, such as theta and sleep spindles. Age-related frequency reductions in gamma were therefore robust and selective.
In addition to identifying age-related slowing in gamma frequency, a relationship was uncovered between single-neuron firing and phase of gamma, one that suggests a potential mechanism for gamma slowing. Specifically, slower gamma frequencies were accompanied by a reduction in 1–2 ms coupling between spikes of putative excitatory and inhibitory neurons. Firing correlations with a sharp peak <3 ms can suggest monosynaptic connections, and coupling between excitatory and inhibitory neurons has been observed previously in vitro (Miles, 1990; Gulyas et al., 1993; Thomson and Deuchars, 1997; Ali et al., 1998; Hajos et al., 2004) and in vivo (Csicsvari et al., 2003; Fujisawa et al., 2008), suggesting that excitatory neurons can contribute to inhibitory neuron spiking and thereby contribute to the pace of gamma. The reduced strength or incidence of this coupling in older animals indicates that gamma is likely to be slower as a result of changes in the response of GABAergic neurons to glutamatergic signals.
Finally, the results presented here describe strong qualitative differences between gamma frequency neural patterns in hippocampal CA1 region compared with frontal cortex, including no apparent gamma slowing with age. LFPs recorded from CA1 lacked the prominent 50–60 Hz peak in the spectral data recorded from frontal cortex; additionally, the autocorrelograms of putative inhibitory and fast-spiking neurons peaked between 12 and 15 ms, substantially faster than the 15–25 ms latencies observed in frontal cortex. The instantaneous pace of these neurons (i.e., the peak of their interspike intervals) did not substantially change at different theta phases or different theta frequencies in the hippocampus. This suggests that slower and faster bands of gamma observed in the hippocampus (Colgin et al., 2009; Belluscio et al., 2011) may be inherited from other regions or generated by neurons with cell bodies that are not in or adjacent to the pyramidal cell layer.
Although a correlation was found between gamma frequency in cingulate cortex and movement speed across all rats, two results encourage caution in interpreting the apparent connection between physiology and behavior. First, no correlation was observed between instantaneous gamma frequency in the anterior cingulate cortex and moment-to-moment changes in running velocity or decision speed. This is not surprising, given that the dynamic fluctuations of the gamma period may not be coherent across all brain regions, and increasing the speed of a cognitive process that relies on the anterior cingulate cortex will not necessarily translate into faster locomotion or sensorimotor reaction times. Second, partial correlation between mean gamma frequency and median decision or movement speeds were not significant. This result is more difficult to reconcile with the hypothesis that age-related slowing is caused by a generalized shift in cortical 40–70 Hz oscillations. The best explanation for this inconsistency is that, although gamma frequency may set an upper limit on how fast an animal can perform a task, many factors, physical, motivational, and cognitive in nature, influence the speed that behavior is generated. Future experiments that better control for these factors and use larger sample sizes will be useful in quantifying the physiology–behavior relationships.
How does a slower gamma oscillation produce slower neural processing? As described in the Introduction, there is a strong empirical and theoretical link between neural synchronization at the gamma frequency and the pace of communication between circuits. This relationship can be understood in terms of synaptic integration in a postsynaptic neuron. Membrane time constants of cortical pyramidal neurons have been reported to be approximately as long as the gamma period (McCormick et al., 1985; Kim and Connors, 1993; Koch et al., 1996). However, integration of inputs between gamma cycles is less likely to take place, because presynaptic inputs will be reduced during the inhibitory phase (Fig. 7B estimates a reduction of 30%), and the opening of perisomatic chloride channels will shunt incoming EPSPs, restricting the membrane time constant. Reducing the frequency of gamma may lengthen the period of time between windows of high presynaptic activity and higher postsynaptic membrane resistance.
Previous investigations into the neurobiology of slowing have generally focused on its relationship with white matter changes (Bucur et al., 2008; Gold et al., 2010; Burgmans et al., 2011; Lu et al., 2011). Demyelination of axons in the brain can decrease the speed of action potential propagation, thought to cause an overall slowing of the system. The demyelination hypothesis is not at odds with the present results, but it also does not constitute an explanation of age-related slowing. Communication speeds within and between neuron circuits is not equivalent to the linear sum of action potential propagation times. Thus, any explanation for behavioral slowing must link age-related changes to neurons or their synapses with communication changes taking place at the level of circuits that they form.
It may still be possible for a purely demyelination-based theory of age-related slowing to explain how slower axon conduction velocities could lead to changes in the relative firing of nearby excitatory and inhibitory neurons. Although the simplest explanation for this effect would appear to be synaptic or conductance changes in basket cell interneurons, alternative explanations cannot yet be dismissed. Changes in white matter integrity could delay signals that reach basket neurons from long-range, distal afferents (the basis of feedforward inhibition) relative to signals from local excitatory neurons (supporting feedback inhibition). This may decrease the coincident input from the two sources, resulting in an apparent reduction in efficacy of local excitatory signals onto to inhibitory neurons. More data and modeling work will be necessary to ascertain which hypothesis is most parsimonious.
An explanation of behavioral slowing based on slower gamma-rate communication faces its own limitations. Foremost among these is the apparent discrepancy between the magnitude of the change in behavior speed compared with neural communication speed. The average reduction in gamma frequency across the six aged animals that were studied was ∼3 Hz; if the relationship between gamma frequency and behavioral speed is linear, then it accounts for only a 5% difference in behavioral speed between age groups, or ∼50–60 ms for each second of processing. This raises the question of what nonlinear effects may be involved. For example, by spacing out the time period of presynaptic neuron firing, longer gamma periods may decrease the probability of synchrony, thereby reducing the efficacy of input to the postsynaptic neurons. This could increase the number of failures in the processing stream, requiring more gamma cycles, and possibly the engagement of more neural circuits (Grady and Craik, 2000; Cabeza et al., 2002) to complete a processing task. Future work will be invaluable for understanding the relationships between gamma slowing and network processing speeds.
The apparent involvement of fast-spiking, putative inhibitory neurons in age-related behavioral changes has implications for studies that have linked the GABAergic system with age-related perceptual deficits. Experimental manipulation of GABAergic receptors has been shown to improve age-related visual deficits in primates (Leventhal et al., 2003) and reverse age-dependent impairments in olfactory discrimination learning in rats (Lasarge et al., 2009). In the present experiment, Nembutal, by acting on the GABAA receptors, had a straightforward slowing effect on the gamma oscillation. Although previous studies identify a relationship between interneuron NMDA receptors and gamma speed (Mann and Mody, 2010; Carlen et al., 2012) and age-related reductions in cortical NMDA receptors (Wenk et al., 1991), the present experiment found that pharmacological targeting of NMDA receptors had no effect on gamma speed in awake, behaving rats. Because MK-801 is not selective for excitatory or inhibitory neuron classes, the finding is not in conflict with the role of interneuron NMDA receptors in gamma frequency. Rather, the results provide a framework for synthesizing the disparate findings that relate glutamatergic as well as GABAergic systems to age-related deficits. If the critical age-related changes are specifically in the inhibitory neurons, possibly attributable to age-related changes in glutamatergic receptors on the inhibitory neurons, then it may be more effective to manipulate gamma speed pharmacologically using agents that act on the GABAergic cells. In other words, targeting network patterns, independent of the specific mechanisms for these patterns, may yield the greatest recovery of functional declines observed in old age.
Footnotes
This work was supported by the National Institute of Aging Grant AG012609 and the McKnight Brain Research Foundation. We thank Z. J. Wagner and M. Richards for help collecting data, J. N. Vega for help with histology, K. Takehara-Nishiuchi for critical feedback, K. Bohne for help with electrodes, and J. Wang for spike-sorting assistance.
The authors declare no completing financial interests.
References
- Ahmed OJ, Mehta MR. Running speed alters the frequency of hippocampal gamma oscillations. J Neurosci. 2012;32:7373–7383. doi: 10.1523/JNEUROSCI.5110-11.2012. [DOI] [PMC free article] [PubMed] [Google Scholar]
- Ali AB, Deuchars J, Pawelzik H, Thomson AM. CA1 pyramidal to basket and bistratified cell EPSPs: dual intracellular recordings in rat hippocampal slices. J Physiol. 1998;507:201–217. doi: 10.1111/j.1469-7793.1998.201bu.x. [DOI] [PMC free article] [PubMed] [Google Scholar]
- Bashore TR. Age-related changes in mental processing revealed by analyses of event-related brain potentials. In: Rohrbaugh JW, Parasuraman R, Johnson R, editors. Event-related brain potentials: basic issues and applications. New York: Oxford UP; 1990. pp. 242–274. [Google Scholar]
- Bartho P, Hirase H, Monconduit L, Zugaro M, Harris KD, Buzsaki G. Characterization of neocortical principal cells and interneurons by network interactions and extracellular features. J Neurophysiol. 2004;92:600–608. doi: 10.1152/jn.01170.2003. [DOI] [PubMed] [Google Scholar]
- Belluscio MA, Mizuseki K, Schmidt R, Kempter R, Buzsáki G. Cross-frequency phase-phase coupling between theta and gamma oscillations in the hippocampus. J Neurosci. 2012;32:423–435. doi: 10.1523/JNEUROSCI.4122-11.2012. [DOI] [PMC free article] [PubMed] [Google Scholar]
- Birren JE, Fisher LM. Aging and speed of behavior: possible consequences for psychological functioning. Annu Rev Psychol. 1995;46:329–353. doi: 10.1146/annurev.ps.46.020195.001553. [DOI] [PubMed] [Google Scholar]
- Börgers C, Kopell NJ. Gamma oscillations and stimulus selection. Neural Comput. 2008;20:383–414. doi: 10.1162/neco.2007.07-06-289. [DOI] [PubMed] [Google Scholar]
- Börgers C, Epstein S, Kopell NJ. Gamma oscillations mediate stimulus competition and attentional selection in a cortical network model. Proc Natl Acad Sci U S A. 2008;105:18023–18028. doi: 10.1073/pnas.0809511105. [DOI] [PMC free article] [PubMed] [Google Scholar]
- Botvinick MM, Braver TS, Barch DM, Carter CS, Cohen JD. Conflict monitoring and cognitive control. Psychol Rev. 2001;108:624–652. doi: 10.1037/0033-295x.108.3.624. [DOI] [PubMed] [Google Scholar]
- Bucur B, Madden DJ, Spaniol J, Provenzale JM, Cabeza R, White LE, Huettel SA. Age-related slowing of memory retrieval: contributions of perceptual speed and cerebral white matter integrity. Neurobiol Aging. 2008;29:1070–1079. doi: 10.1016/j.neurobiolaging.2007.02.008. [DOI] [PMC free article] [PubMed] [Google Scholar]
- Burgmans S, Gronenschild EH, Fandakova Y, Shing YL, van Boxtel MP, Vuurman EF, Uylings HB, Jolles J, Raz N. Age differences in speed of processing are partially mediated by differences in axonal integrity. Neuroimage. 2011;55:1287–1297. doi: 10.1016/j.neuroimage.2011.01.002. [DOI] [PMC free article] [PubMed] [Google Scholar]
- Buzsáki G, Leung LW, Vanderwolf CH. Cellular bases of hippocampal EEG in the behaving rat. Brain Res. 1983;287:139–171. doi: 10.1016/0165-0173(83)90037-1. [DOI] [PubMed] [Google Scholar]
- Cabeza R, Anderson ND, Locantore JK, McIntosh AR. Aging gracefully: compensatory brain activity in high-performing older adults. Neuroimage. 2002;17:1394–1402. doi: 10.1006/nimg.2002.1280. [DOI] [PubMed] [Google Scholar]
- Caetano MS, Horst NK, Harenberg L, Liu B, Arnsten AF, Laubach M. Lost in transition: aging-related changes in executive control by the medial prefrontal cortex. J Neurosci. 2012;32:3765–3777. doi: 10.1523/JNEUROSCI.6011-11.2012. [DOI] [PMC free article] [PubMed] [Google Scholar]
- Cardin JA, Carlén M, Meletis K, Knoblich U, Zhang F, Deisseroth K, Tsai LH, Moore CI. Driving fast-spiking cells induces gamma rhythm and controls sensory responses. Nature. 2009;459:663–667. doi: 10.1038/nature08002. [DOI] [PMC free article] [PubMed] [Google Scholar]
- Carlén M, Meletis K, Siegle JH, Cardin JA, Futai K, Vierling-Claassen D, Rühlmann C, Jones SR, Deisseroth K, Sheng M, Moore CI, Tsai LH. A critical role for NMDA receptors in parvalbumin interneurons for gamma rhythm induction and behavior. Mol Psychiatry. 2012;17:537–548. doi: 10.1038/mp.2011.31. [DOI] [PMC free article] [PubMed] [Google Scholar]
- Cerella . Aging and information processing rate. In: Birren JE, Schaie KW, editors. The handbook of the psychology of aging. Ed 3. San Diego: Academic; 1990. pp. 201–221. [Google Scholar]
- Colgin LL, Denninger T, Fyhn M, Hafting T, Bonnevie T, Jensen O, Moser MB, Moser EI. Frequency of gamma oscillations routes flow of information in the hippocampus. Nature. 2009;462:353–357. doi: 10.1038/nature08573. [DOI] [PubMed] [Google Scholar]
- Csicsvari J, Jamieson B, Wise KD, Buzsáki G. Mechanisms of gamma oscillations in the hippocampus of the behaving rat. Neuron. 2003;37:311–322. doi: 10.1016/s0896-6273(02)01169-8. [DOI] [PubMed] [Google Scholar]
- Economo MN, White JA. Membrane properties and the balance between excitation and inhibition control gamma-frequency oscillations arising from feedback inhibition. PLoS Comput Biol. 2012;8:e1002354. doi: 10.1371/journal.pcbi.1002354. [DOI] [PMC free article] [PubMed] [Google Scholar]
- Engel AK, Singer W. Temporal binding and the neural correlates of sensory awareness. Trends Cogn Sci. 2001;5:16–25. doi: 10.1016/s1364-6613(00)01568-0. [DOI] [PubMed] [Google Scholar]
- Freund TF, Katona I. Perisomatic inhibition. Neuron. 2007;56:33–42. doi: 10.1016/j.neuron.2007.09.012. [DOI] [PubMed] [Google Scholar]
- Fries P. Neuronal gamma-band synchronization as a fundamental process in cortical computation. Annu Rev Neurosci. 2009;32:209–224. doi: 10.1146/annurev.neuro.051508.135603. [DOI] [PubMed] [Google Scholar]
- Fujisawa S, Amarasingham A, Harrison MT, Buzsáki G. Behavior-dependent short-term assembly dynamics in the medial prefrontal cortex. Nat Neurosci. 2008;11:823–833. doi: 10.1038/nn.2134. [DOI] [PMC free article] [PubMed] [Google Scholar]
- Gold BT, Powell DK, Xuan L, Jicha GA, Smith CD. Age-related slowing of task switching is associated with decreased integrity of frontoparietal white matter. Neurobiol Aging. 2010;31:512–522. doi: 10.1016/j.neurobiolaging.2008.04.005. [DOI] [PMC free article] [PubMed] [Google Scholar]
- Grady CL, Craik FI. Changes in memory processing with age. Curr Opin Neurobiol. 2000;10:224–231. doi: 10.1016/s0959-4388(00)00073-8. [DOI] [PubMed] [Google Scholar]
- Gray CM, König P, Engel AK, Singer W. Oscillatory responses in cat visual cortex exhibit inter-columnar synchronization which reflects global stimulus properties. Nature. 1989;338:334–337. doi: 10.1038/338334a0. [DOI] [PubMed] [Google Scholar]
- Gulyás AI, Miles R, Sík A, Toth K, Tamamaki N, Freund TF. Hippocampal pyramidal cells excite inhibitory neurons through a single release site. Nature. 1993;366:683–687. doi: 10.1038/366683a0. [DOI] [PubMed] [Google Scholar]
- Hájos N, Paulsen O. Network mechanisms of gamma oscillations in the CA3 region of the hippocampus. Neural Netw. 2009;22:1113–1119. doi: 10.1016/j.neunet.2009.07.024. [DOI] [PubMed] [Google Scholar]
- Hájos N, Pálhalmi J, Mann EO, Németh B, Paulsen O, Freund TF. Spike timing of distinct types of GABAergic interneuron during hippocampal gamma oscillations in vitro. J Neurosci. 2004;24:9127–9137. doi: 10.1523/JNEUROSCI.2113-04.2004. [DOI] [PMC free article] [PubMed] [Google Scholar]
- Harris KD, Csicsvari J, Hirase H, Dragoi G, Buzsáki G. Organization of cell assemblies in the hippocampus. Nature. 2003;424:552–556. doi: 10.1038/nature01834. [DOI] [PubMed] [Google Scholar]
- Hasenstaub A, Shu Y, Haider B, Kraushaar U, Duque A, McCormick DA. Inhibitory postsynaptic potentials carry synchronized frequency information in active cortical networks. Neuron. 2005;47:423–435. doi: 10.1016/j.neuron.2005.06.016. [DOI] [PubMed] [Google Scholar]
- Kim HG, Connors BW. Apical dendrites of the neocortex: correlation between sodium- and calcium-dependent spiking and pyramidal cell morphology. J Neurosci. 1993;13:5301–5311. doi: 10.1523/JNEUROSCI.13-12-05301.1993. [DOI] [PMC free article] [PubMed] [Google Scholar]
- Koch C, Rapp M, Segev I. A brief history of time (constants) Cereb Cortex. 1996;6:93–101. doi: 10.1093/cercor/6.2.93. [DOI] [PubMed] [Google Scholar]
- Kopell N, LeMasson G. Rhythmogenesis, amplitude modulation, and multiplexing in a cortical architecture. Proc Natl Acad Sci U S A. 1994;91:10586–10590. doi: 10.1073/pnas.91.22.10586. [DOI] [PMC free article] [PubMed] [Google Scholar]
- Lasarge CL, Bañuelos C, Mayse JD, Bizon JL. Blockade of GABA(B) receptors completely reverses age-related learning impairment. Neuroscience. 2009;164:941–947. doi: 10.1016/j.neuroscience.2009.08.055. [DOI] [PMC free article] [PubMed] [Google Scholar]
- Leventhal AG, Wang Y, Pu M, Zhou Y, Ma Y. GABA and its agonists improved visual cortical function in senescent monkeys. Science. 2003;300:812–815. doi: 10.1126/science.1082874. [DOI] [PubMed] [Google Scholar]
- Lu PH, Lee GJ, Raven EP, Tingus K, Khoo T, Thompson PM, Bartzokis G. Age-related slowing in cognitive processing speed is associated with myelin integrity in a very healthy elderly sample. J Clin Exp Neuropsychol. 2011;33:1059–1068. doi: 10.1080/13803395.2011.595397. [DOI] [PMC free article] [PubMed] [Google Scholar]
- Mann EO, Mody I. Control of hippocampal gamma oscillation frequency by tonic inhibition and excitation of interneurons. Nat Neurosci. 2010;13:205–212. doi: 10.1038/nn.2464. [DOI] [PMC free article] [PubMed] [Google Scholar]
- Mann EO, Suckling JM, Hajos N, Greenfield SA, Paulsen O. Perisomatic feedback inhibition underlies cholinergically induced fast network oscillations in the rat hippocampus in vitro. Neuron. 2005;45:105–117. doi: 10.1016/j.neuron.2004.12.016. [DOI] [PubMed] [Google Scholar]
- McCormick DA, Connors BW, Lighthall JW, Prince DA. Comparative electrophysiology of pyramidal and sparsely spiny stellate neurons of the neocortex. J Neurophysiol. 1985;54:782–806. doi: 10.1152/jn.1985.54.4.782. [DOI] [PubMed] [Google Scholar]
- Meador KJ, Loring DW, Moore EE, Thompson WO, Nichols ME, Oberzan RE, Durkin MW, Gallagher BB, King DW. Comparative cognitive effects of phenobarbital, phenytoin, and valproate in healthy adults. Neurology. 1995;45:1494–1499. doi: 10.1212/wnl.45.8.1494. [DOI] [PubMed] [Google Scholar]
- Miles R. Synaptic excitation of inhibitory cells by single CA3 hippocampal pyramidal cells of the guinea-pig in vitro. J Physiol. 1990;428:61–77. doi: 10.1113/jphysiol.1990.sp018200. [DOI] [PMC free article] [PubMed] [Google Scholar]
- Penke L, Muñoz Maniega S, Murray C, Gow AJ, Hernández MC, Clayden JD, Starr JM, Wardlaw JM, Bastin ME, Deary IJ. A general factor of brain white matter integrity predicts information processing speed in healthy older people. J Neurosci. 2010;30:7569–7574. doi: 10.1523/JNEUROSCI.1553-10.2010. [DOI] [PMC free article] [PubMed] [Google Scholar]
- Peters A. The effects of normal aging on myelinated nerve fibers in monkey central nervous system. Front Neuroanat. 2009;3:11. doi: 10.3389/neuro.05.011.2009. [DOI] [PMC free article] [PubMed] [Google Scholar]
- Ridderinkhof KR, Ullsperger M, Crone EA, Nieuwenhuis S. The role of the medial frontal cortex in cognitive control. Science. 2004;306:443–447. doi: 10.1126/science.1100301. [DOI] [PubMed] [Google Scholar]
- Rushworth MF, Walton ME, Kennerley SW, Bannerman DM. Action sets and decisions in the medial frontal cortex. Trends Cogn Sci. 2004;8:410–417. doi: 10.1016/j.tics.2004.07.009. [DOI] [PubMed] [Google Scholar]
- Salthouse TA. Speed of behavior and its implications for cognition. In: Birren JE, editor. Handbook of the psychology of aging. Ed 2. New York: Van Nostrand Reinhold; 1985. pp. 400–426. [Google Scholar]
- Salthouse TA. The processing-speed theory of adult age differences in cognition. Psychol Rev. 1996;103:403–428. doi: 10.1037/0033-295x.103.3.403. [DOI] [PubMed] [Google Scholar]
- Thomson AM, Deuchars J. Synaptic interactions in neocortical local circuits: dual intracellular recordings in vitro. Cereb Cortex. 1997;7:510–522. doi: 10.1093/cercor/7.6.510. [DOI] [PubMed] [Google Scholar]
- Tiesinga P, Sejnowski TJ. Cortical enlightenment: are attentional gamma oscillations driven by ING or PING? Neuron. 2009;63:727–732. doi: 10.1016/j.neuron.2009.09.009. [DOI] [PMC free article] [PubMed] [Google Scholar]
- Traub RD, Jefferys JG, Whittington MA. Simulation of gamma rhythms in networks of interneurons and pyramidal cells. J Comput Neurosci. 1997;4:141–150. doi: 10.1023/a:1008839312043. [DOI] [PubMed] [Google Scholar]
- Wang XJ. Neurophysiological and computational principles of cortical rhythms in cognition. Physiol Rev. 2010;90:1195–1268. doi: 10.1152/physrev.00035.2008. [DOI] [PMC free article] [PubMed] [Google Scholar]
- Wenk GL, Walker LC, Price DL, Cork LC. Loss of NMDA, but not GABA-A, binding in the brains of aged rats and monkeys. Neurobiol Aging. 1991;12:93–98. doi: 10.1016/0197-4580(91)90047-n. [DOI] [PubMed] [Google Scholar]
- Whittington MA, Traub RD, Jefferys JG. Synchronized oscillations in interneuron networks driven by metabotropic glutamate receptor activation. Nature. 1995;373:612–615. doi: 10.1038/373612a0. [DOI] [PubMed] [Google Scholar]
- Whittington MA, Traub RD, Kopell N, Ermentrout B, Buhl EH. Inhibition-based rhythms: experimental and mathematical observations on network dynamics. Int J Psychophysiol. 2000;38:315–336. doi: 10.1016/s0167-8760(00)00173-2. [DOI] [PubMed] [Google Scholar]
- Womelsdorf T, Fries P, Mitra PP, Desimone R. Gamma-band synchronization in visual cortex predicts speed of change detection. Nature. 2006;439:733–736. doi: 10.1038/nature04258. [DOI] [PubMed] [Google Scholar]