

Abstract
L1 Ligase (L1L)molecular switch is an in vitro optimized synthetic allosteric ribozyme that catalyzes the regioselective formation of a 5’-to-3’ phosphodiester bond, a reaction for which there is no known naturally occurring RNA catalyst. L1L serves as a proof of principle that RNA can catalyze a critical reaction for prebiotic RNA self-replication according to the RNA World hypothesis. L1L crystal structure captures two distinct conformations that differ by a re-orientation of one of the stems by around 80 Å and are presumed to correspond to the active and inactive state, respectively. It is of great interest to understand the nature of these two states in solution, and the pathway for their interconversion. In this study, we use explicit solvent molecular simulation together with a novel enhanced sampling method that utilizes concepts from network theory to map out the conformational transition between active and inactive states of L1L. We find that the overall switching mechanism can be described as a 3-state/2-step process. The first step involves a large-amplitude swing that re-orients stem C. The second step involves the allosteric activation of the catalytic site through distant contacts with stem C. Using a conformational space network representation of the L1L switch transition, it is shown that the connection between the three states follows different topographical patterns: the stem C swing step passes through a narrow region of the conformational space network, whereas the allosteric activation step covers a much wider region and a more diverse set of pathways through the network.
Keywords: ribozyme, allostery, conformational transition, catalysis
1. Introduction
L1 ligase (L1L) is a synthetic in vitro selected ribozyme that catalyzes regiospecific formation of 3′ to 5′ phosphodiester linkages, a reaction characteristic of all extant present-day RNA and DNA protein polymerases. There is no known naturally occurring ribozyme that catalyzes this phosphodiester assembly reaction, and it was not until 1993 when the first ribozyme that exhibited this activity was created through in vitro evolution. [9] Along with several other ligase ribozymes [3, 37, 57, 58, 78, 99, 106, 114], L1L adds support to the RNA world hypothesis that proposes that life originated from catalytic RNA molecules capable of replication via template-dependent assembly of RNA fragments of nucleotide monomers[24, 87, 103, 121].
In addition to its potential relevance to the origin of life, L1L, presumably as a fortuitous consequence of in vitro selection, is an allosteric ribozyme molecular switch [21, 39, 74]. It has been shown that it is possible to take advantage of this property to engineer new constructs whose catalytic activity can be controlled by small molecules, peptides, or even proteins[99–101, 104]. Recently there has been an increased interest in using aptamer molecules like L1L for a large spectrum of applications such as purification and biotechnology, diagnostics and biosensors, therapeutics, or for combating infectious agents [17, 41, 49, 65]
The crystal structure of the L1L self-ligation product has been solved recently [105], providing “a glimpse of biology’s first enzyme” [62]. The X-ray crystal structure of the self-ligation product shows two crystallographically independent conformations resolved in the same asymmetric unit. These conformers differ in the orientation of one of the stems (stem C) by a movement of the stem tip by 80 Å[105]. A minimal set of virtual torsions was identified to be sufficient to differentiate between the two conformers.[48] Based on the presence/absence of specific contacts in the ligation site and evolutionarily conserved regions of the bulged loop situated on stem C, it was proposed that the conformers represented catalytically active “on” and inactive “off” states. [105] We will refer to these two crystallized structures as active/docked and inactive/undocked, respectively.
L1L is a gamma shaped molecule, with three stems joined into a three-way junction (Fig.1) which is a recurring motif in the present set of known ribozyme ligases. Relative angular orientations of helices forming RNA junctions have been shown to be decisive in deciphering the capacity of distant contacts to stabilize specific RNA conformations that can affect function[5]. The structure of the L1L stems is mainly helical, with a bulged loop on stem C and GAAA tetra-loops terminating each stem. L1L helices contain canonical base pairs with the notable exception of 3 consecutive non-canonical base pairs between the active site and the substrate, an unusual trait in the world of synthetic ribozymes [37, 67]. Several experimental sources suggest that the L1L catalytic mechanism consists of (i) binding a complementary DNA effector - an unusual fact in the context of other ribozyme ligases, (ii) binding of the substrate, (iii) allosteric activation of the catalytic site by the formation of a stem-loop contact supported by an 80 Å swing of one of the L1L stems (stem C), and (iv) catalytic self-ligation. [99–101, 104, 105] The crystallized construct [105] used in the present work as a starting point for molecular dynamics simulations is missing the DNA effector binding site and has the substrate covalently bound, enabling exploration of the later two stages of the L1L catalysis: stem C swing, allosteric activation of the active site and catalytic ligation.
Figure 1.
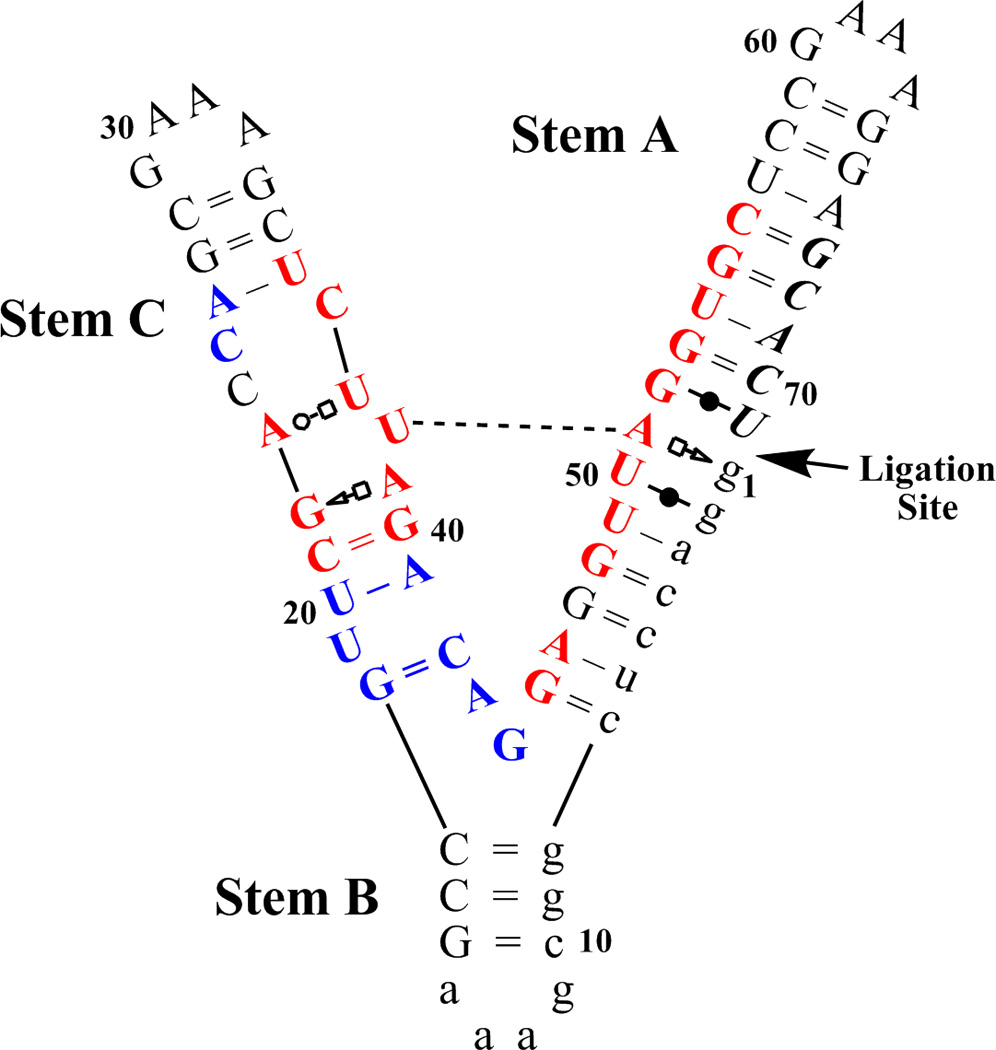
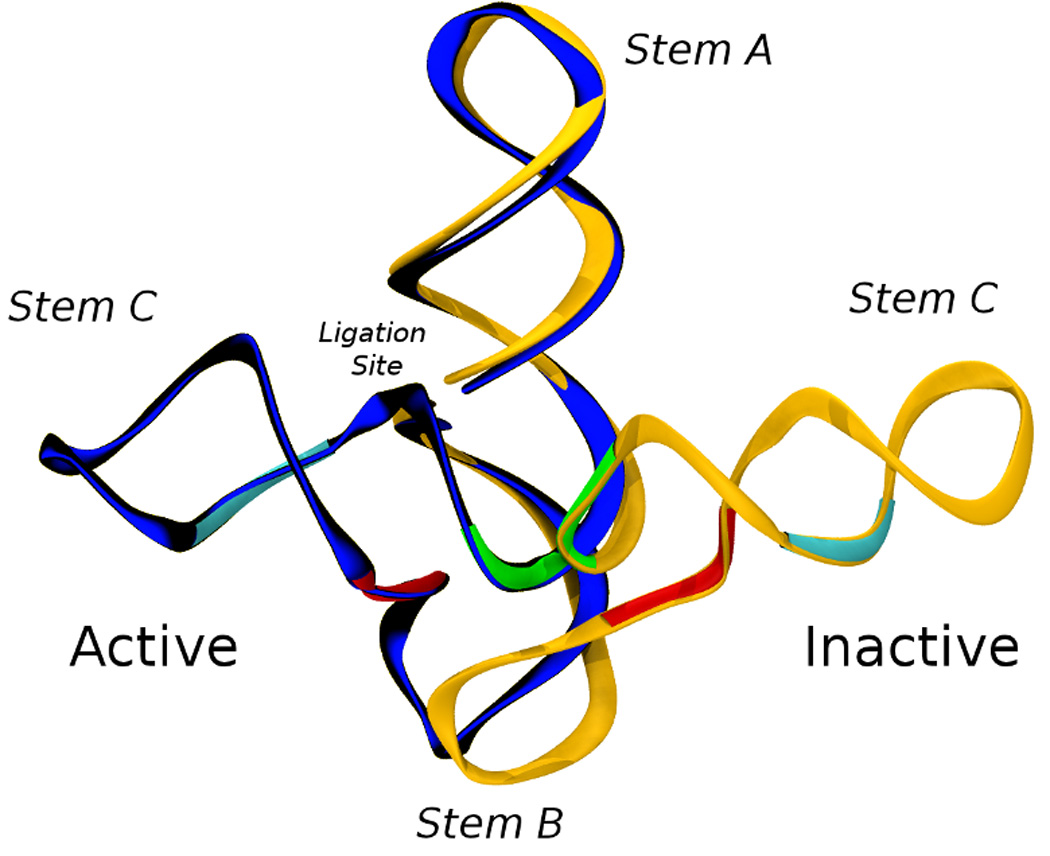
L1L structure. (a) L1L is a γ-shaped molecule, with three stems (labeled A,B,C) joined in a three-way junction. The structure of the stems is mainly helical, with the exception of a bulged loop located on stem C and with GAAA tetra-loops ending each stem. L1L helical parts contain canonical base pairs with the notable exception of 3 consecutive non-canonical base pairs between the active site and the substrate on stem A. The docked/active conformation contains an additional tertiary contact between stem A and stem C (dashed line) mediated by a U38-A51 canonical base pair and a Mg2+ ion. Evolutionarily conserved regions are colored in red for more than 95% and blue for more than 80%. Lower case nucleotides were not varied during the in vitro evolution. The nucleotides that constitute the substrate are in italics[99–101, 104, 105]. The L1L construct studied here (l1xc6) has the substrate covalently bound. See text for a more detailed description of the L1L allosterically controlled catalytic mechanism. (b) Overlay of the two crystallized conformations of L1L. Active/docked state is in blue and inactive/undocked state is in orange. The two co-crystallized structures are RMS-fit using all the heavy atoms comprising stem A and B. This shows that for the two structures to interconvert the tip of stem C has to travel over a 80 A long path. We have previously shown[48] that only restricted regions of the L1L structure have to change to assist L1L conformational transition. These restricted regions can be identified using virtual torsions analysis of the crystal structures and molecular dynamics simulations and are marked in green (θ44), red (θ18) and magenta (η37, θ38).
In our previous analysis of the L1L structure and dynamics [48]we identified a set of dynamical hinge points using a series of molecular dynamics (MD) simulations of the precursor and product states that captured fluctuations around the active and inactive conformers. The hinge points were located in highly evolutionarily conserved regions of L1L sequence and were identified based on analysis of the distribution of virtual torsions. Specifically, two hinge points were located in the three way junction, and another in a bulge loop on stem C (U38 loop). The ligation site was predicted by the simulations to visit three distinct states characterized by hydrogen bond patterns that are correlated with the formation of specific contacts implicated in catalysis.
It remains an open question how L1L can be controlled to transition between its active and inactive forms. An understanding of this transition and the factors that control it are of fundamental importance to help engineer L1L constructs that bind to a wide spectrum of analytes. This large-scale conformational change is likely a result of the artificial in vitro selection that targeted, in part, allosteric properties. In the case of the naturally occurring hammerhead ribozyme adiabatic morphing shows a fairly simple trajectory exists between the active and inactive states that can be transversed simply via a series of low energy-barrier, small-scale torsion-angle conformational changes within one of its stems and active site[110]. On the contrary, in the case of the L1 ligase, a similar simple treatment is impeded due to steric hindrance at the three-helix junction as can be seen from the superimposition of the docked and un-docked conformers in Fig. 1. L1L conformational change is so large that it defies treatment by more conventional, established means.
Here we aim to characterize the complex conformational landscape and pathways that connect the L1L active and inactive conformations using molecular simulations. We use molecular dynamics (MD) in conjunction with an enhanced sampling technique designed to increase statistical sampling along the pathway of the conformational transitions and was inspired by related methods in the literature that represent the conformational space using graph theory and apply swarms of trajectories. Based on the analysis of conformational space network that is obtained frommore than 1 µs of MD simulations, we propose that the L1L activation mechanism involves a three-state, two-step process. One of the steps corresponds to the large swing of stem C from the vicinity of the crystallized inactive conformer to the vicinity of the active conformer. This large conformational change is shown to correlate directly to changes in the three-way junction tracked by changes in a specific virtual torsion angle (θ44). The second step consists in the formation of tertiary contacts between stem C and the active site, an event accompanied by a subtle change in the base-pairing dynamics between the active site and the substrate. We show that the connection between the three states follows different patterns: the stem C swing step passes through a narrow region of the conformational space network, whereas the allosteric activation step covers a much wider region and a more diverse set of pathways through the network.
2. Results and Discussion
2.1. Three sub-states (A,I1,I2) are linked during L1L switching
Here we aim to isolate the overall large-scale characteristic motions of the dynamics of the L1L switch mechanism by constructing a conformational space network (CSN) model. A CSN model is a graphic network representation in which each node represents a conformational state and two conformational states are linked byan edge if the transitions between these two states are observed during molecular dynamics sampling[15, 18, 47, 66, 84, 85, 97].
CSN models offer discrete representations of configurational space and of the possible transition pathways between states, and have been used extensively to characterize the folding free-energy landscapes of peptides or small proteins as an alternative to projections onto limited sets of (sometimes arbitrary) order parameters[11, 14, 18, 47, 55, 56, 71, 84, 96, 97, 125]. CSN models also reveal the topography of the conformational space and free energy landscape. It has been shown that it is likely that nodes in the same free energy basin are well connected to each other, whereas nodes in different basins are loosely connected[18]. Additionally, finding sets of pathway(s) through the network that connect two sub-states affords a detailed structural characterization of the transition. Here, our goal is to find an essential network description with a minimal number of clusters that capture the essential, structurally distinct states along the transition pathway.
Identifying the nodes representing conformational states is central for building a CSN model. Traditional clustering algorithms require a preset number of clusters for a given data set. Since the optimized overall objective similarity/dissimilarity function increases/decreasesmonotonically with the number of clusters[52, 59, 129], the choice of the number of clusters is the key to establishing a meaningful data reduction. Here we exploit features of the dynamics of the docked/active state in order to determine the optimal number of clusters. Specifically, the docked/active state does not exhibit large conformational variation, and can, in fact, be well described by a single set of structures stably fluctuating about a well-defined average. The desired clusters should be optimally chosen so that the ensemble of structures in the docked/active state reside in a single cluster.
To achieve the desired constraint of clustering, a structure-based hybrid two-stage partitional-agglomerative clustering algorithm is utilized, which has been shown to efficiently lead to better solutions than partitional or agglomerative schemes alone.[130] (see Materials and Methods). The clustering algorithm works as follows: in the first stage the data is partitioned in relatively large number of clusters (100 in the present case). This is a top-to-bottom partitional stage requiring global information about the entire dataset. In the second stage the clusters are merged until all the conformations spanned by the active state are classified into a single cluster. This is a bottom-up agglomerative stage that requires only local information. The utilization of the hybrid clustering approach is summarized in the tree (dendrogram) graph shown in Fig.2a (see full details Supplementary Material) to yield a final set of 12 coarse-grained clusters.
Figure 2.
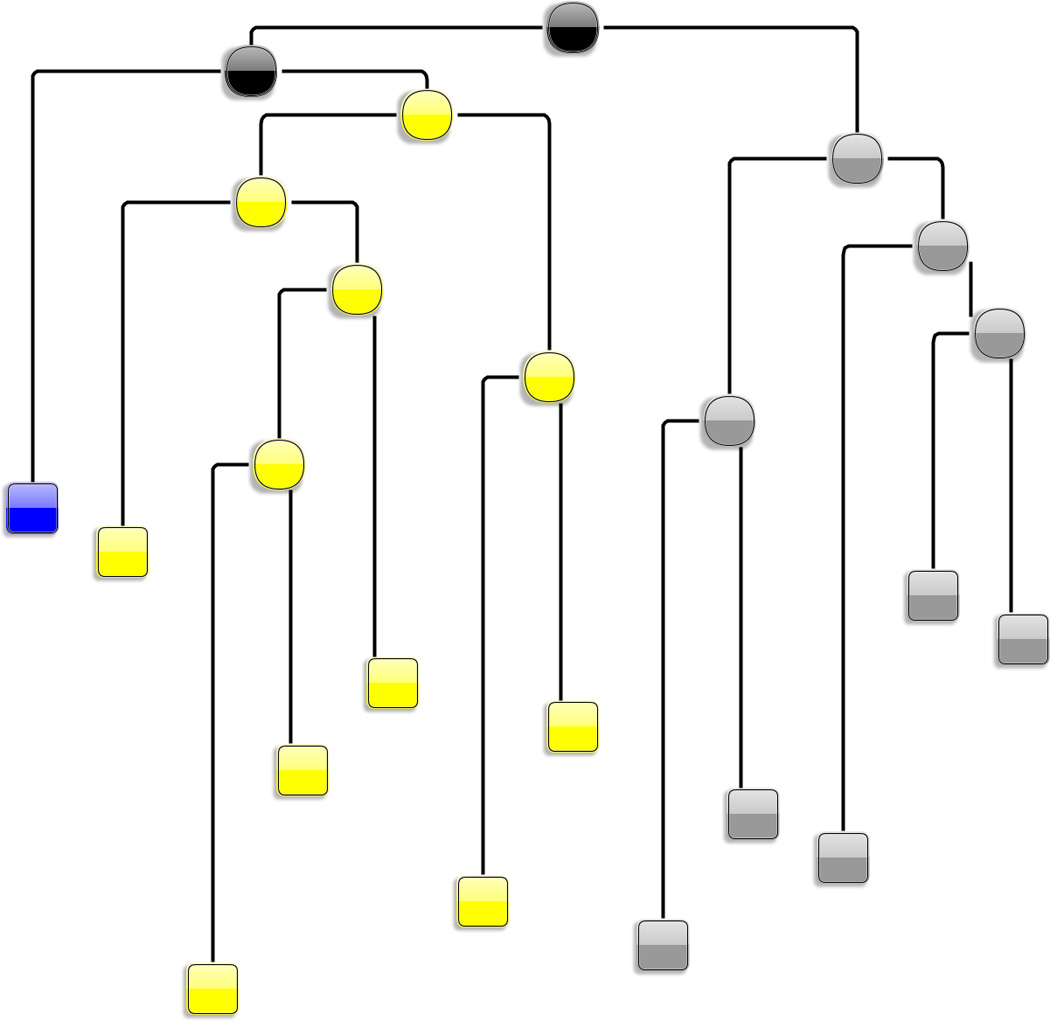
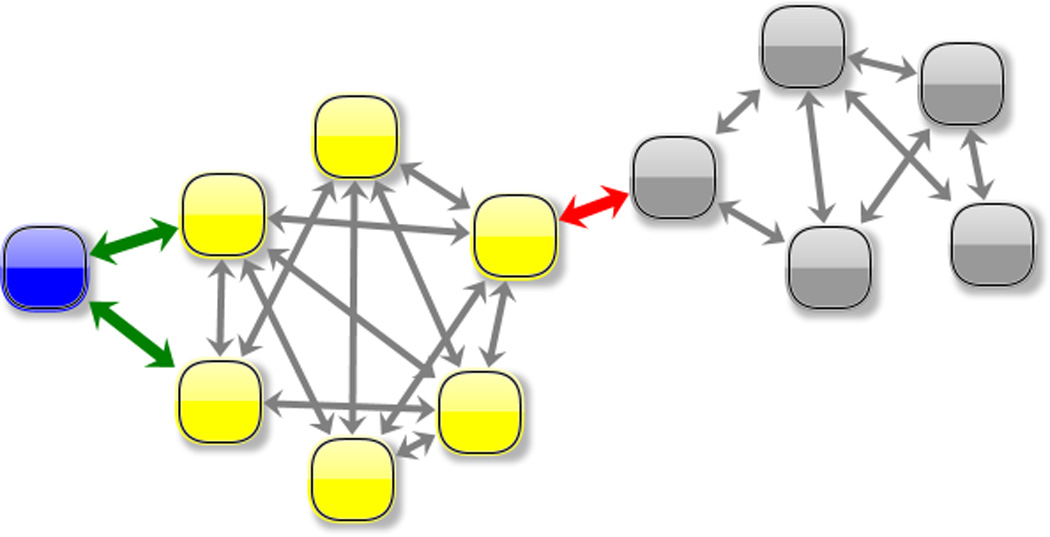
Identification of the main substates spanned during L1L switching is realized in two steps. In the first step, the purpose is to form a minimum number of clusters that capture essential, structurally distinct states. For that a hybrid clustering scheme that chooses the best number of clusters when the sampled active-docked conformations reside in a single cluster. The hybrid clustering consists of a partitional (“top-down”) followed by a agglomerative (“bottom-up”) stage (see Methods) and can be depicted as a dendrogram, (shown in Supplementary Material). Here (2a), a simplified version of the dendrogram is shown whose leaf nodes (i.e. the nodes at the bottom of the dendrogramand shown as squares) are the 12 clusters that were formed right before all the active-docked conformations were agglomerated into a single cluster. The nodes of the dendogram are placed on the vertical following their discovery order. The simplified dendrogram corresponds to the latest steps of the agglomerative (“bottom-up”) stage of the hybrid clustering procedure. In a second step (2b), a conformational space network (CSN) obtained from the the 12 leaves of the hierarchical tree. CSN’s reveal the topography of the conformational space and free energy landscape: it has been shown that it is likely that nodes in the same free energy basin (substate) are well connected among each other, whereas nodes in different basins (substates) are loosely connected[18]. Based on the connectivity pattern, three major substates (labeled A - “active substate” - blue , I1- “inactive substate 1” - yellow, I2 - “inactive substate 2“ - gray) can be identified/isolated. The links of the graph that correspond to the transitions between these three states are colored in green and red respectively. The partitioning into the three sub-states is supported also by structural similarity. Indeed, merging of these three states (shown as black clusters on the dendrogram) occurs at the latest stages of the clustering scheme.
An initial CSN has been built using this set of 12 clusters (Fig. 2b). Interpreting the groups of nodes that strongly interconnect as forming an attractor or sub-state [18] leads to the identification of three major attractors (Fig.2b): A (“Active sub-state”, colored in blue), I1 (“Inactive sub-state 1”, colored in yellow) and I2 (“Inactive sub-state 2”, colored in gray). Since states A and I2 connect only with I1 it follows that L1L switching follows a 3-states/2-steps mechanism: A ⇌ 1 ⇌ I2.
In order to gain more detailed insight into the structural features that support the transition between the three major states, we build a higher-resolution CSN model from the initial 100 partitional clusters (Fig.3). The higher number of clusters allows a better refinement of the boundary of each major state, and the specific interfaces where transitions occur between the major states (i.e., the nodes of the CSN that share linkages with nodes belonging to 2 or more of the A, I1 or I2 states). Along with the CSN a set of representative structures for each state is shown in Fig.3. Inspection reveals that structures associated with I1 mainly originate from the unfolded active conformation simulations, whereas the the structures included in I2 originate from the undocked inactive state simulations. This implies that the A⇌I1 step corresponds to the docking/undocking of stem C from the active site, whereas the I1⇌I2 step corresponds to the stem C swing.
Figure 3.
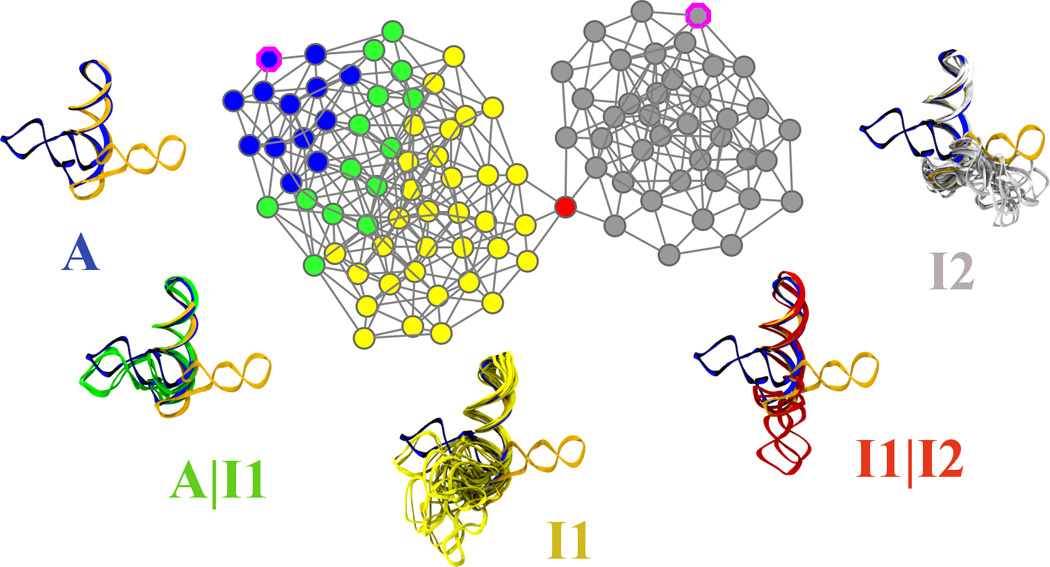
Mapping the L1L switching mechanism using a conformational space network. A conformational space network (CSN) is a graph whose nodes (shown here as circles) are conformations and linkages ( or edges, shown here as lines connecting the circles) represent transitions between them. These transitions are observed during MD simulations. CSN’s are a discrete representation of the states as well as the paths that connect them and can reveal the topography of the conformational space. It is likely that nodes in the same free energy basin are well connected among each other, whereas nodes in different basins are loosely connected[18]. Additionally, finding the nodes that allow two sub-states to connect can reveal the required structural features of that transition to occur. Here we use a CSN built using 100 conformations obtained using a partitional clustering technique described in Materials and Methods. The nodes of the network are colored based on their inclusion into the three main identified substates (A - blue, I1 - yellow or I2 - gray) or at the boundaries (interfaces) between the substates (A|I1 interface - green or I1|I2 interface - red). Clusters belonging to the A and I2 states that contain the two crystallized constructs are marked with a magenta border. Representative sets structures for each of the substates and their corresponding interfaces are shown. For reference all the sets are superimposed on the crystallized conformations, shown here in blue (active) and gray (inactive). All structures are rms-fit using all heavy atoms comprising stems A and B. We find that the overall switching mechanism can be described as a 3-state/2-step process. It is interesting to note that the connection between the three states follows different topographical patterns: the stem C swing (I1⇌I2) step passes through a narrow region of the conformational space network, whereas the allosteric activation step (A⇌I1) covers a much wider region and a more diverse set of pathways through the network.
2.2. Allosteric control mechanism: A⇌I1
The A⇌I1 transition corresponds to the docking/undocking of stem C, through U38 loop, to/from the L1L active site that is non-canonically base paired with the substrate. Both biochemical and crystallographic data [99–101, 104, 105] support the hypothesis that this stem-loop interaction is one of the factors that contribute to the increased L1L ligase catalytic activity and is able to promote the catalytic step. The L1L allosteric control mechanism requires a set of key interactions linked to the presumed active conformation, including non-canonical base pairing between the active site and the substrate, and tertiary interactions between the active site and a distant evolutionarily conserved part of the L1L. Here we account for how each of these factors contributes to the initiation and control of the catalytic step.
Crystallographic data suggests that L1L can exist in (at least) two different conformations, one being presumed to be active and the other inactive[105]. The two conformations differ by a re-orientation of stem C tip by ˜80 Å . Based on analysis of the hydrogen-bonding patterns between the active site and substrate, we have previously shown [48] how the dynamics of the active site exhibits two completely different patterns of conformational variation in the active and inactive forms. More precisely, the catalytic site was shown to span three conformational states in its active form, whereas the dynamics of the inactive form was unimodal. We were able to correlate the different variability patterns with the lack/presence of a hydrogen bond that is typical of a trans Hoogsteen/sugar face base pair formed by A51 and G1/GTP1 (denoted here as A51 □→ G1 following [69]). It s important to note that A51 directly mediates the interaction of the catalytic site with stem C through a canonical base pair with U38, along with phosphate–Mg2+ interactions between G1, A39 and G40, respectively.
Due to the high free energy necessary to disrupt the hydrogen bonds and the phosphate - Mg2+ interactions that are maintain the docked conformer, the conformational changes associated with the undocking of the U38 loop from the active site cannot be realized on the time scales of the present simulations. To overcome this impediment we provoke the undocking by slowly forcing the disruption of the hydrogen bond network sustaining the L1L active conformation (Materials and Methods) and monitor the changes in hydrogen bonding patterns. Fig.4a compares the distributions of the three hydrogen bonds that define a standard A51 □→ G1 base pair in the case of the simulations of the docked/active and undocked/inactive conformations as well as their evolution after the removal of the tertiary contact between stem A and stem C. The distributions of these three hydrogen bonds indicate different characteristic patterns in the active and inactive states. In the case of the docked/active state, the distributions are multi-modal, suggesting the existence of several conformational states and hydrogen bonding patterns, whereas in the case of the inactive/undocked state the distributions are unimodal. The evolution in time of these three hydrogen bonding distances recorded after the disruption of the tertiary contacts between stem A and stem C shows that after almost 50 ns the active site adopts the inactive/undocked dynamical pattern, with the formation of the complete typical trans Hoogsteen/sugar-face base pair between A51 and G1 depicted in Fig. 4b C.
Figure 4.
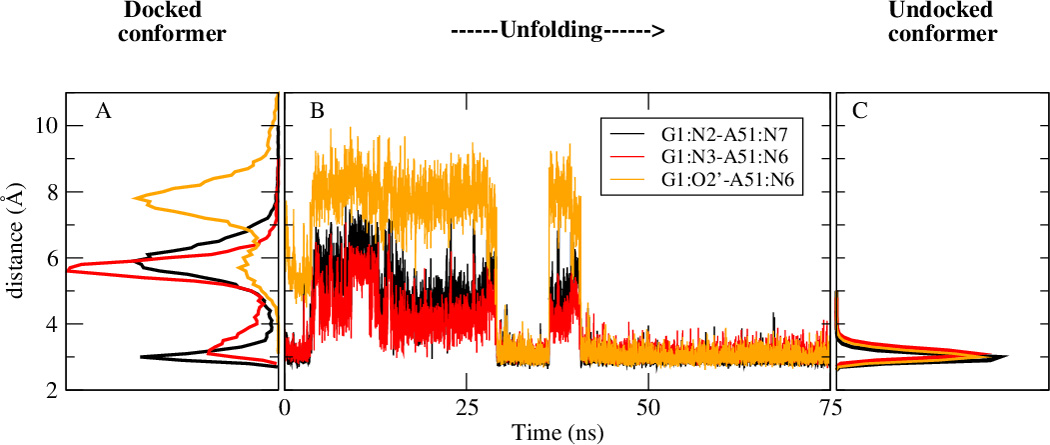
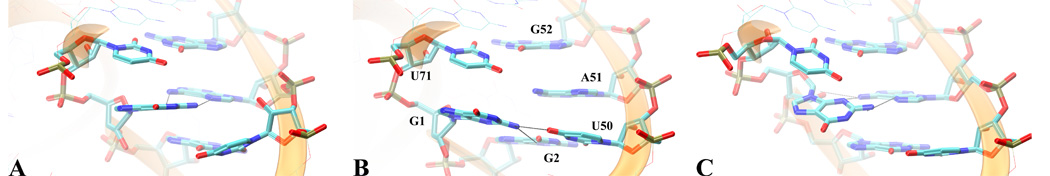
The dynamical signature of the active site changes when transitioning between active (A) to the inactive state (I1). (Top) After removing the contacts between U38 and the active site, the latter recovers the dynamical signature of the inactive /undocked states. (4a)This change is followed in terms of the time series of three important hydrogen bonding distances that are characteristic to a complete A51 □→ G1 (trans-Hoogsteen/sugar edge base pair) specific to the inactive state. On the left the multimodal distribution of these three hydrogen bonding distances specific to the active /docked conformation simulations both in the product as well as in the precursor state. On the right, the same distributions, that are now unimodal in nature, obtained during the molecular dynamics simulations of the inactive/undocked conformer simulations. In the middle the time series evolution of the hydrogen bonding distances, after the unfolding/undocking biasing potential has been removed. It is important to note that the docked and undocked conformer simulation results shown here come from separate unbiased simulations. (Bottom)Three representative snapshots along the unfolding /undocking trajectory. (A, B) Structures that are representative for the active conformation and are the two major conformations identified also in the active precursor simulation [48]. For these two structures G1:O2’ does not make a hydrogen bond with A51:N6, typical for a complete A51 G1. (C) Structure representative for the undocked/inactive conformation, yielding a complete A51 □→ G1 base pair.
The analysis presented here suggests a link between the specific dynamical pattern of the active site hydrogen bond network and the tertiary contacts with stem C. We have shown previously that the formation of these contacts allows the active site to adopt three main conformational states that have been shown to correlate differently with initiation of the first steps of the catalytic process[48]. We noted that only two of these three states allow the formation of a hydrogen bond between U71:HO3′ and GTP1:O2Pα that can support the deprotonation of U71:O3′ which is the first step of the catalyzed 3’ to 5’ ligation reaction[48]. The two states that correlate positively with the U71:O3′ deprotonation require the partial disruption of the incomplete trans Hoogsteen/sugar-face base pair between A51 and G1 that is found in the docked crystal conformation. This suggests the role of the tertiary contacts between the active site and stem C may be to weaken the the A51 □→ G1 base pair to be more easily disrupted, thus facilitating the first step of the catalytic process, i. e. the deprotonation of U71:O3′ . Experimentally, the idea of an intrinsically variable active site is supported by the fact that the optimal base pairing between L1L and its substrate has to be non-canonical[102]. For example, minimal changes of either one of the two GU wobble pairs of the active site to canonical isosteric GC pairs decreases the catalytic activity L1L 20 times[102].
2.3. Stem C swing: I1⇌I2
The I1 ⇌ I2 conformational transition corresponds to the swing of stem C from the vicinity of the inactive conformation isolated in the crystal (I2 sub-state) structure (I2 sub-state) to one that brings U38 loop in close proximity of the active site (I1 substate). The necessity of this large conformational transition to support the L1 catalytic mechanism is suggested by structures of the two crystallized conformers [105]. The supporting hinge points were located in restricted regions of the L1L three-way junction, and could be mapped to changes of only two virtual torsions (θ18 and θ44, see Materials and Methods for details) [48].
The location of the interface between I1 and I2 sub-states is marked in red on the conformational space network shown in Fig.3 along with some representative structures. It is interesting to note that the interfaces between the A, I1 and I2 sub-states differ significantly in the variety of structures and of the corresponding interconnecting paths. Whereas the A|I1 interface contains a set of 14 nodes, the I1| I2 interface contains only one. Also the standard deviations of the angular distances with respect to crystal structures of the two interfaces (Table1) show that the variability with respect to stem A and B is larger for A|I1 interface. This suggests that the conformational space occupied by the A|I1 interface is larger than than that occupied by the I1| I2 interface. In other words, the connection between the three states follows two patterns: the stem C swing step passes through a narrow region of the conformational space network, whereas the allosteric activation step covers a much wider region and a more diverse set of pathways through the network.
Table 1 .
Structural parameters of the three substates. Average angular distances (ang(X, Y) in degrees) and their standard deviations between the characteristic vectors (v) of stem C of in the A,I1, I2 states and the two crystallized conformers. Superscripts denote the the stems (stem A, stem B, stem C) and subscripts denote the corresponding conformational states (cr, a and cr, i stand for the active and inactive crystallized conformers and A,I1, I2 for the three substates extracted from MD simulations). Prior to calculating the characteristic vectors all the structures were rms-fit using all heavy atoms of stem A, giving rise to structural arrangements as those shown in Fig. 3. For the definition of the characteristic vectors of each stem see Methods.
| (X,Y) | ang(X, Y) | |
|---|---|---|
| 110.4 (10.7) | ||
| 130.6(11.8) | ||
| 140.3(15.5) | ||
| 125.4(5.0) | ||
| 114.8(32.6) | ||
|
|
81.4(10.5) | |
| 61.3(11.3) | ||
|
|
49.5(15.9) | |
| 50.6(5.4) | ||
| 65.5 (23.2) | ||
| 25.3 (9.0) | ||
| 48.7(7.0) | ||
| 67.1(16.9) | ||
| 119.8(4.7) | ||
| 96.0(42.5) | ||
| 158.1(10.7) | ||
| 146.9(10.2) | ||
|
|
132.0 (15.9) | |
| 77.7(4.7) | ||
| 95.0(50.0) | ||
In order to obtain a greater insight into what are the structural features that support the transition between the two states, we analyze the distribution of θ44 as function of the depth from the I1| I2 interface node . In Fig. 5a the distribution of the θ44 virtual torsion angle is shown as function of the depth from the I1| I2 interface node of the conformational space network. The depth 1 set contains the interface node direct neighbors and the depth 2 set contains the direct neighbors as well as the second layer of neighbors of the interface node. It can be observed that, as expected, the number of samples increases from the depth 1 to depth 2 selections, however the region of the torsion space located approximately between -10 and 0 degrees remains approximately with the same number of samples. This indicates that θ44 traverses this specific interval only when the structures are located at the interface node and its immediate neighbor nodes. In order for the transition from the I1 to I2 to occur, θ44 has to pass through this interval. This result is consistent with our previous hypothesis [48] that θ44 has to travel along an arc of 232 degrees in the transition from active/docked to inactive/undocked conformational states.
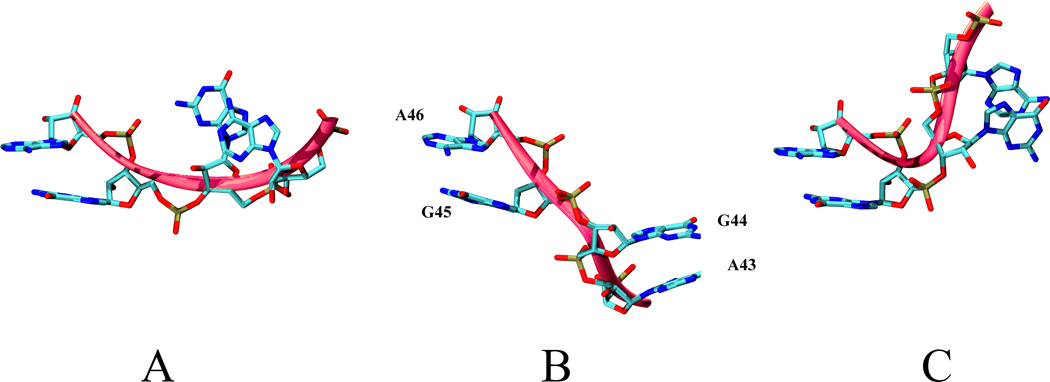
Figure 5.
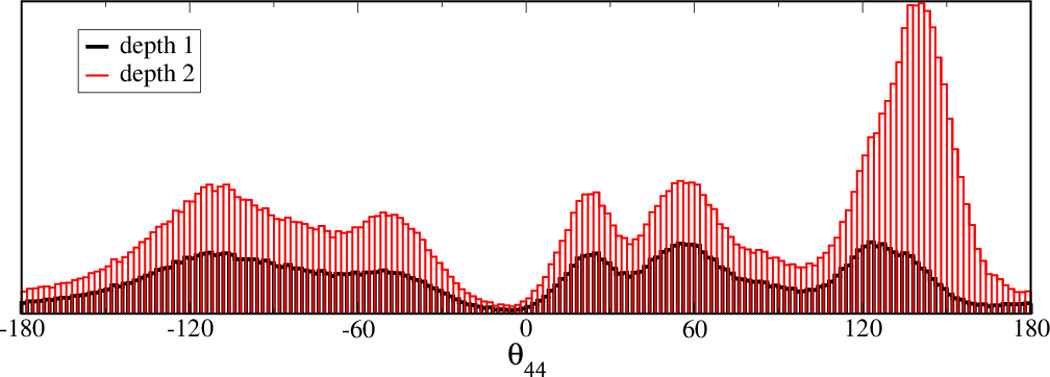
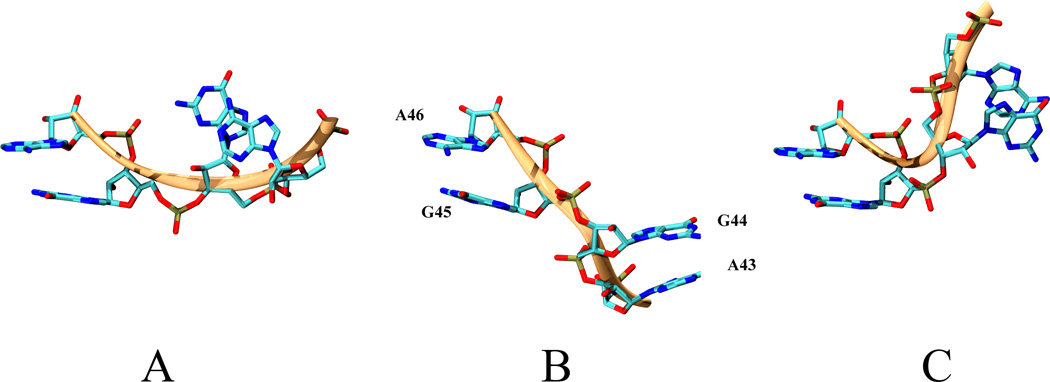
The transition between I1 and I2 substates is supported by θ44 virtual torsion (A43-G44-G45-A46). (5a) The distribution of θ44 in the vicinity of the the I1 – I2 interface node shows that θ44 has to traverse the - 10 to 0 degree interval to allow the transition from I1 to I2. The UN-normalized distributions of θ44 for two sets of nodes of the CSN shown in are shown. The depth1 set includes all the nodes that are at 1 edge distance from the interface node. The depth 2 set includes all the nodes that are a distance of 2 edges or less from the interface node. (5b)Representative conformations of the region spanned by θ44 of the three-way junction along the conformational switch pathway. A) conformation specific to the vicinity of the active conformation, B) conformation located on the -10:0 interval of θ44, C) conformation specific to the vicinity of the crystallized active conformation. The backbone is shown in green and corresponds to the region spanned by θ44 on L1L backbone in Fig. 1.
In Fig. 3 we show representative conformations of the part of the three–way junction that is spanned by θ44 along the stem C swing. It can be observed the G44 and A43 undergo a significant repositioning with respect to A46 and G45, which are the constituents of the highly canonical and, consequently, relatively rigid stem A. The transition is taking place through modifications of the backbone and without a change in the base pairing or hydrogen bonding patterns. Experimentally, G44 and A43 have been shown to be a part of a 5 basis motif located on the three-way junction that is highly sensitive to mutations [99–101, 104]. The present simulations also show θ18 to have large flexibility. However, this is not necessarily correlated with the stem C orientation (data not shown).
2.4. Comparison to conformational transitions of other ribozymes
RNA molecules have ability to respond to their environment through changes at the secondary or tertiary level to accomplish their role in translation, transcription, post-transcriptional processing, viral replication, specific binding, assembly of the ribosome, and catalysis. RNA can be designed to respond through conformational or catalytic events to proteins, nucleic acids, metal ions, metabolites, vitamins, changes in temperature, and even RNA biosynthesis itself. [30, 51] It has been shown it is possible to engineer L1L constructs whose catalytic activity can be controlled by small molecules, peptides, or even proteins[99–101, 104].
L1L dynamics, whose complexity can be captured with the CSN representation, should contribute to the recent efforts to explore the RNA folding landscape[25, 115, 123, 124] or the topological restraints of RNA junctions[4, 6]. Three way junctions[70, 72] with tertiary contacts[27] - the L1L fold - are recurrent and versatile folds for RNA function and the characterization of L1L dynamics in solution can help us understand their important role in RNA dynamics. The use of virtual torsions to distinguish between different folds is “a new way to see RNA” [64]. We show here and elsewhere[48] that virtual torsions can be used to distinguish between L1L conformations in the crystal as well as in solution. The Mg2+ mediated tertiary contact between the L1L catalytic site and a evolutionarily conserved loop on stem C (see Fig 1) should contribute the recent efforts to understand role of ions for maintaining RNA fold(s) and ability to promote catalysis[31, 32].
We can draw parallels between L1L conformational transition and presumed catalytic mechanism of other ribozymes, such as hammerhead ribozyme (HHR) and the recently crystallized class I RNA polymerase (CIRP)[92, 114]. Both HHR and L1L have an active and inactive states but the sequences and structures are completely different, and the conformational changes they undergo are also unique. HHR “open”, pre-catalytic state, was captured in several X-Ray crystal structures of the “minimal” HHR[34, 43, 82, 83, 93, 111, 112], whereas the “closed”, presumably catalytically active state, was captured in the form of the “full-length” HHR[75, 76]. HHR does not, strictly speaking, require divalent metal ions for catalysis[26, 81], whereas L1L has a very specific requirement for a Mg2+ at the active site[99–101, 104, 105]. The crystallographically observed active site divalent metal ion binding mode is identical in the minimal and full-length HHR indicating that this ion is present in both active and inactive states and may play a role in stabilizing the tertiary contacts of the former[76]. In contrast, a Mg2+ion is bound in the active site only in the presumed active conformation[105]. In the case of the catalytic step, computational investigations suggested that when bound in the active site Mg2+ can lower the pKa of a secondary alcohol to initiate the general base step of catalysis[68, 122]. Structural data obtained from molecular dynamics of the reactant state of L1L [48] implied that aMg2+ resolved in the crystal structure can lower the pKa of the HO3’ of the substrate through direct coordination.
CIRP is a synthetic ribozyme that catalyzes the same reaction as L1L although with multiple catalytic turnovers as a direct result of the in vitro evolutionary optimization. Both ribozymes X-ray structures have a Mg2+ ion resolved near the catalytic site. For both ribozymes an additional Mg2+ has been proposed to stabilize a triphosphate group in the active site as suggested by analysis of CIRP crystal structure [92, 114] and theoretical investigations on L1L and CIRP[48, 113] These findings fit in a much larger context of DNA and RNA polymerases, nucleases and transposases for which the proximity of two Mg2+ to the active site has been proposed to enhance substrate recognition and catalytic specificity[126].
An important question is how one can translate the current simulation results into experimentally testable hypothesis. Previous studies on other RNA systems were able able to extract structural and dynamical information using NMR, FRET, SAXS, time resolved and single molecule experiments [1, 8, 51, 94, 98, 117, 127, 131] to explore global and local changes in the secondary and tertiary structure similar to those undergone by L1L. In this work (i) we identify a dynamical set of hydrogen bonding patterns in the active site that change when L1L reaches its activated state and (ii) provide a comprehensive structural characterization of the three proposed L1L sub-states using relative angles between the three stems (1). These are observables that can be readily obtained from the aforementioned experimental techniques and can serve in testing our results.
3. Materials and Methods
Molecular system setup
Initial ribozyme structures were taken from a 2.6 Å resolution crystal structure of two co-crystallized L1 ligase ligation product conformers (PDBID:2OIU) [105] and equilibrated structures from previously reported simulations[48]. The ribozyme was then immersed in a rhombododecahedral TIP3P [61] water box with and edge length of 120 Å. The ionic atmosphere consisted of Na+ and Cl− ions that were added at random positions at least 5.0 Å away from any RNA atom to neutralize the system and reach the physiologic concentration of 0.14 M. The total number of particles in the system was 104,000.
Molecular dynamics simulation protocol
Simulations were performed with the NAMD simulation package (version 2.7) [91] using the all-atom Cornell et al. force field (parm99) [23], generated with the AMBER 10 package [19, 20, 90] and TIP3P water model.[61] Periodic boundary conditions were used along with the isothermal-isobaric ensemble (NPT) at 1 atm and 300 K using Nos-Hoover-Langevin pressure piston control [44, 77] with a decay period of 100.0 fs and a damping time scale of 50 fs, and the Langevin thermostat with a damping coefficient of 0.1 ps−1. The smooth particle mesh Ewald (PME) method [40, 108] was employed with a B-spline interpolation order of 6 and the default κ value used in NAMD. The FFT grid points used for the lattice directions were chosen using ~1.0 Å spacing. Non-bonded interactions were treated using an atom-based cutoff of 12.0 Å with switching of non-bond potential beginning at 10.0 Å. Numerical integration was performed using the leap-frog Verlet algorithm with 1 fs time step. [2] Covalent bond lengths involving water hydrogens were constrained using the SHAKE algorithm. [107]
Equilibration procedure
The initial system first underwent 5000 steps of energy-minimization, then the solute (RNA) atoms were kept fixed, letting the water and counter ions and coions to be equilibrated for 15 ns. The solute atom positions were then energy-minimized and then were allowed to move under harmonic restraints over 5 ns. The initial harmonic force constant was 5.0 kcal mol−1 and exponentially released over 5 ns. The whole system was energy-minimized, followed by an unconstrained dynamics simulation beginning from 30 K under constant pressure of 1 atm. The temperature then was increased to 300 K at the rate of 5 K per 10 ps. The motions and relaxation of solvent and counter- and co-ions are notoriously slow to converge in nucleic acid simulations, [95] and careful equilibration is critical. For each simulation, a total of 20 ns of equilibration (15 ns of water/ion relaxation and 5 ns of solvent and structure relaxation) was carried out before production of the trajectory used for analysis.[95]
Analysis
Analysis of the trajectories was carried out using VMD (version 1.8.7). [54] L1 Ligase Stem A (A) was defined as residues 1 to 7 and 45 to 71, stem B (B) residues 8 to 17, and stem C (C) residues 18 to 44 and the junction (J) residues 6 to 10 and 15 to 22 and 39 to 47. For structural comparison, we do not include any of the three GAAA tetraloops since they were introduced in L1 ligase structure for crystallization purposes.[105] The virtual torsions [33, 119] are designated as follows: ηn is the virtual torsion angle defined by the atoms C4’n−1, Pn, C4’n and Pn+1; θn is the virtual torsion angle defined by the atoms Pn, C4’n, Pn+1 and C4’n+1, where n indicates the corresponding nucleotide residue number. In addition, for each stem, a characteristic vector is defined as follows: 1) we choose two adjacent canonical base pairs (i and j)[69], and for each we define a vector that is determined by the positions of the C1’ atoms (vi, vj) 2) the characteristic vector is defined as the cross product of the two vectors: .
The characteristic vector of each stem can be used to describe their relative positions and appears to be a sufficient descriptor for the L1L structure since individual stem keeps its domain structure reasonably rigid in the time scale of our simulations. The major hinge points are located in the restricted region of the junctions between stems[48]. Across this work we make use of the characteristic vector of stem C. The two adjacent canonical base-pairs that were chosen to define were U20-A41 and C21=G40. Prior to the calculation of the characteristic vectors, all structures are RMS-fitted against the position of stem A in the undocked crystallized conformer.
Focused sampling on networks (FSN) method
FSN creates a network to represent the connectivity between the conformational states and identifies the most under-sampled nodes that reside on pathways connecting the stable sub-states along the network. These nodes are used as launching points for swarms of trajectories [46, 88, 89] to enhance sampling and statistical analysis of these regions. The FSN method is an iterative procedure, with the following steps (see also Fig. 6):
Build a connected network of conformational states from the accumulated simulation structures. Each network node represents a cluster node from a partitional incremental k-way clustering procedure of the entire set of simulation structures.
Evaluate the sampling density for each node. The sampling density of each node is estimated through counting the number of simulation structures within a threshold distance from the centroid of the node.
Evaluate the traversal count for each node, by determining how many times the node is traversed by all the shortest paths between all the nodes of the network using the Floyd-Warshall algorithm [45, 120].
Select launching points for the next round of swarm of trajectories. The nodes with lowest sampling density and highest traversal counts are chosen as launching points for the next swarm of trajectories.
Figure 6.
To focus the sampling around relatively unexplored/under–sampled regions of the conformational space that might reside along the L1L switching pathway we designed an iterative strategy (FSN – Focused Sampling on Networks). The projection of the structures on a set of order parameters (6a) is clustered using an incremental partitional 300-way clustering technique (see Materials and Methods). Data points belonging to the same cluster have the same color. A network is built so that each one of the previously determined clusters is assimilated with a node (6b). Each node being connected to its closest 8 neighbors using a cosine similarity/distance-based function(6c). For each of the clusters a sampling density is calculated that is displayed here using red-blue color map, the red corresponding to low densities whereas the blue corresponds to the high densities(6d). Each of the network nodes is associated a traversal count, i.e. number of times it is crossed by all the shortest paths along the graph between all the nodes of the graph (6e). A similar red-blue color map is used here, with red corresponding to lower values and blue corresponding to a higher values of the traversal counts. The swarm of trajectories launching points (here colored in green) are chosen as the nodes that have a low sampling density and have a high traversal counts (6f).
In this work we use 300 nodes to build the FSN network obtained from a incremental partitional clustering of the characteristic vectors of stem C. The distance between nodes of the FSN network is the cosine-similarity and the network is built by connecting each node with its closest eight neighbor nodes. For our specific case this is a criterion to assure the building of a connected network (i.e. a network with the property that there exists at least one path connecting any two nodes). For every iteration step of the FSN procedure, a set of 5 launching points are selected for a trajectory swarm. A molecular dynamics simulation is started with the coordinates and velocities from each specific FSN iteration point. The number of nodes used to build the FSN network (300) was chosen anticipating the need for better isolation the origin of the swarm of trajectories, a decision made before data collection. As the CSN built after data collection shows, the number of clusters needed to isolate the interface nodes can be lower (100).
Swarms of trajectories have been used before in conjunction with so-called string methods enhanced sampling techniques. [35, 36, 46, 73, 89] Other methods have been used to study thermodynamic or kinetic aspects conformational transitions of nucleic acids using an explicit treatment of solvent and ionic atmosphere. For example, combinations of umbrella sampling[118], targeted molecular dynamics[22, 80, 109], transition path sampling[12, 28], nudged elastic band[60], replica exchange[116] or long molecular dynamics simulation were applied to RNA hairpins folding[13, 29], DNA A to B form transition[7, 86] or local openings of duplexes [10, 50, 53]. Other methods such as milestoning[42] or stochastic path approach[38, 42] have been used to study other types of biomolecular systems.
Clustering
All clustering calculations were performed with CLUTO [63] software. The k-way incremental partitional clustering scheme used here is realized using k-1 repeated bisections, followed by a global optimization of the solution. It is a top-down clustering approach. The algorithm maximizes the cosine similarity function between each data point and the centroid of the cluster that is assigned to. The clustering procedure is repeated 20 times to avoid local minimums of the overall similarity function.[128] During agglomerative clustering each of the objects are initially assigned to their own cluster and then pairs of clusters are repeatedly merged based on the same similarity function until all the initial objects are grouped in one cluster. Agglomerative clustering is a bottom-up procedure. Hybrid schemes that in the first stage clusters the data using a partitional method and in the second use agglomerative method are called constrained agglomerative algorithms and have been shown to efficiently lead to better solutions than partitional or agglomerative schemes alone. [130]
Network manipulation, rendering and analysis was carried out with NAViGaTOR [16, 79] and yED graph editor (yFiles software, Tubingen, Germany). Shortest path searches between all the nodes of the network as well as the determination of the traversal counts were done using a Floyd-Warshall algorithm [45, 120] as implemented in NAViGaTOR.
Forced unfolding/undocking simulation
The unfolding simulation of stem C from the active site starting from the docked conformation was prepared as described previously [48], except that a biasing potential was added to disrupt the canonical base pair between U38 and A51. The unfolding biasing potential is a step-like potential of 5 kcal/mol turned on gradually from 3.5 Å to 5.0 Å during a 15 ns simulation period. During this period the base pairing of the active site was restrained using harmonic potentials (using a spring constants of 5 kcal/molÅ2) centered at the equilibrium values specific to the hydrogen binding pattern found in crystal.
4. Conclusion
L1 ligase (L1L) is a synthetic in vitro selected ribozyme that catalyzes regiospecific formation of 3′ to 5′ phosphodiester linkages, a reaction characteristic of all extant present-day RNA and DNA protein polymerases. The L1L allosterically controlled catalytic mechanism is a complex process consisting of large-scale conformational motions of several flexible constitutive structural motifs, such as a three-way junction and a bulged loop that is able to form tertiary distant contacts with a non-canonically base-paired, flexible active site. This is an intriguing set of properties that make L1L unique and the understanding of L1L catalytic mechanism appealing. L1L exhibits a high degree of conformational flexibility suggested by its crystal structure that reveals two largely different conformations that differ by a re-orientation of one of the stems by 80 Å. It is of great interest, therefore, to gain further insight into the nature of these two states in solution and the set of pathways that allow their interconversion, as well as understand the manner in which this inherent flexibility can assist in promoting catalysis. In a first paper[48] we identified the hinge points responsible for L1L activation that are located in restricted regions and can be characterized by a restricted set of virtual torsions. In this work we report a comprehensive characterization of the conformational landscape of L1L using an enhanced sampling method coined Focus Sampling on Networks. Using data from more than 1 micro-second of simulations, we employed network theory and analysis of conformational space networks to identify the essential 3-state/2-step process whereby the L1L can transition between catalytically active and inactive states. In the first step, we show that the docking of stem C, through the U38 loop, disrupts the A51 □→ G1 base pair and elicits the adoption of the two active site conformations with high probabilities of initiating the catalytic process. In the second step, the degree of conservation of the L1L three way junction spanned by the θ44 virtual torsion is directly correlated with the stem C swing between the I2 to I1 states. This work provides deep insights into the molecular mechanism of allosteric control that may be useful in guiding the design of ribozyme based biotechnology, and that have important evolutionary implications.
Supplementary Material
Highlights.
We characterize the conformational landscape of a catalytic riboswitch
Long large scale molecular dynamics simulations of a synthetic ribozyme
Mapping the conformational switch of L1 Ligase ribozyme
Acknowledgements
The authors are grateful for financial support provided by the National Institutes of Health (GM084149 to DMY and 5R01GM087721-11 to WGS). Computational resources were provided by the Minnesota Supercomputing Institute and the National Science Foundation (TeraGrid grant TG-CHE100072).
Footnotes
Publisher's Disclaimer: This is a PDF file of an unedited manuscript that has been accepted for publication. As a service to our customers we are providing this early version of the manuscript. The manuscript will undergo copyediting, typesetting, and review of the resulting proof before it is published in its final citable form. Please note that during the production process errors may be discovered which could affect the content, and all legal disclaimers that apply to the journal pertain.
Contributor Information
George M. Giambaşu, Email: giambasu@biomaps.rutgers.edu, BioMaPS Institute and Dept. of Chemistry & Chemical Biology, Rutgers University, Piscataway, New Jersey 08854, United States.
Tai-Sung Lee, Email: taisung@biomaps.rutgers.edu, BioMaPS Institute and Dept. of Chemistry & Chemical Biology, Rutgers University, Piscataway, New Jersey 08854, United States.
William G. Scott, Email: wgscott@ucsc.edu, Center for the Molecular Biology of RNA and The Department of Chemistry and Biochemistry, University of California, Santa Cruz, Santa Cruz, California 95064, United States.
Darrin M. York, Email: york@biomaps.rutgers.edu, BioMaPS Institute and Dept. of Chemistry & Chemical Biology, Rutgers University, Piscataway, New Jersey 08854, United States.
References
- 1.Al-Hashimi HM, Walter NG. RNA dynamics: it is about time. Curr. Opin. Struct. Biol. 2008 Jun;18(3):321–329. doi: 10.1016/j.sbi.2008.04.004. [DOI] [PMC free article] [PubMed] [Google Scholar]
- 2.Allen M, Tildesley D. Computer Simulation of Liquids. Oxford: Oxford University Press; 1987. [Google Scholar]
- 3.Bagby SC, Bergman NH, Shechner DM, Yen C, Bartel DP. A class I ligase ribozyme with reduced Mg2+ dependence: Selection, sequence analysis, and identification of functional tertiary interactions. RNA. 2009;15:2129–2146. doi: 10.1261/rna.1912509. [DOI] [PMC free article] [PubMed] [Google Scholar]
- 4.Bailor MH, Mustoe AM, Brooks CL, Al-Hashimi HM. Topological constraints: using RNA secondary structure to model 3D conformation, folding pathways, and dynamic adaptation. Curr. Opin. Struct. Biol. 2011 Jun;21(3):296–305. doi: 10.1016/j.sbi.2011.03.009. [DOI] [PMC free article] [PubMed] [Google Scholar]
- 5.Bailor MH, Sun X, Al-Hashimi HM. Topology links RNA secondary structure with global conformation, dynamics, and adaptation. Science. 2010 Jan;327(5962):202–206. doi: 10.1126/science.1181085. [DOI] [PubMed] [Google Scholar]
- 6.Bailor MH, Sun X, Al-Hashimi HM. Topology links RNA secondary structure with global conformation, dynamics, and adaptation. Science. 2010 Jan;327(5962):202–206. doi: 10.1126/science.1181085. [DOI] [PubMed] [Google Scholar]
- 7.Banavali NK, Roux B. Free Energy Landscape of A-DNA to B-DNA Conversion in Aqueous Solution. J. Am. Chem. Soc. 2005;127:6866–6876. doi: 10.1021/ja050482k. [DOI] [PubMed] [Google Scholar]
- 8.Bardaro MF, Varani G. Examining the relationship between RNA function and motion using nuclear magnetic resonance. Wiley interdisciplinary reviews. RNA. 2011;3(1):122–132. doi: 10.1002/wrna.108. [DOI] [PubMed] [Google Scholar]
- 9.Bartel DP, Szostak JW. Isolation of new ribozymes from a large pool of random sequences. Science. 1993 Sep;261(5127):1411–1418. doi: 10.1126/science.7690155. [DOI] [PubMed] [Google Scholar]
- 10.Bergonzo C, Campbell AJ, de los Santos C, Grollman AP, Simmerling C. Energetic Preference of 8-oxoG Eversion Pathways in a DNA Glycosylase. J. Am. Chem. Soc. 2011;133(37):14504–14506. doi: 10.1021/ja205142d. [DOI] [PMC free article] [PubMed] [Google Scholar]
- 11.Böde C, Kovács Ia, Szalay MS, Palotai R, Korcsmáros T, Csermely P. Network analysis of protein dynamics. FEBS Lett. 2007 Jun;581(15):2776–2782. doi: 10.1016/j.febslet.2007.05.021. [DOI] [PubMed] [Google Scholar]
- 12.Bolhuis PG, Chandler D, Dellago C, Geissler PL. Transition path sampling: throwing ropes over rough mountain passes, in the dark. AnnuRevPhysChem. 2002 Jan;53:291–318. doi: 10.1146/annurev.physchem.53.082301.113146. [DOI] [PubMed] [Google Scholar]
- 13.Bowman GR, Huang X, Yao Y, Sun J, Carlsson G, Guibas LJ, Pande VS. Structural Insight into RNA Hairpin Folding Intermediates. J. Am. Chem. Soc. 2008;130(30):9676–9678. doi: 10.1021/ja8032857. [DOI] [PMC free article] [PubMed] [Google Scholar]
- 14.Bowman GR, Pande VS. Protein folded states are kinetic hubs. Proc. Natl. Acad. Sci. U.S.A. 2010 Jun;107(24):10890–10895. doi: 10.1073/pnas.1003962107. [DOI] [PMC free article] [PubMed] [Google Scholar]
- 15.Bowman GR, Voelz VA, Pande VS. Taming the complexity of protein folding. Curr. Opin. Struct. Biol. 2011 Feb;21(1):4–11. doi: 10.1016/j.sbi.2010.10.006. [DOI] [PMC free article] [PubMed] [Google Scholar]
- 16.Brown KR, Otasek D, Ali M, McGuffin MJ, Xie W, Devani B, van Toch IL, Jurisica I. NAViGaTOR: Network Analysis, Visualization and Graphing. Bioinformatics. 2009 Dec;25(24):3327–3329. doi: 10.1093/bioinformatics/btp595. [DOI] [PMC free article] [PubMed] [Google Scholar]
- 17.Bunka DHJ, Stockley PG. Aptamers come of age – at last. Nat. Rev. Microbiol. 2006 Aug;4(8):588–596. doi: 10.1038/nrmicro1458. [DOI] [PubMed] [Google Scholar]
- 18.Caflisch A. Network and graph analyses of folding free energy surfaces. Curr. Opin. Struct. Biol. 2006 Feb;16(1):71–78. doi: 10.1016/j.sbi.2006.01.002. [DOI] [PubMed] [Google Scholar]
- 19.Case D, Darden T, Cheatham T, III, Simmerling C, Wang J, Duke R, Luo R, Crowley M, Walker R, Zhang W, Merz K, Wang B, Hayik S, Roitberg A, Seabra G, Kolossváry I, Wong K, Paesani F, Vanicek J, Wu X, Brozell S, Steinbrecher T, Gohlke H, Yang L, Tan C, Mongan J, Hornak V, Cui G, Mathews D, Seetin M, Sagui C, Babin V, Kollman P. AMBER 10. San Francisco: University of California, San Francisco; 2002. [Google Scholar]
- 20.Case DA, Cheatham TE, III, Darden T, Gohlke H, Luo R, Merz KM, Onufriev A, Simmerling C, Wang B, Woods RJ. The Amber biomolecular simulation programs. J. Comput. Chem. 2005;26:1668–1688. doi: 10.1002/jcc.20290. [DOI] [PMC free article] [PubMed] [Google Scholar]
- 21.Chen X, Li N, Ellington AD. Ribozyme Catalysis of Metabolism in the RNA World. Chem. Biodivers. 2007;4:633–655. doi: 10.1002/cbdv.200790055. [DOI] [PubMed] [Google Scholar]
- 22.COLUZZA I, SPRIK M, CICCOTTI G. Constrained reaction coordinate dynamics for systems with constraints. Mol. Phys. 2003 Sep;101(18):2885–2894. [Google Scholar]
- 23.Cornell WD, Cieplak P, Bayly CI, Gould IR, Ferguson DM, Spellmeyer DC, Fox T, Caldwell JW, Kollman PA. A second generation force field for the simulation of proteins, nucleic acids and organic molecules. J. Am. Chem. Soc. 1995;117:5179–5197. [Google Scholar]
- 24.Crick FH. The origin of the genetic code. J. Mol. Biol. 1968 Dec;38(3):367–379. doi: 10.1016/0022-2836(68)90392-6. [DOI] [PubMed] [Google Scholar]
- 25.Cruz JA, Westhof E. The dynamic landscapes of RNA architecture. Cell. 2009 Feb;136(4):604–609. doi: 10.1016/j.cell.2009.02.003. [DOI] [PubMed] [Google Scholar]
- 26.Curtis EA, Bartel DP. The hammerhead cleavage reaction in monovalent cations. RNA. 2001;7:546–552. doi: 10.1017/s1355838201002357. [DOI] [PMC free article] [PubMed] [Google Scholar]
- 27.de la Peña M, Dufour D, Gallego J. Three-way RNA junctions with remote tertiary contacts: a recurrent and highly versatile fold. RNA. 2009 Nov;15(11):1949–1964. doi: 10.1261/rna.1889509. [DOI] [PMC free article] [PubMed] [Google Scholar]
- 28.Dellago C, Bolhuis PG, Chandler D. Efficient transition path sampling: Application to Lennard-Jones cluster rearrangements. JChemPhys. 1998;108(22):9236. [Google Scholar]
- 29.DePaul AJ, Thompson EJ, Patel SS, Haldeman K, Sorin EJ. Equilibrium conformational dynamics in an RNA tetraloop from massively parallel molecular dynamics. Nucleic Acids Res. 2010;38(14):4856–4867. doi: 10.1093/nar/gkq134. [DOI] [PMC free article] [PubMed] [Google Scholar]
- 30.Dethoff EA, Chugh J, Mustoe AM, Al-Hashimi HM. Functional complexity and regulation through RNA dynamics. Nature. 2012 Feb;482(7385):322–330. doi: 10.1038/nature10885. [DOI] [PMC free article] [PubMed] [Google Scholar]
- 31.Draper DE. RNA folding: thermodynamic and molecular descriptions of the roles of ions. Biophys. J. 2008 Dec;95(12):5489–5495. doi: 10.1529/biophysj.108.131813. [DOI] [PMC free article] [PubMed] [Google Scholar]
- 32.Draper DE, Grilley D, Soto AM. Ions and RNA folding. Annu. Rev. Biophys. Biomol. Struct. 2005 Jan;34:221–243. doi: 10.1146/annurev.biophys.34.040204.144511. [DOI] [PubMed] [Google Scholar]
- 33.Duarte CM, Pyle AM. Stepping through an RNA structure: A novel approach to conformational analysis. J. Mol. Biol. 1998 Dec;284(5):1465–1478. doi: 10.1006/jmbi.1998.2233. [DOI] [PubMed] [Google Scholar]
- 34.Dunham CM, Murray JB, Scott WG. A helical twist-induced conformational switch activates cleavage in the hammerhead ribozyme. J. Mol. Biol. 2003;332:327–336. doi: 10.1016/s0022-2836(03)00843-x. [DOI] [PubMed] [Google Scholar]
- 35.E W, Ren W, Vanden-Eijnden E. String method for the study of rare events. Phys. Rev. B. 2002 Aug;66(5):052301. doi: 10.1021/jp0455430. [DOI] [PubMed] [Google Scholar]
- 36.E W, Ren W, Vanden-Eijnden E. Finite temperature string method for the study of rare events. J. Phys. Chem. B. 2005 Apr;109(14):6688–6693. doi: 10.1021/jp0455430. [DOI] [PubMed] [Google Scholar]
- 37.Ekland EH, Szostak JW, Bartel DP. Structurally Complex and Highly Active RNA Ligases Derived from Random RNA Sequences. Science. 1995;269:364–369. doi: 10.1126/science.7618102. [DOI] [PubMed] [Google Scholar]
- 38.Elber R, Meller J, Olender R. Stochastic Path Approach to Compute Atomically Detailed Trajectories: Application to the Folding of C Peptide. J. Phys. Chem. B. 1999 Feb;103(6):899–911. [Google Scholar]
- 39.Ellington AD, Szostak JW. In vitro selection of rna molecules that bind specific ligands. Nature. 1990 Aug;346(6287):818–822. doi: 10.1038/346818a0. [DOI] [PubMed] [Google Scholar]
- 40.Essmann U, Perera L, Berkowitz ML, Darden T, Hsing L, Pedersen LG. A smooth particle mesh Ewald method. J. Chem. Phys. 1995;103(19):8577–8593. [Google Scholar]
- 41.Famulok M, Mayer G. Aptamer modules as sensors and detectors. Acc. Chem. Res. 2011 Dec;44(12):1349–1358. doi: 10.1021/ar2000293. [DOI] [PubMed] [Google Scholar]
- 42.Faradjian AK, Elber R. Computing time scales from reaction coordinates by milestoning. J. Chem. Phys. 2004 Jun;120(23):10880–10889. doi: 10.1063/1.1738640. [DOI] [PubMed] [Google Scholar]
- 43.Feig AL, Scott WG, Uhlenbeck OC. Inhibition of the Hammerhead Ribozyme Cleavage Reaction by Site-Specific Binding of Tb(III) Science. 1998;279:81–84. doi: 10.1126/science.279.5347.81. [DOI] [PubMed] [Google Scholar]
- 44.Feller S, Zhang Y, Pastor R, Brooks B. Constant pressure molecular dynamics simulation: The Langevin piston method. J. Chem. Phys. 1995;103:4613–4621. [Google Scholar]
- 45.Floyd RW. Algorithm 97: Shortest path. Commun ACM. 1962;5(6):345. [Google Scholar]
- 46.Gan W, Yang S, Roux B. Atomistic view of the conformational activation of Src kinase using the string method with swarms-of-trajectories. Biophys. J. 2009 Aug;97(4):L8–L10. doi: 10.1016/j.bpj.2009.06.016. [DOI] [PMC free article] [PubMed] [Google Scholar]
- 47.Gfeller D, De Los Rios P, Caflisch A, Rao F. Complex network analysis of free-energy landscapes. Proc. Natl. Acad. Sci. USA. 2007;104:1817–1822. doi: 10.1073/pnas.0608099104. [DOI] [PMC free article] [PubMed] [Google Scholar]
- 48.Giambaşu GM, Lee T-S, Sosa CP, Robertson MP, Scott WG, York DM. Identification of dynamical hinge points of the L1 ligase molecular switch. RNA. 2010 Apr;16(4):769–780. doi: 10.1261/rna.1897810. [DOI] [PMC free article] [PubMed] [Google Scholar]
- 49.Gold L, Janjic N, Jarvis T, Schneider D, Walker JJ, Wilcox SK, Zichi D. Aptamers and the RNA world, past and present. Cold Spring Harb. Perspect. Biol. 2012;4(3):1–9. doi: 10.1101/cshperspect.a003582. [DOI] [PMC free article] [PubMed] [Google Scholar]
- 50.Hagan MF, Dinner AR, Chandler D, Chakraborty AK. Atomistic understanding of kinetic pathways for single base-pair binding and unbinding in DNA. Proc. Natl. Acad. Sci. U. S. A. 2003 Nov;00(24):13922–13927. doi: 10.1073/pnas.2036378100. [DOI] [PMC free article] [PubMed] [Google Scholar]
- 51.Haller A, Soulière MF, Micura R. The dynamic nature of RNA as key to understanding riboswitch mechanisms. Acc. Chem. Res. 2011 Dec;44(12):1339–1348. doi: 10.1021/ar200035g. [DOI] [PubMed] [Google Scholar]
- 52.Han J, Kamber M, Tung AKH. Spatial Clustering Methods in Data Mining: A Survey. In: Miller H, Han J, editors. Geographic Data Mining and Knowledge Discovery. Taylor and Francis; 2001. pp. 1–29. [Google Scholar]
- 53.Hu J, Ma A, Dinner AR. A two-step nucleotide-flipping mechanism enables kinetic discrimination of dna lesions by agt. Proc. Natl. Acad. Sci. U. S. A. 2008 Mar;105(12):4615–4620. doi: 10.1073/pnas.0708058105. [DOI] [PMC free article] [PubMed] [Google Scholar]
- 54.Humphrey W, Dalke A, Schulten K. VMD: Visual Molecular Dynamics. J. Mol. Graphics. 1996;14:33–38. doi: 10.1016/0263-7855(96)00018-5. [DOI] [PubMed] [Google Scholar]
- 55.Ihalainen Ja, Bredenbeck J, Pfister R, Helbing J, Chi L, van Stokkum IHM, Woolley GA, Hamm P. Folding and unfolding of a photoswitchable peptide from picoseconds to microseconds. Proc. Natl. Acad. Sci. U. S. A. 2007 Mar;104(13):5383–5388. doi: 10.1073/pnas.0607748104. [DOI] [PMC free article] [PubMed] [Google Scholar]
- 56.Ihalainen Ja, Paoli B, Muff S, Backus EHG, Bredenbeck J, Woolley GA, Caflisch A, Hamm P. Alpha-Helix folding in the presence of structural constraints. Proc. Natl. Acad. Sci. U. S. A. 2008 Jul;105(28):9588–9593. doi: 10.1073/pnas.0712099105. [DOI] [PMC free article] [PubMed] [Google Scholar]
- 57.Ikawa Y, Tsuda K, Matsumura S, Inoue T. De novo synthesis and development of an RNA enzyme. Proc. Natl. Acad. Sci. USA. 2004;101:13750–13755. doi: 10.1073/pnas.0405886101. [DOI] [PMC free article] [PubMed] [Google Scholar]
- 58.Jaeger L, Wright MC, Joyce GF. A complex ligase ribozyme evolved in vitro from a group I ribozyme domain. Proc. Natl. Acad. Sci. USA. 1999;96:14712–14717. doi: 10.1073/pnas.96.26.14712. [DOI] [PMC free article] [PubMed] [Google Scholar]
- 59.Jain AK, Murty MN, Flynn PJ. Data clustering: a review. ACM Comput Surv. 1999;31(3):264–323. [Google Scholar]
- 60.Jonsson H, Mills G. Nudged elastic band method for finding minimum energy paths of transitions. In: Berne BJ, Ciccotti G, Coker DF, editors. CLASSICAL AND QUANTUMDYNAMICS IN CONDENSED PHASE SIMULATIONS. Ch. 6. 1997. [Google Scholar]
- 61.Jorgensen WL, Chandrasekhar J, Madura JD, Impey RW, Klein ML. Comparison of simple potential functions for simulating liquid water. J. Chem. Phys. 1983;79:926–935. [Google Scholar]
- 62.Joyce GF. A Glimpse of Biology’s First Enzyme. Science. 2007;315:1507–1508. doi: 10.1126/science.1140736. [DOI] [PubMed] [Google Scholar]
- 63.Karypis G. CLUTO: A Clustering Toolkit (release 2.1.2) 2006. [Google Scholar]
- 64.Keating KS, Humphris EL, Pyle AM. A new way to see RNA. Q. Rev. Biophys. 2011 Nov;44(4):433–466. doi: 10.1017/S0033583511000059. [DOI] [PMC free article] [PubMed] [Google Scholar]
- 65.Keefe AD, Pai S, Ellington A. Aptamers as therapeutics. Nat. Rev. Drug. Discov. 2010 Jul;9(7):537–550. doi: 10.1038/nrd3141. [DOI] [PMC free article] [PubMed] [Google Scholar]
- 66.Krivov SV, Karplus M. Hidden complexity of free energy surfaces for peptide (protein) folding. Proc. Natl. Acad. Sci. U. S. A. 2004 Oct;101(41):14766–14770. doi: 10.1073/pnas.0406234101. [DOI] [PMC free article] [PubMed] [Google Scholar]
- 67.Landweber LF, Pokrovskaya ID. Emergence of a dual-catalytic RNA with metal-specific cleavage and ligase activities: The spandrels of RNA evolution. Proc. Natl. Acad. Sci. USA. 1999;96:173–178. doi: 10.1073/pnas.96.1.173. [DOI] [PMC free article] [PubMed] [Google Scholar]
- 68.Lee T-S, Silva Lopez C, Giambaşu GM, Martick M, Scott WG, York DM. Role of Mg2+ in Hammerhead ribozyme catalysis from molecular simulation. J. Am. Chem. Soc. 2008;130(10):3053–3064. doi: 10.1021/ja076529e. [DOI] [PMC free article] [PubMed] [Google Scholar]
- 69.Leontis NB, Stombaugh J, Westhof E. The non-watson-crick base pairs and their associated isostericity matrices. Nucleic Acids Res. 2002;30:3497–3531. doi: 10.1093/nar/gkf481. [DOI] [PMC free article] [PubMed] [Google Scholar]
- 70.Lescoute A, Westhof E. Topology of three-way junctions in folded RNAs. RNA. 2006 Jan;12(1):83–93. doi: 10.1261/rna.2208106. [DOI] [PMC free article] [PubMed] [Google Scholar]
- 71.Li C-B, Yang H, Komatsuzaki T. Multiscale complex network of protein conformational fluctuations in single-molecule time series. Proc. Natl. Acad. Sci. U. S. A. 2008 Jan;105(2):536–541. doi: 10.1073/pnas.0707378105. [DOI] [PMC free article] [PubMed] [Google Scholar]
- 72.Lilley DM. Structures of helical junctions in nucleic acids. QRevBiophys. 2000 May;33(2):109–159. doi: 10.1017/s0033583500003590. [DOI] [PubMed] [Google Scholar]
- 73.Maragliano L, Fischer A, Vanden-Eijnden E, Ciccotti G. String method in collective variables: minimum free energy paths and isocommittor surfaces. J. Chem. Phys. 2006 Jul;125(2):24106. doi: 10.1063/1.2212942. [DOI] [PubMed] [Google Scholar]
- 74.Marshall KA, Ellington AD. Training ribozymes to switch. Nature Struct. Biol. 1999;6(11):992–994. doi: 10.1038/14872. [DOI] [PubMed] [Google Scholar]
- 75.Martick M, Lee T-S, York DM, Scott WG. Solvent structure and hammerhead ribozyme catalysis. Chem. Biol. 2008;15:332–342. doi: 10.1016/j.chembiol.2008.03.010. [DOI] [PMC free article] [PubMed] [Google Scholar]
- 76.Martick M, Scott WG. Tertiary contacts distant from the active site prime a ribozyme for catalysis. Cell. 2006;126(2):309–320. doi: 10.1016/j.cell.2006.06.036. [DOI] [PMC free article] [PubMed] [Google Scholar]
- 77.Martyna GJ, Tobias DJ, Klein ML. Constant pressure molecular dynamics algorithms. J. Chem. Phys. 1994;101:4177–4189. [Google Scholar]
- 78.McGinness KE, Joyce GF. In search of an RNA replicase ribozyme. Chem. Biol. 2003 Jan;10(1):5–14. doi: 10.1016/s1074-5521(03)00003-6. [DOI] [PubMed] [Google Scholar]
- 79.McGuffin MJ, Jurisica I. Interaction techniques for selecting and manipulating subgraphs in network visualizations. IEEE Trans Vis Comput Graph. 2009;15(6):937–944. doi: 10.1109/TVCG.2009.151. [DOI] [PubMed] [Google Scholar]
- 80.Mülders T, Krüger P, Schlitter J. Free energy as the potential of mean constraint force. J. Chem. Phys. 1996 Mar;104(12):4869. [Google Scholar]
- 81.Murray JB, Seyhan AA, Walter NG, Burke JM, Scott WG. The hammerhead, hairpin and VS ribozymes are catalytically proficient in monovalent cations alone. Chem. Biol. 1998;5:587–595. doi: 10.1016/s1074-5521(98)90116-8. [DOI] [PubMed] [Google Scholar]
- 82.Murray JB, Szöke H, Szöke A, Scott WG. Capture and Visualization of a Catalytic RNA Enzyme-Product Complex Using Crystal Lattice Trapping and X-Ray Holographic Reconstruction. Mol. Cell. 2000;5:279–287. doi: 10.1016/s1097-2765(00)80423-2. [DOI] [PubMed] [Google Scholar]
- 83.Murray JB, Terwey DP, Maloney L, Karpeisky A, Usman N, Beigelman L, Scott WG. The Structural Basis of Hammerhead Ribozyme Self- Cleavage. Cell. 1998;92:665–673. doi: 10.1016/s0092-8674(00)81134-4. [DOI] [PubMed] [Google Scholar]
- 84.Noé F, Fischer S. Transition networks for modeling the kinetics of conformational change in macromolecules. Curr. Opin. Struct. Biol. 2008;18:154–162. doi: 10.1016/j.sbi.2008.01.008. [DOI] [PubMed] [Google Scholar]
- 85.Noé F, Horenko I, Schütte C, Smith JC. Hierarchical analysis of conformational dynamics in biomolecules: transition networks of metastable states. J. Chem. Phys. 2007 Apr;126(15):155102. doi: 10.1063/1.2714539. [DOI] [PubMed] [Google Scholar]
- 86.Noy A, Pérez A, Laughton CA, Orozco M. Theoretical study of large conformational transitions in DNA: the B<–>A conformational change in water and ethanol/water. Nucleic Acids Res. 2007;35(10):3330–3338. doi: 10.1093/nar/gkl1135. [DOI] [PMC free article] [PubMed] [Google Scholar]
- 87.Orgel LE. Evolution of the genetic apparatus. J. Mol. Biol. 1968 Dec;38(3):381–393. doi: 10.1016/0022-2836(68)90393-8. [DOI] [PubMed] [Google Scholar]
- 88.Pan AC, Roux B. Building Markov state models along pathways to determine free energies and rates of transitions. J. Chem. Phys. 2008 Aug;129(6):064107. doi: 10.1063/1.2959573. [DOI] [PMC free article] [PubMed] [Google Scholar]
- 89.Pan AC, Sezer D, Roux B. Finding transition pathways using the string method with swarms of trajectories. J. Phys. Chem. B. 2008 Mar;112(11):3432–3440. doi: 10.1021/jp0777059. [DOI] [PMC free article] [PubMed] [Google Scholar]
- 90.Pearlman DA, Case DA, Caldwell JW, Ross WR, Cheatham T, III, DeBolt S, Ferguson D, Seibel G, Kollman P. AMBER, a package of computer programs for applying molecular mechanics, normal mode analysis, molecular dynamics and free energy calculations to simulate the structure and energetic properties of molecules. Comput. Phys. Commun. 1995;91:1–41. [Google Scholar]
- 91.Phillips JC, Braun R, Wang W, Gumbart J, Tajkhorshid E, Villa E, Chipot C, Skeel RD, Kaleé L, Schulten K. Scalable Molecular Dynamics with NAMD. J. Comput. Chem. 2005;26:1781–1802. doi: 10.1002/jcc.20289. [DOI] [PMC free article] [PubMed] [Google Scholar]
- 92.Piccirilli JA, Koldobskaya Y. Crystal structure of an RNA polymerase ribozyme in complex with an antibody fragment. Philos. Trans. R. Soc. Lond. B. Biol. Sci. 2011 Oct;366(1580):2918–2928. doi: 10.1098/rstb.2011.0144. [DOI] [PMC free article] [PubMed] [Google Scholar]
- 93.Pley HW, Flaherty KM, McKay DB. Three-dimensional structure of a hammerhead ribozyme. Nature. 1994;372:68–74. doi: 10.1038/372068a0. [DOI] [PubMed] [Google Scholar]
- 94.Pollack L. Time resolved SAXS and RNA folding. Biopolymers. 2011 Aug;95(8):543–549. doi: 10.1002/bip.21604. [DOI] [PubMed] [Google Scholar]
- 95.Ponomarev SY, Thayer KM, Beveridge DL. Ionmotions in molecular dynamics simulations on DNA. Proc. Natl. Acad. Sci. USA. 2004;101(41):14771–14775. doi: 10.1073/pnas.0406435101. [DOI] [PMC free article] [PubMed] [Google Scholar]
- 96.Prada-Gracia D, nes JG-G, Echenique P, Falo F. Exploring the free energy landscape: from dynamics to networks and back. PLoS Comput. Biol. 2009 Jun;5(6):e1000415. doi: 10.1371/journal.pcbi.1000415. [DOI] [PMC free article] [PubMed] [Google Scholar]
- 97.Rao F, Caflisch A. The protein folding network. J. Mol. Biol. 2004;342:299–306. doi: 10.1016/j.jmb.2004.06.063. [DOI] [PubMed] [Google Scholar]
- 98.Rinnenthal J, Buck J, Ferner J, Wacker A, Fürtig B, Schwalbe H. Mapping the landscape of RNA dynamics with NMR spectroscopy. Acc. Chem. Res. 2011 Dec;44(12):1292–1301. doi: 10.1021/ar200137d. [DOI] [PubMed] [Google Scholar]
- 99.Robertson MP, Ellington AD. In vitro selection of an allosteric ribozyme that transduces analytes to amplicons. Nature Biotech. 1999;17:62–66. doi: 10.1038/5236. [DOI] [PubMed] [Google Scholar]
- 100.Robertson MP, Ellington AD. Design and optimization of effectoractivated ribozyme ligases . Nucleic Acids Res. 2000;28:1751–1759. doi: 10.1093/nar/28.8.1751. [DOI] [PMC free article] [PubMed] [Google Scholar]
- 101.Robertson MP, Ellington AD. In vitro selection of nucleoprotein enzymes. Nature Biotech. 2001;19:650–655. doi: 10.1038/90256. [DOI] [PubMed] [Google Scholar]
- 102.Robertson MP, Hesselberth JR, Ellington AD. Optimization and optimality of a short ribozyme ligase that joins non-Watson-Crick base pairings. RNA. 2001;7:513–523. doi: 10.1017/s1355838201002199. [DOI] [PMC free article] [PubMed] [Google Scholar]
- 103.Robertson MP, Joyce GF. The Origins of the RNA World. Cold Spring Harb. Perspect. Biol. 2010 Aug; doi: 10.1101/cshperspect.a003608. [DOI] [PMC free article] [PubMed] [Google Scholar]
- 104.Robertson MP, Knudsen SM, Ellington AD. In vitro selection of ribozymes dependent on peptides for activity. RNA. 2004;10:114–127. doi: 10.1261/rna.5900204. [DOI] [PMC free article] [PubMed] [Google Scholar]
- 105.Robertson MP, Scott WG. The structural basis of ribozyme-catalyzed RNA assembly. Science. 2007;315:1549–1550. doi: 10.1126/science.1136231. [DOI] [PubMed] [Google Scholar]
- 106.Rogers J, Joyce GF. A ribozyme that lacks cytidine. Nature. 1999;402:323–325. doi: 10.1038/46335. [DOI] [PubMed] [Google Scholar]
- 107.Ryckaert JP, Ciccotti G, Berendsen HJC. Numerical Integration of the Cartesian Equations of Motion of a System with Constraints: Molecular Dynamics of n-Alkanes. J. Comput. Phys. 1977;23:327–341. [Google Scholar]
- 108.Sagui C, Darden TA. Molecular Dynamics Simulations of Biomolecules: Long-Range Electrostatic Effects. Annu. Rev. Biophys. Biomol. Struct. 1999;28:155–179. doi: 10.1146/annurev.biophys.28.1.155. [DOI] [PubMed] [Google Scholar]
- 109.Schlitter J, Engels M, Krüger P. Targeted molecular dynamics: A new approach for searching pathways of conformational transitions. J. Mol. Graph. 1994 Jun;12(2):84–89. doi: 10.1016/0263-7855(94)80072-3. [DOI] [PubMed] [Google Scholar]
- 110.Scott WG. Morphing the minimal and full-length hammerhead ribozymes: implications for the cleavage mechanism. Biol. Chem. 2007;388:727–735. doi: 10.1515/BC.2007.087. [DOI] [PubMed] [Google Scholar]
- 111.Scott WG, Finch JT, Klug A. The Crystal Structure of an All-RNA Hammerhead Ribozyme:A Proposed Mechanism for RNA Catalytic Cleavage. Cell. 1995;81:991–1002. doi: 10.1016/s0092-8674(05)80004-2. [DOI] [PubMed] [Google Scholar]
- 112.Scott WG, Murray JB, Arnold JRP, Stoddard BL, Klug A. Capturing the structure of a catalytic RNA intermediate: The Hammerhead Ribozyme. Science. 1996;274:2065–2069. doi: 10.1126/science.274.5295.2065. [DOI] [PubMed] [Google Scholar]
- 113.Sgrignani J, Magistrato A. The Structural Role of Mg2+ Ions in a Class I RNA Polymerase Ribozyme: A Molecular Simulation Study. J. Phys. Chem. B. 2012;116(7):2259–2268. doi: 10.1021/jp206475d. [DOI] [PubMed] [Google Scholar]
- 114.Shechner DM, Grant RA, Bagby SC, Koldobskaya Y, Piccirilli JA, Bartel DP. Crystal Structure of the Catalytic Core of an RNAPolymerase Ribozyme. Science. 2009;326:1271–1275. doi: 10.1126/science.1174676. [DOI] [PMC free article] [PubMed] [Google Scholar]
- 115.Solomatin SV, Greenfeld M, Chu S, Herschlag D. Multiple native states reveal persistent ruggedness of an RNA folding landscape. Nature. 2010 Feb;463(7281):681–684. doi: 10.1038/nature08717. [DOI] [PMC free article] [PubMed] [Google Scholar]
- 116.Sugita Y, Okamoto Y. Replica-exchange molecular dynamics method for protein folding. Chem. Phys. Lett. 1999 Nov;314(1-2):141–151. [Google Scholar]
- 117.Tinoco I, Chen G, Qu X. RNA reactions one molecule at a time. ColdSpringHarbPerspectBiol. 2010 Nov;2(11):a003624. doi: 10.1101/cshperspect.a003624. [DOI] [PMC free article] [PubMed] [Google Scholar]
- 118.Torrie G, Valleau J. Nonphysical sampling distributions in Monte Carlo free-energy estimation: Umbrella sampling. J. Comput. Phys. 1977 Feb;23(2):187–199. [Google Scholar]
- 119.Wadley LM, Keating KS, Duarte CM, Pyle AM. Evaluating and learning from RNA pseudotorsional space: quantitative validation of a reduced representation for RNA structure. J. Mol. Biol. 2007 Sep;372(4):942–957. doi: 10.1016/j.jmb.2007.06.058. [DOI] [PMC free article] [PubMed] [Google Scholar]
- 120.Warshall S. A Theorem on Boolean Matrices. JACM. 1962;9(1):11–12. [Google Scholar]
- 121.Woese C. Genetic Code. Harper & Row; 1968. [Google Scholar]
- 122.Wong K-Y, Lee T-S, York DM. Active participation of theMg2+ ion in the reaction coordinate of RNA self-cleavage catalyzed by the hammerhead ribozyme. J. Chem. Theory Comput. 2011;7(1):1–3. doi: 10.1021/ct100467t. [DOI] [PMC free article] [PubMed] [Google Scholar]
- 123.Woodside MT, Anthony PC, Behnke-Parks WM, Larizadeh K, Herschlag D, Block SM. Direct measurement of the full, sequencedependent folding landscape of a nucleic acid. Science. 2006 Nov;314(5801):1001–1004. doi: 10.1126/science.1133601. [DOI] [PMC free article] [PubMed] [Google Scholar]
- 124.Woodson Sa. Compact intermediates in RNA folding. Annual review of biophysics. 2010 Jun;39:61–77. doi: 10.1146/annurev.biophys.093008.131334. [DOI] [PMC free article] [PubMed] [Google Scholar]
- 125.Yang S, Banavali NK, Roux B. Mapping the conformational transition in Src activation by cumulating the information from multiple molecular dynamics trajectories. Proc. Natl. Acad. Sci. U. S. A. 2009 Mar;106(10):3776–3781. doi: 10.1073/pnas.0808261106. [DOI] [PMC free article] [PubMed] [Google Scholar]
- 126.Yang W, Lee JY, Nowotny M. Making and breaking nucleic acids: two-mg2+-ion catalysis and substrate specificity. Mol. Cell. 2006 Apr;22(1):5–13. doi: 10.1016/j.molcel.2006.03.013. [DOI] [PubMed] [Google Scholar]
- 127.Zhao L, Xia T. Probing RNA conformational dynamics and heterogeneity using femtosecond time-resolved fluorescence spectroscopy. Methods. 2009 Oct;49(2):128–135. doi: 10.1016/j.ymeth.2009.04.001. [DOI] [PubMed] [Google Scholar]
- 128.Zhao Y, Karypis G. Criterion Functions for Document Clustering: Experiments and Analysis. Machine Learning. 2004;55:311–331. [Google Scholar]
- 129.Zhao Y, Karypis G. Data clustering in life sciences. Mol. Biotechnol. 2005 Sep;31(1):55–80. doi: 10.1385/MB:31:1:055. [DOI] [PubMed] [Google Scholar]
- 130.Zhao Y, Karypis G, Fayyad U. Hierarchical Clustering Algorithms for Document Datasets. Data Mining and Knowledge Discovery. 2005 Mar;10(2):141–168. [Google Scholar]
- 131.Zhuang X. Single-molecule RNA science. Annu. Rev. Biophys. Biomol. Struct. 2005 Jan;34:399–414. doi: 10.1146/annurev.biophys.34.040204.144641. [DOI] [PubMed] [Google Scholar]
Associated Data
This section collects any data citations, data availability statements, or supplementary materials included in this article.