The structure of a complex of sperm whale myoglobin with phenol places this inhibitor of the haloperoxidase activity in a proximal cavity that is unlikely to be the halophenol binding site. The absence of phenol binding at the heme edge, where dehalogenation is likely to take place, indicates that the inhibitor and the halophenol substrates only bind in the active site in the presence of hydrogen peroxide.
Keywords: myoglobin, dehalogenases, heme proteins, peroxidases, DMSO
Abstract
Sperm whale myoglobin (Mb) has weak dehaloperoxidase activity and catalyzes the peroxidative dehalogenation of 2,4,6-trichlorophenol (TCP) to 2,6-dichloroquinone. Crystals of Mb and of its more active G65T variant were used to study the binding of TCP, 4-iodophenol (4-IP) and phenol. The structures of crystals soaked overnight in a 10 mM solution of phenol revealed that a phenol molecule binds in the proximal cavity, forming a hydrogen bond to the hydroxyl of Tyr146 and hydrophobic contacts which include interactions with Cβ and Cγ of the proximal histidine His93. The phenol position corresponds to the strongest xenon binding site, Xe1. It appears that the ligand enters the proximal cavity through a gate formed by the flexible loops 79–86 and 93–103. TCP and 4-IP do not bind to Mb in this manner under similar conditions; however, it appears to be likely that dimethyl sulfoxide (DMSO), which was used at a concentration of 0.8 M to facilitate 4-IP dissolution, binds in the phenol/Xe1 binding site. In this structure, a water molecule coordinated to the heme iron was replaced by an oxygen molecule, reflecting the reduction of the heme. Crystals of Mb and G65T Mb soaked for 5–10 min did not show bound phenol. Kinetic studies of TCP dechlorination showed that phenol has a dual effect: it acts as a competitive inhibitor that is likely to interfere with TCP binding at the heme edge and as a weak activator, likely through binding in the proximal cavity. The lack of phenol bound at the heme edge in the crystal structures suggests that its inhibitory binding only takes place when the heme is activated by hydrogen peroxide.
1. Introduction
Myoglobin (Mb) is one of the most thoroughly studied proteins. Its principal function is as an oxygen carrier, but it has recently been found that in some organisms it has acquired an additional function as a dehaloperoxidase, utilizing its heme as the catalytic center to generate active oxygen species. The first dual-function myoglobin/dehaloperoxidase (DHP) was discovered in Amphitrite ornata, a member of the Terebellidae (sea worm) family. This enzyme catalyzes the oxidative-dehalogenation reaction of polyhalogenated phenols, utilizing H2O2 (Chen et al., 1996 ▶). Ferric myoglobins from species such as sperm whale or horse have low-level peroxidase activity, but their physiological role appears to be solely as an oxygen-binding protein (Osborne et al., 2007 ▶). Dual-function globin/peroxidase proteins in the ferric state bind peroxide in the distal cavity and their catalytic mechanism is similar to that well established for classical peroxidases (Osborne et al., 2009 ▶).
Peroxidases typically do not have a well defined binding site for organic substrates; rather, their oxidation takes place at the heme edge (Poulos, 2010 ▶). Surprisingly, crystal binding studies revealed that DHP binds 4-iodophenol (4-IP), an organic substrate, in the distal cavity (LaCount et al., 2000 ▶). Binding of 4-IP in this mode requires the distal histidine to swing out of the cavity, which consequently leads to disassembly of the catalytic machinery. This observation generated controversy: is the 4-IP binding part of the catalytic cycle or is it simply opportunistic? Recent results indicate that the latter is true (Thompson et al., 2010 ▶). Other small ligands such as O2, CN−, CO and imidazole, which bind in the distal cavity, tend to coordinate to the heme iron. Phenylhydrazine reacts with myoglobin and produces a covalent bond between one of the C atoms of the phenyl group and the heme iron (Ringe et al., 1984 ▶).
Ligand binding in the unaltered proximal cavity was limited to the observation that the exposure of Mb crystals to xenon gas at 709 kPa resulted in the presence of one Xe atom in the cavity; its position is referred to as the ‘Xe1 site’ (PDB entry 1j52; W. Radding, E. C. Liong & G. N. Phillips Jr, unpublished work). Interestingly, the xenon binding sites in hemoglobin are different from those in myoglobin and no Xe binding was observed in the hemoglobin proximal cavities, likely owing to different protein dynamics (Savino et al., 2009 ▶). In general, it was thought that the presence of the proximal histidine in the cavity prevents the binding of larger molecules. In order to study the effects of the replacement of the proximal histidine by other ligands, the ‘cavity mutant’ H93G was engineered (Barrick, 1994 ▶). This mutant was able to accommodate ligands such as 4-methylimidazole (Barrick, 1994 ▶), β-mercaptoethanol, acetate (Qin et al., 2006 ▶) and phenol (Roach et al., 2000 ▶).
Mb ligands such as O2 or CO bind to the heme iron, producing the A state; the binding is stabilized by electrostatic interactions with His64 (Lamb et al., 2002 ▶; Olson et al., 2007 ▶). This binding can be disrupted upon photon absorption (Gibson & Ainsworth, 1957 ▶). After photodissociation, the ligand migrates into other internal cavities of the protein and may then diffuse back to the heme iron or escape into solution (Gibson, 1989 ▶; Lim et al., 1993 ▶; Scott et al., 2001 ▶). After photodissociation, the CO molecule moves to the primary docking site, yielding the B state; from there, the CO molecule migrates into internal cavities named after their xenon binding ability. Subsequently, the ligands may rebind to the heme iron or leave through the His64 gate (Schotte et al., 2004 ▶; Belogortseva et al., 2007 ▶).
Our studies of other Mb variants that mimic DHP and have increased dehaloperoxidase activity (Du et al., 2011 ▶) led us to investigate whether crystals of one such mutant, G65T, would bind 4-IP, as was observed for DHP. Since 4-IP is poorly soluble in water, we complemented this study by soaking the crystals in solutions containing 10 mM phenol. Unexpectedly, the crystal structure of G65T revealed a phenol molecule bound in the proximal cavity. A follow-up experiment with wild-type Mb showed the formation of virtually the same complex, indicating that this mode of phenol binding is not a result of the mutation but is a property of Mb. Soaking G65T crystals in 4-IP solution and DMSO yielded an entirely different complex: an oxyferrous protein with a DMSO molecule bound in the Xe1/phenol site.
2. Materials and methods
2.1. Site-directed mutagenesis
The pUC19 plasmid with the wild-type sperm whale Mb gene was a gift from Professor Yoshihito Watanabe (Nagoya University). The mutagenic primers were designed to be complementary to the sense strand of sperm whale Mb cDNA. Primers were synthesized and purified by Integrated DNA Technology (IDT; Coralville, Iowa, USA). Site-directed mutagenesis was performed using the QuikChange method and the results were confirmed by LiCor DNA-sequence analysis (USC Engencore DNA server, Columbia, South Carolina, USA) of the entire Mb gene.
2.2. Protein expression and purification
Plasmids containing either the Mb gene or the G65T variant gene were transformed into the Escherichia coli BL21 (DE3) cell line and screened successively on LB plates containing 100 µg ml−1 ampicillin. Colonies were picked up from the ampicillin plates, grown overnight in 5 ml LB containing 100 µg ml−1 ampicillin and used to make cell stocks for protein expression and purification. The recombinant protein was purified as described previously (Springer & Sligar, 1985 ▶) with modifications. E. coli BL21 (DE3) cells harboring pUC19 were grown at 310 K in 2×YT medium (5 g NaCl, 10 g yeast extract and 16 g tryptone per litre) in the presence of ampicillin (100 mg l−1). The dark-brown cells were collected and frozen at 193 K until use. 20 g of cells was thawed at 277 K for 16 h in 100 ml lysis buffer (50 mM Tris–HCl pH 8.0, 1.0 mM EDTA, 0.5 mM dithiothreitol with 20 U DNase, 3 U RNase and 2 mg lysozyme per millilitre). The cells were sonicated for 30 min on ice and the cell debris was removed by centrifugation. The blood-red supernatant was collected and subjected to ammonium sulfate fractionation. Mb was precipitated from 55–95% ammonium sulfate. The precipitate was recovered by centrifugation and resuspended in a minimum volume of 20 mM Tris–HCl pH 8.0, 1 mM EDTA. The solution was applied onto a Bio-Gel P-100 (Bio-Rad) gel-filtration column (3.0 × 30 cm). The appropriate fractions were pooled, concentrated and applied onto a CM52 pre-swollen microgranular carboxymethyl cellulose (Whatman) cation-exchange column (5 × 15 cm) equilibrated in 25 mM potassium phosphate pH 6.0. The protein was eluted using a linear pH gradient of 25 mM potassium phosphate buffer pH 6.0–9.0 containing 1 mM EDTA. The protein purity was assessed by using the ratio of the Soret absorbance at 409 nm to the protein absorbance (mostly tryptophan) at 280 nm. Fractions of Mb with an A 409/A 280 of greater than 3.5 were considered to be pure and were pooled. To ensure that only the ferric form was isolated, the Mb proteins were treated with a 1.7-fold molar excess of potassium ferricyanide on ice (Belyea et al., 2005 ▶). Excess ferricyanide was removed by allowing the sample to flow through a Bio-Gel P-6 DG Desalting Gel (Bio-Rad) gel-filtration column by gravity. The Mb proteins were concentrated to 10 mg ml−1 for crystallization.
2.3. Crystallization
Crystals of G65T and wild-type Mb were grown by the vapor-diffusion method using a hanging-drop setup under conditions similar to those reported previously (Matsui et al., 1999 ▶) with a well volume of 500 µl and a drop volume of 2.5 µl protein solution and 2.5 µl well solution. The conditions used for all crystals consisted of 50 mM Tris–HCl pH 8.5, between 2.6 and 2.8 M ammonium sulfate and 1.0 mM EDTA. For the phenol-binding experiments, crystals of either Mb or G65T were soaked for approximately 16 h in 10 mM phenol, 50 mM Tris–HCl pH 7.4, 1.0 mM EDTA, 3.2 M ammonium sulfate solution. For the 4-IP binding experiment, solid 4-IP was dissolved in a DMSO solution (60% DMSO, 40% Tris–HCl pH 7.4 with 1.0 mM EDTA) to obtain a 0.1 M 4-IP stock solution. The stock solution was then diluted to give a 10 mM soaking solution (in 50 mM Tris–HCl pH 8.5, 3.2 M ammonium sulfate, 1.0 mM EDTA) with a final DMSO concentration of 0.8 M (6%). No precipitation was observed upon dilution. The crystals were soaked for approximately 16 h. All crystals were cryo-conditioned by soaking them in 20%(v/v) ethylene glycol-enriched mother liquor for a few seconds and were flash-cooled in N2 vapor at 95 K.
2.4. X-ray diffraction data collection and structure determination
Data were collected on the SER-CAT 22-ID and LS CAT 21-ID-G beamlines at the Advanced Photon Source (APS), Argonne National Laboratory (ANL), Argonne, Illinois, USA. The data were indexed and processed with the HKL-2000 software package (Otwinowski & Minor, 1997 ▶). Data-collection and processing statistics are listed in Table 1 ▶. The structures were determined using molecular replacement with AMoRe (Navaza, 1994 ▶) or Phaser (McCoy et al., 2007 ▶) from the CCP4 suite of programs (Winn et al., 2011 ▶), using the G65T structure (PDB entry 3ock; Du et al., 2011 ▶) as the search model. Structure rebuilding and subsequent refinements were performed with TURBO-FRODO (Roussel & Cambillau, 1991 ▶) and REFMAC5 (Murshudov et al., 2011 ▶). Coordinates were superposed using the LSQKAB program (Kabsch, 1976 ▶) from the CCP4 suite. Figs. 1–4 and Supplementary Figs. 1 and 2 were prepared using TURBO-FRODO. Fig. 5 was prepared using MolScript (Kraulis, 1991 ▶) and Raster3D (Merritt & Bacon, 1997 ▶).
Table 1. Crystallographic data-collection and refinement statistics.
| Complex | Wild-type Mbphenol | G65Tphenol | G65TDMSO |
|---|---|---|---|
| PDB code | 3u3e | 4h07 | 4h0b |
| X-ray source | SER-CAT 22-ID, APS | LS-CAT 21-ID-G, APS | LS-CAT 21-ID-G, APS |
| Wavelength () | 1.0000 | 0.9800 | 0.9800 |
| No. of frames (high pass/low pass) | 128 | 100/100 | 200 |
| Oscillation range () | 1.0 | 1.0 | 0.5 |
| Crystal-to-detector distance (high pass/low pass) (mm) | 150 | 125/250 | 150 |
| Temperature (K) | 100 | 100 | 100 |
| Space group | P6 | P6 | P6 |
| Unit-cell parameters | |||
| a () | 90.309 | 90.531 | 90.499 |
| b () | 90.309 | 90.531 | 90.499 |
| c () | 45.204 | 45.128 | 45.319 |
| Unit-cell volume (3) | 319279 | 320310 | 321438 |
| Solvent content (%) | 49.8 | 48.8 | 49.6 |
| Matthews coefficient (3Da1) | 2.47 | 2.42 | 2.46 |
| Mosaicity () | 0.30 | 0.25 | 0.25 |
| Resolution range () | 50.01.21 (1.231.21) | 50.01.14 (1.161.14) | 50.01.26 (1.311.26) |
| Multiplicity | 6.8 (2.7) | 7.5 (3.7) | 5.6 (4.9) |
| Average I/(I) | 13.3 (2.4) | 13.4 (2.6) | 16.2 (2.9) |
| Total No. of reflections | 434856 | 573149 | 320929 |
| No. of unique reflections | 64348 | 76999 | 57252 |
| Completeness (%) | 99.1 (93.7) | 99.9 (98.1) | 99.9 (99.9) |
| Total linear R merge (%) | 6.7 (41.5) | 5.2 (36.6) | 6.9 (16.4) |
| R value (REFMAC) (%) | 14.4 | 13.3 | 12.7 |
| R free (REFMAC) (%) | 17.1 | 15.2 | 15.3 |
| Ramachandran statistics | |||
| Residues in most favored regions (%) | 92 | 93.5 | 98.0 |
| Residues in additional allowed regions (%) | 8.0 | 6.5 | 2.0 |
| Residues in generously allowed regions (%) | 0 | 0 | 0 |
| Residues in disallowed regions (%) | 0 | 0 | 0 |
2.5. Dehaloperoxidase assay
The effects of phenol binding on the peroxidase activity of Mb were measured using a UV absorption spectroscopy-based assay as described previously (Du et al., 2011 ▶). Briefly, assays were conducted on a Cary 400 spectrophotometer at 277 K and the absorbance peak at 272 nm was monitored to detect the concentration of the product 2,4-dichloroquinone versus time. Generally, Mb (5 µM) and variable concentrations of TCP were mixed in 100 mM potassium phosphate buffer pH 7 in the absence or presence of phenol (0, 250 and 500 µM). The reactions were then initiated by the addition of 2 mM H2O2. The time between phenol addition and readout was 3–4 min or, in the case of the annealing experiment, 3 d. The initial velocity was calculated using the Cary WinUV software based on the linear initial portion of each reaction. The initial rates as a function of TCP concentration were fitted to the Michaelis–Menten equation using the Prism 5 software.
3. Results and discussion
3.1. Crystallographic results
3.1.1. Structures of the Mb–phenol and G65T–phenol complexes
The structures of the Mb–phenol and G65T–phenol complexes were very similar; their superposition yielded a r.m.s. deviation between the positions of the Cα atoms of 0.12 Å. Below, where differences were observed the data for the G65T–phenol complex are given in parentheses.
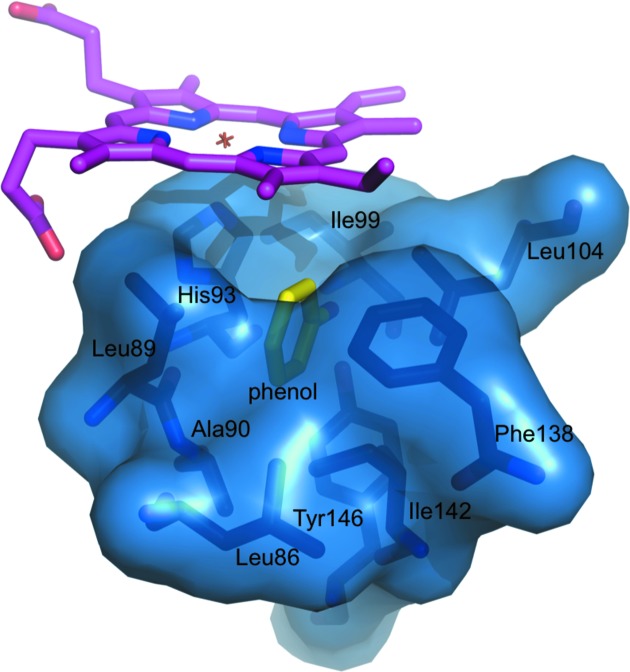
The crystals had excellent scattering power and the electron density for the complex covered the whole molecule with the exception of a few side chains. The electron density for the heme and the proximal cavity of the Mb–phenol complex is shown in Fig. 1 ▶ and that for the G65T–phenol complex is shown in Supplementary Fig. S11. Unlike in the DHP–4-IP complex (LaCount et al., 2000 ▶), the phenol molecule binds in the proximal cavity. The binding site is not saturated; the occupancy factors are approximately 0.6 and 0.8 in the G65T and Mb complexes, respectively. The phenol fits snugly into a hydrophobic part of the proximal cavity (Fig. 2 ▶); its hydroxyl forms a 2.8 Å (2.7 Å) hydrogen bond to the phenolic hydroxyl of Tyr146, which in turn forms a 2.7 Å hydrogen bond to the carbonyl of Ile99 (Fig. 3 ▶). The planes of the phenol molecule and the imidazole ring of His93 are not parallel; they interact through contacts between the C1 and O atoms of the phenol molecule and the Cγ and Cβ atoms of His93 (3.3 and 3.0 Å, respectively; Supplementary Fig. S2). The phenol binding site corresponds to the Xe1 binding site, which is the main binding site for xenon (PDB entry 1j52). A bound CO molecule was also observed in this site in the structure of the D-state (photolyzed) Mb–CO complex (PDB entry 1do3; Ostermann et al., 2000 ▶). These complexes are remarkably similar; the r.m.s. deviation between the positions of the Cα atoms is 0.15 Å (0.19 Å). In both complexes a water molecule is bound to the heme iron, as expected for the ferric state.
Figure 1.
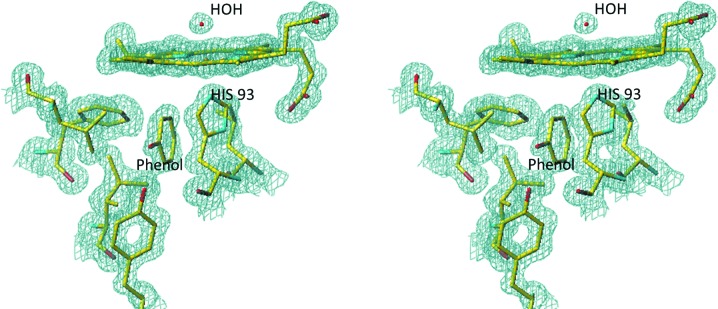
Stereoview of the heme environment in the Mb–phenol complex. The final 2F o − F c OMIT electron density is contoured at the 1.3σ level.
Figure 2.
Proximal cavity in the Mb–phenol complex. The phenol molecule, shown in yellow, fits snugly within its hydrophobic part.
Figure 3.
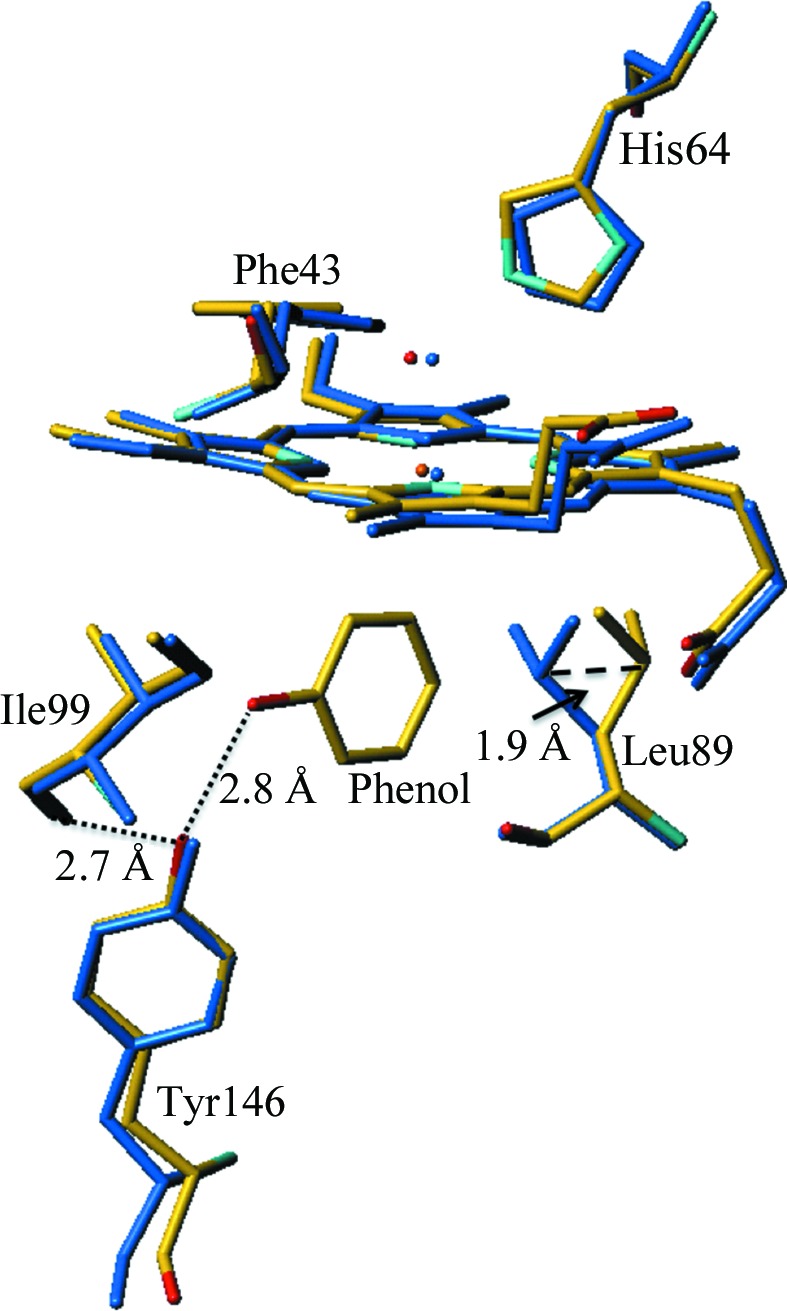
Superposition of the Mb–phenol complex (shown in atom-type colors) with aquomet-Mb (PDB entry 1a6k; shown in blue). The presence of the phenol ligand in the proximal binding site displaces the Leu89 side chain by approximately 1.9 Å.
To analyze the effects of phenol binding, the structure of aquomet-Mb (PDB entry 1a6k; Vojtechovský et al., 1999 ▶) was selected because it was determined at a comparable resolution, 1.1 Å, and the crystals were also obtained from ammonium sulfate pH 7.0. A superposition of the structures of the phenol complex and native Mb yielded an r.m.s. deviation of 0.48 Å between the positions of the Cα atoms. Comparison of these two structures revealed a change of the Leu89 rotamer, shown in Fig. 3 ▶, which resulted in a 1.9 Å shift of Cγ. It is apparent that the side-chain movement arises from phenol binding, as the same rotamer change is also observed for G65T and the G65T–phenol complex. The occupancy of the rotamers of Leu89 correlates with the phenol occupancy. Additional comparisons show that the r.m.s. deviation between the positions of the Cα atoms of the G65T–phenol complex and native G65T is 0.07 Å, while the r.m.s. deviation between the positions of the Cα atoms of native G65T and aquomet-Mb is 0.49 Å. This relatively high r.m.s. deviation is likely to arise from different packing (the space groups are P6 and P21), and the most affected region is residues 148–152 of the C-terminus, where the positions of the Cα atoms shift by up to 1.9 Å.
The visible spectrum of the phenol complex is not significantly different from that of unliganded Mb (not shown). Isothermal titration calorimetric measurements did not allow us to determine the binding constant for phenol. No peaks were observed upon titrant injections, but rather a drift in the baseline. The most likely interpretation is that the binding process is too slow to be measured using this technique.
3.1.2. G65T–dimethyl sulfoxide complex
In the structure of G65T crystals soaked in 4-IP solution there was no electron density that might correspond to a 4-IP molecule. However, there was a density feature in the distal cavity that corresponded very well to an oxygen molecule coordinated to the Fe atom. It appears that 4-IP reduced the heme to the ferrous state; this reaction enabled the binding of oxygen present in the soaking solution.
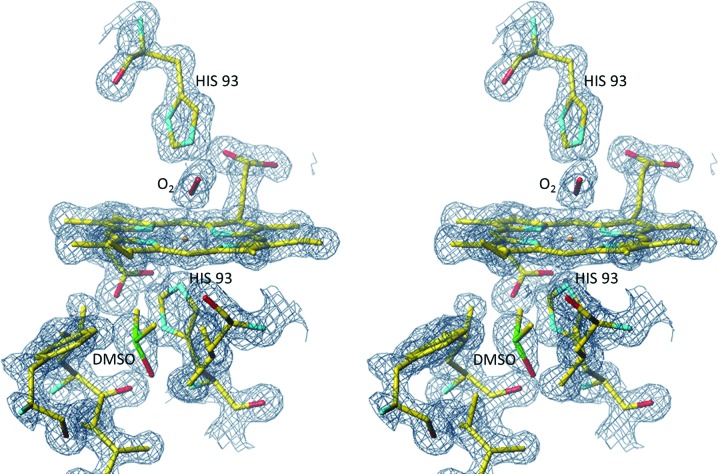
In the proximal cavity, there was a strong electron-density peak (15σ in an OMIT F o − F o map) at the Xe1/phenol binding site. In the OMIT 2F o − F o map the corresponding peak also appeared to be too large for a water molecule (Fig. 4 ▶); no bound water was observed at this site in other Mb structures. The hydrophobic environment of the peak provides the plausible interpretation that a molecule of DMSO present in the soaking solution bound in this site. The density is not well structured and it appears that the DMSO molecule, if indeed present, is rotationally disordered. When a molecule of DMSO was inserted into the model and refined, the values of the B factors were 15 Å2 for the S atom and approximately twice that for the terminal atoms. Those observations indicate that the ligand is heavier than a water molecule but is disordered. As we had no alternative hypothesis, we refer to this structure as the G65T–DMSO complex.
Figure 4.
Stereoview of the heme environment in subunit A of the G65T–DMSO complex. The final 2F o − F c electron density is contoured at the 1.2σ level. The electron feature assigned to a partially disordered DMSO molecule overlaps with the phenol binding site and also the Xe1 binding site.
The G65T–DMSO structure was superposed with that of the Mb–CO complex in the A state (CO bound to Fe; PDB entry 2mgk; Quillin et al., 1993 ▶). The r.m.s deviation between the positions of the Cα atoms was 0.34 Å. It was also superposed with the D-state structure of Mb–CO (PDB entry 1do3; Ostermann et al., 2000 ▶), which has a CO molecule bound at the Xe1 site. The r.m.s. deviation between the positions of the Cα atoms was 0.18 Å. The electron density for the heme and its environment in the G65T–DMSO complex is shown in Fig. 4 ▶.
3.2. Putative gate to the proximal cavity
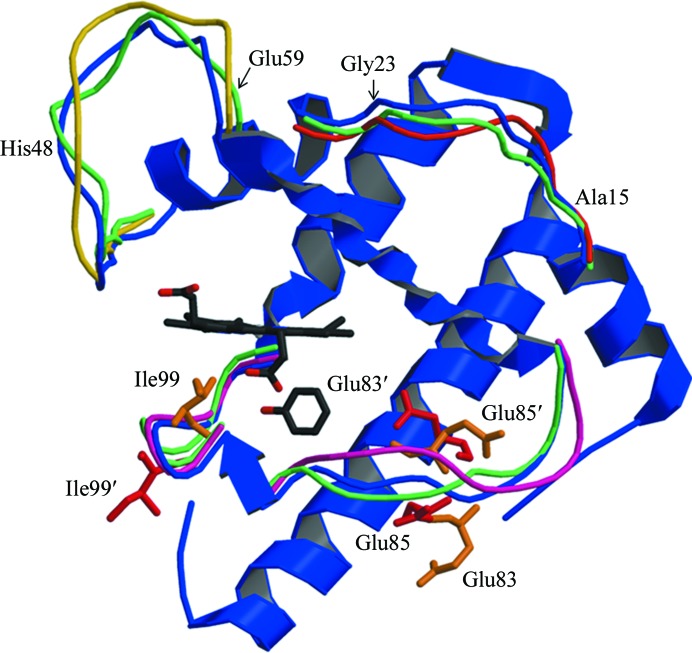
Based on CO photodissociation studies, it is assumed that small ligands such as CO and Xe enter the proximal cavity from the distal cavity through a transient channel between Ile107 and the heme (Lamb et al., 2002 ▶). However, it appears to be unlikely that larger ligands such as phenol or imidazole can enter the proximal cavity through the His64 gate and use the same path because the heme provides a formidable hindrance. H93G Mb, which is often referred to as ‘the cavity mutant,’ has been extensively used to study the effects of proximal ligands on the properties of myoglobin. Success in binding ligands such as 4-methylimidazole, β-mercaptoethanol, phenol and acetate in the proximal cavity in the absence of the proximal histidine side chain preceded our observation (Barrick, 1994 ▶; Qin et al., 2006 ▶). Since the observed phenol binding took place in crystals, loop movement is likely to be responsible for phenol entry into the cavity rather than major protein unfolding. NMR studies provide more information about the molecular dynamics. NMR structures of Mb (PDB entry 1myf; Osapay et al., 1994 ▶) revealed four flexible loops: residues 15–23, 48–59, 79–86 and 93–103. The top NMR structures together with the Mb–phenol complex are shown in Fig. 5 ▶. The 15–23 and 48–59 loops are too far away from the proximal cavity to be the phenol entrance site. Thus, the movement of loops 79–86 and 93–103, individually or in a correlated fashion, is likely to generate an opportunity for entrance of the ligand.
Figure 5.
The structure of the G65T–phenol complex superposed on the mobile loops observed in the NMR structures of Mb. The peptide chain in the G65T–phenol complex is shown in blue; the variable loops are shown in other colors.
3.3. The effects of phenol binding on the peroxidase activity of Mb
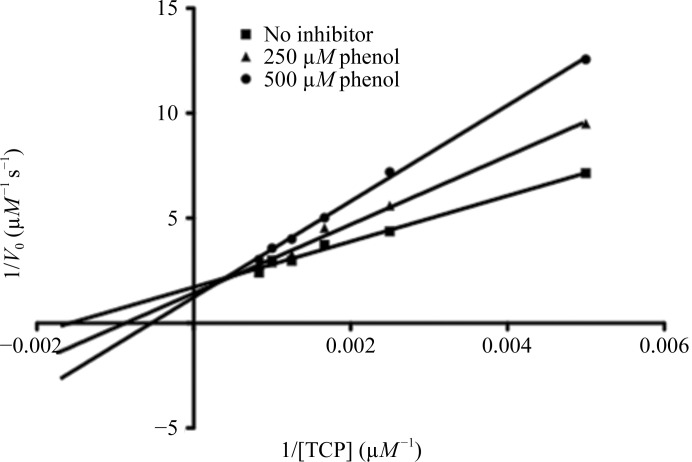
Short (5–10 min) soaking of Mb crystals did not show binding of phenol, indicating that the process is relatively slow in crystals. Long soaks of Mb crystals in saturated solutions of the substrate TCP did not show TCP binding, which is consistent with our modeling studies, indicating that there is not sufficient room for the binding of TCP in the proximal cavity (not shown). However, our kinetics studies of peroxidative TCP dechlorination in the presence of phenol showed that phenol is mainly a competitive inhibitor of this reaction (Fig. 6 ▶, Table 2 ▶). If the deviations from Michaelis–Menten kinetics apparent in Fig. 6 ▶ are disregarded, the K i value is about 0.5 mM. One explanation of these observations is that the peroxidase reaction catalyzed by Mb takes place at the edge of the heme, as established for classical peroxidases (Poulos, 2010 ▶). The absence of TCP or phenol bound at the heme edge in crystals soaked in concentrated solutions (about 20 × K i for phenol) suggests that binding only takes place when Mb is activated by hydrogen peroxide. We soaked crystals with both hydrogen peroxide and phenol, but as in previous experiments no bound ligand was observed, probably owing to the low stability of the active intermediates. The observed slight increase of V max as a function of phenol concentration (Table 2 ▶) may perhaps relate to phenol binding in the proximal cavity and increased ‘electron push’ or to altered protein dynamics.
Figure 6.
Lineweaver–Burk plot for peroxidative dechlorination of TCP by Mb.
Table 2. Effects of phenol concentration on the dehaloperoxidation of TCP by Mb. The data were fitted to the MichaelisMenten model.
| K m (mM) | V max (Ms1) | |
|---|---|---|
| No inhibitor | 0.77 0.19 | 0.64 0.08 |
| 250M phenol | 1.49 0.34 | 0.84 0.12 |
| After 3d annealing | 1.07 0.16 | 0.90 0.08 |
| 500M phenol | 2.25 0.32 | 0.94 0.10 |
| After 3d annealing | 1.28 0.13 | 1.05 0.06 |
The crystal-soaking experiments resulted in partial occupancies of phenol, suggesting that the rate of diffusion is a significant factor in crystals. On the other hand, the kinetics experiments showed only modest differences between dehaloperoxidase activity measurements when the protein was or was not annealed for 3 d in phenol (Table 2 ▶). We estimate that in the absence of annealing the protein was exposed to phenol for 2–3 min. Thus, in contrast to the situation in crystals, where soaks of about 10 min did not show phenol binding, in solution a time of several minutes appears to be sufficient for entry of phenol into the proximal cavity.
4. Conclusions
Even in the presence of its Fe-coordinating histidine, the proximal cavity of Mb has sufficient room to bind modest-sized molecules such as phenol or DMSO in the Xe1 binding site. Phenol binding somewhat alters the electronic state of the proximal histidine as judged from the increased V max for peroxidative dechlorination of TCP. It was previously noticed that myoglobin, although a binding protein, does not have a channel leading to its binding site, but rather depends on the molecular dynamics to create a path through the distal histidine swinging out of the pocket and creating the ‘gate’. The same is true at the opposite side of the heme; there is no channel leading to the proximal cavity. Ligand entry into the cavity is likely to take place through a ‘side path’, not through the distal cavity.
The affinity for substrate/halophenol binding at the heme edge, which is necessary for the dehalogenase activity, appears to be small in the absence of the cosubstrate hydrogen peroxide. The same is true for phenol functioning as a competitive inhibitor, which is also likely to bind at the heme edge.
Supplementary Material
PDB reference: Mb, phenol complex, 3u3e
PDB reference: G65T variant, phenol complex, 4h07
PDB reference: G65T variant, DMSO complex, 4h0b
Supporting information file. DOI: 10.1107/S1744309112045514/en5522sup1.pdf
Acknowledgments
Data were collected on the LS CAT 21-ID-G and SER-CAT 22-ID beamlines at the Advanced Photon Source, Argonne National Laboratory. Use of the Advanced Photon Source was supported by the US Department of Energy, Office of Basic Energy Sciences under Contract No. W-31-109-Eng-38. Financial support was provided by the National Science Foundation (MCB 0820456).
Footnotes
Supplementary material has been deposited in the IUCr electronic archive (Reference: EN5522).
References
- Barrick, D. (1994). Biochemistry, 33, 6546–6554. [DOI] [PubMed]
- Belogortseva, N., Rubio, M., Terrell, W. & Miksovská, J. (2007). J. Inorg. Biochem. 101, 977–986. [DOI] [PubMed]
- Belyea, J., Gilvey, L. B., Davis, M. F., Godek, M., Sit, T. L., Lommel, S. A. & Franzen, S. (2005). Biochemistry, 44, 15637–15644. [DOI] [PubMed]
- Chen, Y. P., Woodin, S. A., Lincoln, D. E. & Lovell, C. R. (1996). J. Biol. Chem. 271, 4609–4612. [PubMed]
- Du, J., Huang, X., Sun, S., Wang, C., Lebioda, L. & Dawson, J. H. (2011). Biochemistry, 50, 8172–8180. [DOI] [PubMed]
- Gibson, Q. H. (1989). J. Biol. Chem. 264, 20155–20158. [PubMed]
- Gibson, Q. H. & Ainsworth, S. (1957). Nature (London), 180, 1416–1417. [DOI] [PubMed]
- Kabsch, W. (1976). Acta Cryst. A32, 922–923.
- Kraulis, P. J. (1991). J. Appl. Cryst. 24, 946–950.
- LaCount, M. W., Zhang, E., Chen, Y. P., Han, K., Whitton, M. M., Lincoln, D. E., Woodin, S. A. & Lebioda, L. (2000). J. Biol. Chem. 275, 18712–18716. [DOI] [PubMed]
- Lamb, D. C., Nienhaus, K., Arcovito, A., Draghi, F., Miele, A. E., Brunori, M. & Nienhaus, G. U. (2002). J. Biol. Chem. 277, 11636–11644. [DOI] [PubMed]
- Lim, M., Jackson, T. A. & Anfinrud, P. A. (1993). Proc. Natl Acad. Sci. USA, 90, 5801–5804. [DOI] [PMC free article] [PubMed]
- Matsui, T., Ozaki, S., Liong, E., Philips, G. N. Jr & Watanabe, Y. (1999). J. Biol. Chem. 29, 2838–2844. [DOI] [PubMed]
- McCoy, A. J., Grosse-Kunstleve, R. W., Adams, P. D., Winn, M. D., Storoni, L. C. & Read, R. J. (2007). J. Appl. Cryst. 40, 658–674. [DOI] [PMC free article] [PubMed]
- Merritt, E. A. & Bacon, D. J. (1997). Methods Enzymol. 277, 505–524. [DOI] [PubMed]
- Murshudov, G. N., Skubák, P., Lebedev, A. A., Pannu, N. S., Steiner, R. A., Nicholls, R. A., Winn, M. D., Long, F. & Vagin, A. A. (2011). Acta Cryst. D67, 355–367. [DOI] [PMC free article] [PubMed]
- Navaza, J. (1994). Acta Cryst. A50, 157–163.
- Olson, J. S., Soman, J. & Phillips, G. N. (2007). IUBMB Life, 59, 552–562. [DOI] [PubMed]
- Osapay, K., Theriault, Y., Wright, P. E. & Case, D. A. (1994). J. Mol. Biol. 244, 183–197. [DOI] [PubMed]
- Osborne, R. L., Coggins, M. K., Raner, G. M., Walla, M. & Dawson, J. H. (2009). Biochemistry, 48, 4231–4238. [DOI] [PubMed]
- Osborne, R. L., Coggins, M. K., Walla, M. & Dawson, J. H. (2007). Biochemistry, 46, 9823–9829. [DOI] [PubMed]
- Ostermann, A., Waschipky, R., Parak, F. G. & Nienhaus, G. U. (2000). Nature (London), 404, 205–208. [DOI] [PubMed]
- Otwinowski, Z. & Minor, W. (1997). Methods Enzymol. 276, 307–326. [DOI] [PubMed]
- Poulos, T. L. (2010). Arch. Biochem. Biophys. 500, 3–12. [DOI] [PMC free article] [PubMed]
- Qin, J., Perera, R., Lovelace, L. L., Dawson, J. H. & Lebioda, L. (2006). Biochemistry, 45, 3170–3177. [DOI] [PMC free article] [PubMed]
- Quillin, M. L., Arduini, R. M., Olson, J. S. & Phillips, G. N. Jr (1993). J. Mol. Biol. 234, 140–155. [DOI] [PubMed]
- Ringe, D., Petsko, G. A., Kerr, D. E. & Ortiz de Montellano, P. R. (1984). Biochemistry, 23, 2–4. [DOI] [PubMed]
- Roach, M. P., Puspita, W. J. & Watanabe, Y. (2000). J. Inorg. Biochem. 81, 173–182. [DOI] [PubMed]
- Roussel, A. & Cambillau, C. (1991). TURBO-FRODO. Silicon Graphics Geometry Partners Directory, p. 86. Mountain View: Silicon Graphics.
- Savino, C., Miele, A. E., Draghi, F., Johnson, K. A., Sciara, G., Brunori, M. & Vallone, B. (2009). Biopolymers, 91, 1097–1107. [DOI] [PubMed]
- Schotte, F., Soman, J., Olson, J. S., Wulff, M. & Anfinrud, P. A. (2004). J. Struct. Biol. 147, 235–246. [DOI] [PubMed]
- Scott, E. E., Gibson, Q. H. & Olson, J. S. (2001). J. Biol. Chem. 276, 5177–5188. [DOI] [PubMed]
- Springer, B. A. & Sligar, S. G. (1985). Proc. Natl Acad. Sci. USA, 84, 8961–8965. [DOI] [PMC free article] [PubMed]
- Thompson, M. K., Davis, M. F., de Serrano, V., Nicoletti, F. P., Howes, B. D., Smulevich, G. & Franzen, S. (2010). Biophys. J. 99, 1586–1595. [DOI] [PMC free article] [PubMed]
- Vojtechovský, J., Chu, K., Berendzen, J., Sweet, R. M. & Schlichting, I. (1999). Biophys. J. 77, 2153–2174. [DOI] [PMC free article] [PubMed]
- Winn, M. D. et al. (2011). Acta Cryst. D67, 235–242.
Associated Data
This section collects any data citations, data availability statements, or supplementary materials included in this article.
Supplementary Materials
PDB reference: Mb, phenol complex, 3u3e
PDB reference: G65T variant, phenol complex, 4h07
PDB reference: G65T variant, DMSO complex, 4h0b
Supporting information file. DOI: 10.1107/S1744309112045514/en5522sup1.pdf


