

EEA1 endosomes are believed to function mainly in down-regulating EGFR signaling, and APPL endosomes are regarded as signaling endosomes. Evidence is given that EGF-induced, proliferative signaling occurs from EEA1 endosomes and is regulated by interaction between the signal-transducing protein GIV and the trimeric G protein Gαs.
Abstract
The organization of the endocytic system into biochemically distinct subcompartments allows for spatial and temporal control of the strength and duration of signaling. Recent work has established that Akt cell survival signaling via the epidermal growth factor receptor (EGFR) occurs from APPL early endosomes that mature into early EEA1 endosomes. Less is known about receptor signaling from EEA1 endosomes. We show here that EGF-induced, proliferative signaling occurs from EEA1 endosomes and is regulated by the heterotrimeric G protein Gαs through interaction with the signal transducing protein GIV (also known as Girdin). When Gαs or GIV is depleted, activated EGFR and its adaptors accumulate in EEA1 endosomes, and EGFR signaling is prolonged, EGFR down-regulation is delayed, and cell proliferation is greatly enhanced. Our findings define EEA1 endosomes as major sites for proliferative signaling and establish that Gαs and GIV regulate EEA1 but not APPL endosome maturation and determine the duration and strength of proliferative signaling from this compartment.
INTRODUCTION
Cells respond to their environment through binding of extracellular signals to plasma membrane (PM) receptors that transduce information to the cell interior and activate elaborate signaling networks via sequential protein–protein interactions. The extent and duration of receptor signal transduction are tightly regulated by endocytic trafficking, during which receptors are removed from the cell surface by endocytosis, pass through the endosomal system, and are either recycled or delivered to lysosomes, where signaling is down-regulated and the receptors are degraded (Sorkin and von Zastrow, 2009; Scita and Di Fiore, 2010; Platta and Stenmark, 2011). Specifically, in the case of the epidermal growth factor receptor (EGFR), it was shown that binding of EGF to its receptor activates EGFR signaling at the PM and initiates internalization and trafficking of the receptor to peripheral APPL/Rab5–positive early endosomes and then to early EEA1 endosomes (Zoncu et al., 2009), from which the receptor may either recycle or be sorted and targeted to lysosomes for degradation. APPL endosomes mature into EEA1 endosomes by a gradual switch in the phosphatidylinositol phosphate content from phosphatidylinositol (4,5)-bisphosphate to phosphatidylinositol (3,4,5)-trisphosphate (Shin et al., 2005), which leads to dissociation of APPL1 and acquisition of the Rab effector EEA1 (Zoncu et al., 2009). EEA1 endosomes gradually acquire ESCRT components, lose Rab5 and EEA1, and acquire Rab7 to become late or multivesicular endosomes (Rink et al., 2005; Poteryaev et al., 2010), which eventually become lysosomes by acquisition of lysosomal proteins (e.g., LAMPs, lysosomal enzymes; Huotari and Helenius, 2011). Thus the EGFR passes through a series of biochemically distinct endolysosomal subcompartments (APPL, EEA1, late multivesicular endosomes, lysosomes) with unique compositions and functions.
It is now recognized that signaling not only occurs at the cell surface, but it also continues in transit through the endosomal system (Di Guglielmo et al., 1994) and that endosomes can initiate and sustain unique growth factor receptor signaling and cellular responses from those initiated at the PM (Miaczynska et al., 2004; Murphy et al., 2009; Scita and Di Fiore, 2010; Platta and Stenmark, 2011). For example, APPL endosomes, sometimes referred to as “signaling endosomes,” were shown to be the site of generation of unique signals that specifically stimulate Akt cell survival signaling via APPL1 (Varsano et al., 2006; Schenck et al., 2008). According to the classic model, it is assumed or implied that EEA1 endosomes function principally to down-regulate receptor signaling by sorting and sequestering EGFR within intraluminal vesicles of multivesicular endosomes (MVEs). The questions of whether signaling can be initiated and sustained at EEA1 endosomes and, if so, how the cellular responses are regulated at this location are controversial (Sorkin and von Zastrow, 2009). Answering these questions would yield information common to other growth factor receptors (e.g., platelet-derived growth factor receptor, nerve growth factor receptor) that follow similar trafficking itineraries (Wang et al., 2004; Howe and Mobley, 2005; Varsano et al., 2006; Murphy et al., 2009).
We recently discovered that the multidomain signal transducing protein GIV influences EGFR trafficking and signaling. Upon EGF stimulation, GIV directly binds activated EGFR and assembles an EGFR/GIV/Gαi3 signaling complex that prolongs PM-based signaling and enhances cell migration (Ghosh et al., 2010). We found earlier that GIV also binds Gαs in yeast two-hybrid assays (Le-Niculescu et al., 2005), and Gαs localizes to Rab5 endosomes and facilitates down-regulation of EGFR (Zheng et al., 2004). We therefore asked whether EGFR trafficking and signaling at endosomes are regulated by functional coupling between Gαs and GIV and, if so, which endosomal subcompartments are affected. Here we provide evidence that interaction between Gαs and GIV regulates proliferative signaling at EEA1 but not APPL endosomes and that sequential interaction between GIV and either Gαi or Gαs at spatially distinct compartments (PM vs. EEA1 endosomes) determines the cellular response to growth factor.
RESULTS
EGFR traffics efficiently through APPL endosomes but not EEA1 endosomes in the absence of Gαs
First we set out to determine which step in EGF-induced receptor trafficking is regulated by Gαs. To learn whether Gαs regulates trafficking through APPL endosomes, we treated HeLa cells with control or Gαs small interfering RNA (siRNA; Zheng et al., 2004) to deplete endogenous Gαs (>90%) (see Figure 3, A, C, and E, later in the paper), starved overnight (0.2% fetal bovine serum [FBS]), stimulated with 50 nM (300 ng/ml) Texas red-EGF (TR-EGF), and stained for APPL1. At 5 min after TR-EGF stimulation some TR-EGF localized to peripheral APPL endosomes in both control and Gαs-depleted cells (Figure 1, A and D); at 10 min most of the TR-EGF localized to scattered intracellular vesicles and some remained in peripheral APPL endosomes (Figure 1, B and E). At 30 min little TR-EGF could be detected in APPL endosomes in either control or Gαs-depleted cells (Figure 1, C and F); however, much more total TR-EGF remained in Gαs-depleted cells, and it was concentrated in tightly clustered juxtanuclear endosomes. These results indicate that TR-EGF traffics through APPL endosomes efficiently in both control and Gαs-depleted cells and accumulates in a post-APPL early endosome compartment in Gαs-depleted but not control cells.
FIGURE 3:

Gαs depletion increases and prolongs EGF-induced EGFR activation and phosphorylation of ERK1/2 but not Akt. (A, B) The amount of activated EGFR (pY1068 and pY1045) seen after EGF stimulation at 5 (lane 5) and 15 (lane 6) min is much greater in Gαs-depleted cells than in controls (lanes 2 and 3). (B) Quantification reveals that pY1068 (n = 3, *p < 0.005) and pY1045 (n = 5, *p < 0.02) are increased greater than threefold in Gαs-depleted cells at 5 and 15 min after EGF stimulation. Cell lysates from control (lanes 1–3) or Gαs-depleted (lanes 4–6) HeLa cells treated as in Figure 2, A–F, were stimulated with 50 nM EGF for 5 or 15 min, immunoblotted for total EGFR (tEGFR), activated EGFR (pY1068- and pY1045), Gαs, and actin, and quantified using Odyssey imaging software, version 2.1. Bands were normalized to actin at each time point, averaged, and plotted as the fold increase in phosphorylation vs. control ± SEM. (C, D) Gαs-depleted cells show greater than twofold more pERK1/2 at 5 (lane 5) and 15 min (lane 6) after stimulation than controls (lanes 2 and 3; n = 4, *p < 0.05). (E and F) Gαs-depleted cells show 1.6-fold more pAkt than controls (lanes 2 and 3) at 5 min (lane 5) but not at 15 min (lane 6) after stimulation (n = 4, *p < 0.001). Control (lanes 1–3) or Gαs-depleted (lanes 4–6) HeLa cells treated as in A were immunoblotted for pERK1/2, tERK1/2, pAkt, tAkt, Gαs, and actin and quantified as in B.
FIGURE 1:

Trafficking of TR-EGF through APPL1 endosomes. HeLa cells were transfected with control (A–C) or Gαs (D–F) siRNA, serum starved (0.2% FBS) overnight, and stimulated with 300 ng/ml TR-EGF for 5, 10, or 30 min. Cells were fixed (3% paraformaldehyde), stained for APPL1 (green), and examined by confocal microscopy. At 5 min TR-EGF localizes to punctate, peripheral APPL1 endosomes (yellow, arrowheads) in both control (A) and Gαs-depleted (D) cells (13 ± 4% vs. 17 ± 3%). At 10 min (B, E) some TR-EGF (13 ± 3% vs. 12 ± 3%) remains localized to APPL1 endosomes (yellow, arrowheads), and by 30 min little TR-EGF (red, arrowheads) is detected in APPL endosomes (green) in either Gαs-depleted cells (F) or controls (C; 10 ± 3% vs. 6 ± 1%). At 30 min TR-EGF (red, arrowheads) is located in small endosomes distributed throughout the cytoplasm and is not found in APPL endosomes in controls (C), whereas in Gαs-depleted cells (F) it accumulates in tightly clustered, juxtanuclear endosomes. Bar, 10 μm. Insets, 3× enlargement of boxed regions.
We next asked whether EGFR trafficking through EEA1 endosomes is compromised in the absence of Gαs. Gαs-depleted HeLa cells and controls were stimulated with 300 ng/ml EGF and stained for EGFR and EEA1. Before EGF stimulation (0 min), EGFR was localized at the PM and to some cytoplasmic vesicles in both control and Gαs-depleted cells (Figure 2, A and D). At 10 min after EGF stimulation EGFR had reached EEA1 endosomes scattered throughout the cytoplasm in both controls and Gαs-depleted cells (Figure 2, B and E). At 30 min few receptors were seen in EEA1 endosomes in controls (Figure 2C), whereas in Gαs-depleted cells many EGFRs remained in EEA1 endosomes, which were clustered in the juxtanuclear region (Figure 2F). Findings were not dependent on the amount of growth factor added, as similar results were obtained after stimulation with a low concentration (1.5 ng/ml) of EGF (unpublished data). The residence time of TR-EGF in EEA1 endosomes was also prolonged after Gαs depletion (Supplemental Figure S1, A–F), and maturation of EEA1 endosomes to late endosomes and lysosomes was delayed, as dramatically more TR-EGF remained associated with EEA1 endosomes or LAMP-2–positive endolysosomes at 90 min after Gαs depletion (Supplemental Figure S1H) than in controls (Supplemental Figure S1G).
FIGURE 2:

Gαs depletion prolongs and enhances EGFR signaling from EEA1 endosomes. (A–F) Gαs-depleted and control HeLa cells were serum starved, stimulated with 50 nM EGF for 0, 10, or 30 min, stained for total EGFR (red) and EEA1 (green), and analyzed as in Figure 1. In controls (A) before EGF stimulation (0 min) EGFR is found at the PM (red, arrowheads) and occasionally in intracellular vesicles that mostly do not colocalize with EEA1 (green, inset). At 10 min after stimulation (B) EGFR localizes to EEA1 early endosomes (yellow, arrowheads), and by 30 min (C) relatively few EGFR remain in EEA1 endosomes. In Gαs-depleted cells, before EGF stimulation (D) EGFRs are also concentrated near the PM (red, arrowhead) and in intracellular vesicles, which sometimes colocalize with EEA1 (yellow, inset). At 10 min after stimulation (E), colocalization with EEA1 in early endosomes is increased; by 30 min (F) there is a striking accumulation of EGFR in juxtanuclear clusters of EEA1 endosomes in Gαs-depleted cells (yellow, F), whereas little EGFR remains in controls (C). (G–L) Gαs-depleted HeLa cells and controls were treated as in A–F and stained for activated (phosphorylated) pY1068-EGFR (green) and EEA1 (red). After serum starvation (0 min), little pY1068 staining for activated receptors is observed at the PM or at EEA1 endosomes in either control (G) or Gαs-depleted (J) cells. At 10 min after stimulation activated EGFRs are associated with EEA1 endosomes in both control (H) and Gαs-depleted (K) cells (yellow, arrowheads). By 30 min, activated EGFRs are barely detectable in EEA1 endosomes (red) in controls (I), whereas there is a striking accumulation of activated EGFR in juxtanuclear clusters of EEA1 endosomes (yellow, arrowheads) in Gαs depleted cells (L). Bar, 10 μm. Insets, 3× enlargement of boxed regions.
To establish the morphology of the clustered EEA1 endosomes in which EGFR accumulates at 30 min after Gαs depletion, we carried out immunogold labeling for EGFR at the electron microscopic (EM) level. It has been established (Sachse et al., 2002) that after internalization via clathrin-mediated endocytosis, EGFRs are delivered to early vacuolar endosomes, which mature into MVEs that with time show increasing numbers of intralumenal vesicles and a content of increasing density and heterogeneity (endolysosomes). In controls at 30 min after EGF stimulation, EGFR was found primarily inside dense MVEs packed with internal vesicles (Supplemental Figure S1, I and J) or in endolysosomes with heterogeneous lamellar and vesicular content (Supplemental Figure S1K). In contrast in Gαs-depleted cells, EGFR was mainly localized to either the limiting membrane of vacuolar endosomes lacking internal vesicles (Supplemental Figure S1, L and M) or to the intraluminal vesicles of MVEs, which had fewer internal vesicles than controls (Supplemental Figure S1N); relatively few receptors were detected inside endolysosomes densely packed with internal vesicles.
The immunofluorescence and immunogold results validate that in the absence of Gαs, both EGFR and EGF accumulate in EEA1 endosomes, and maturation of EEA1 endosomes to late endosomes and lysosomes is delayed. We conclude that the G protein facilitates receptor trafficking through early endosomes and timely maturation of EEA1 endosomes to endolysosomes.
Gαs depletion increases and prolongs EGFR autophosphorylation, src homology 2 adaptor recruitment, and activation of downstream kinases from EEA1 endosomes
Next we asked whether the prolonged stay of EGFR in EEA1 endosomes after Gαs depletion affects receptor signaling. Control and Gαs-depleted cells were starved, stimulated with EGF, and stained for EEA1 and activated (autophosphorylated) EGFR using antibodies specific for pY1068, the phosphosite bound by the src homology 2 (SH2) adaptor, Grb2 (Lowenstein et al., 1992). Before stimulation with EGF, very little activated EGFR was observed at the PM or endosomes in either control or Gαs-depleted cells (Figure 2, G and J). By 10 min after stimulation, activated EGFRs were associated with EEA1 endosomes in both control and Gαs-depleted cells, but the amount seen in Gαs-depleted cells (Figure 2K) was increased over controls (Figure 2H). At 30 min, activated EGFRs were barely detectable in EEA1 endosomes in controls (Figure 2I), whereas in Gαs-depleted cells abundant activated receptors remained in juxtanuclear EEA1 endosomes (Figure 2L). Thus EGFR activation (autophosphorylation) is greatly enhanced, and the stay of activated EGFR in EEA1 endosomes is prolonged after Gαs depletion. Similar findings were obtained when cells were stained with antibodies specific for pY1045, the phosphosite on activated EGFR that binds c-Cbl (unpublished data).
Increased autophosphorylation of EGFR in Gαs-depleted cells was confirmed by quantitative immunoblotting using Odyssey infrared imaging. In controls, autophosphorylation of EGFR at both pY1068 and pY1045 peaked at 5 min but was reduced by 15 min after EGF stimulation (Figure 3A), whereas in Gαs-depleted cells EGFR autophosphorylation at these sites was increased greater than threefold at both 5 and 15 min after ligand stimulation (Figure 3, A and B).
We also found that recruitment of the SH2 adaptors Grb2 and c-Cbl, which bind pY1068 and pY1045 (Lowenstein et al., 1992; Levkowitz et al., 1999), was increased after Gαs depletion (Supplemental Figure S2). Furthermore, downstream signaling was also enhanced, as phosphorylation of both ERK1/2 (Figure 3, C and D) and Akt (Figure 3, E and F) was increased at 5 min after EGF stimulation in Gαs-depleted cells. At 15 min, ERK1/2 phosphorylation (Figure 3, C and D) but not Akt phosphorylation (Figure 3, E and F) remained significantly increased. Thus in Gαs-depleted cells ERK1/2 but not Akt signaling is prolonged, and ERK1/2 signaling remains enhanced even after EGFR traffics to EEA1 endosomes.
The effects of Gαs depletion were not due to off-target effects of the siRNA, because expression of siRNA-resistant (sr), wild-type (wt) human Gαs in Gαs siRNA-treated cells selectively reversed the effects of Gαs depletion on autophosphorylation of EGFR (Supplemental Figure S3). Moreover, the effects of Gαs depletion differed from those of Gαi3 depletion: In Gαi3-depleted cells EGFR activation at pY1068 and pY1045 was increased immediately (5 min) after EGF stimulation, but by 15 min EGFR activation was reduced and similar to controls (Supplemental Figure S4, A and B).
Collectively these results indicate that 1) Gαs depletion increases and prolongs EGFR activation, adaptor recruitment, and downstream MAP kinase signaling at 15 min after EGF stimulation when the receptor is localized in EEA1 early endosomes (see Figure 2, E and F), and 2) the effects are specific for Gαs.
Gαs depletion leads to enhanced cell proliferation
Next we asked whether the delay in endosome maturation and enhanced EGFR signaling from EEA1 endosomes in Gαs-depleted cells results in increased cell proliferation, using two established indicators of mitosis—phospho-histone H3 (P-H3; Hans and Dimitrov, 2001; Ghosh et al., 2010) and incorporation of bromodeoxyuridine (BrdU; Schenck et al., 2008). We found that the levels of P-H3 determined by both immunofluorescence (IF; Figure 4A) and quantitative immunoblotting (Figure 4, B and C) were significantly increased (>1.47-fold) after Gαs depletion. Similarly, the levels of incorporated BrdU as determined by IF (Figure 4D) and flow cytometry analysis (Figure 4, E and F) were also significantly increased (>1.6-fold). Thus the results confirm that there are increased numbers of proliferating cells after Gαs depletion. Overall our findings indicate that Gαs facilitates EEA1 endosome maturation, limits EGFR signaling from EEA1 endosomes, and inhibits cell proliferation.
FIGURE 4:

Gαs depletion leads to increased cell proliferation. (A) The number of nuclei that stain for P-H3 (red) is increased after Gαs depletion (right) compared with controls (left). (B, C) Gαs-depleted cells (lane 2) show 1.47-fold more P-H3 than controls (lane 1) by immunoblotting. In A, control or Gαs siRNA–treated HeLa cells were fixed and stained for P-H3 (red) and DAPI (blue). Bar, 10 μm. In B, whole-cell lysates prepared from control or Gαs siRNA–treated HeLa cells were immunoblotted for P-H3, tubulin, and Gαs. In C, P-H3 bands such as those in B were quantified from four different experiments, normalized to tubulin, averaged, and plotted ± SEM (p < 0.001). (D) The number of cells that stain for incorporated BrdU (green) is increased after Gαs depletion (right) compared with controls (left). Bar, 10 μm. (E, F) A representative two-dimensional flow cytometry experiment indicating a 1.75-fold increase (35.7 vs. 20.4%) in proliferating cells after Gαs depletion. In D and E, HeLa cells were pulse labeled with BrDU for 30 min and either processed for immunofluorescence (D) or flow cytometry (E) as described in Material and Methods. In F, four experiments such as that shown in E were quantified, normalized, and graphed (± SEM; n = 4, p = 0.01).
Gαs regulates the membrane association of EEA1
Next we investigated the mechanism by which maturation of endosomes is delayed in the absence of Gαs. Rab5 and its effector EEA1 associate with membranes of EEA1 endosomes and then dissociate when they mature into late endosomes (Rink et al., 2005; Poteryaev et al., 2010). To learn whether Gαs affects the membrane association of Rab5, EEA1, and other endosome markers, we starved control and Gαs-depleted HeLa cells, stimulated them with EGF, and assessed the distribution of endosome markers between membrane (120,000 × g pellet) and cytosolic (120,000 × g supernatant) fractions. There was no change in the membrane association of APPL1, Rab5, or hepatocyte growth factor–regulated tyrosine kinase substrate (Hrs) after Gαs depletion (Figure 5A). However, there was a striking change in the distribution of EEA1. In Gαs-depleted cells, 57% ± 1% was found in membrane fractions after starving, and the amount increased to 65.4% ± 2.2% after stimulation, whereas in controls only 25% ± 3.9% of EEA1 was membrane associated at 0 min and 30% ± 4% at 5 min after EGF stimulation (Figure 5B). We similarly tested whether depletion of Gαi3 affects the membrane association of EEA1 and found no effect (Supplemental Figure S4, C and D), indicating that the increased membrane association of EEA1 is specific for Gαs. We conclude that Gαs facilitates dissociation of EEA1 from membranes, which is a key step in EEA1 endosome maturation and EGFR signal down-regulation.
FIGURE 5:
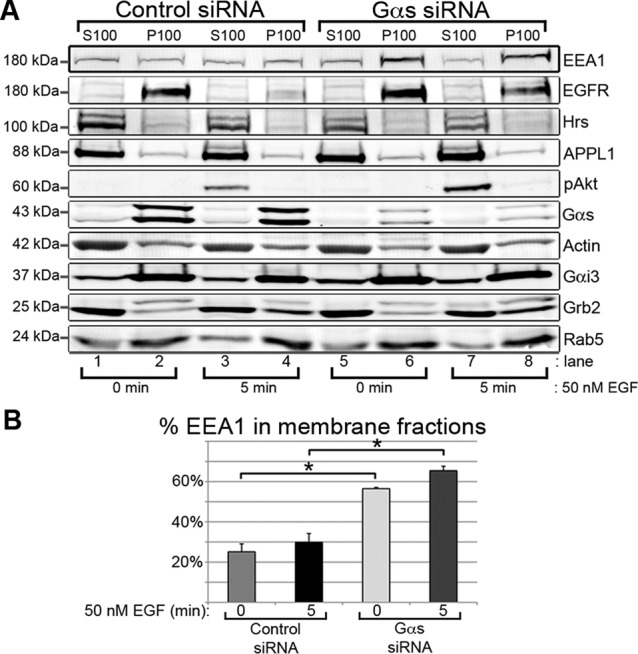
Gαs regulates the membrane association of EEA1. (A) In Gαs-depleted cells there is significantly more EEA1 in membrane fractions at 0 (lane 6) and 5 min (lane 8) after EGF stimulation than in controls (lanes 2 and 4). However, there is no change in the membrane association of Rab5, APPL1, Hrs, Gαi3, Grb2, or pAkt. HeLa cells transfected with control siRNA (lanes 1–4) or Gαs siRNA (lanes 5–8) were starved (lanes 1, 2, 5, and 6) or stimulated for 5 min with 50 nM EGF (lanes 3,4, 7, and 8) as in Figure 3A. (B) Quantification of the data such as those in A reveals that in controls (control siRNA) 25 and 30% of the EEA1 was in membrane fractions at 0 and 5 min after stimulation, respectively, whereas after Gαs depletion (Gαs siRNA) 57 and 65% of the EEA1 is on membranes at the same time points. Membrane (120,000 × g pellet, P100) and cytosolic (120,000 × g supernatant, S100) fractions were prepared and immunoblotted as indicated. The percentage of EEA1 in P100 fractions was calculated from (P100/2)/(S100 + P100/2) × 100 and plotted ± SEM (n = 3, *p << 0.01).
Inactive Gαs is required for EGFR signal down-regulation and loss of EEA1 from membranes
To learn whether the effects of Gαs on EGFR and EEA1 depend on the activation status of the G protein, we expressed siRNA-resistant (sr) mutants mimicking the active (Graziano and Gilman, 1989) or inactive state of Gαs (Lee et al., 1992) in Gαs-depleted cells. We found that the inactive Gαs-G226A (GA) but not the constitutively active Gαs-Q227L (QL) mutant reversed the effects of Gαs depletion on EGFR autophosphorylation (Figure 6, A and B) and reversed the membrane association of EEA1 (Figure 6, C and D). On the basis of these data, we conclude that inactive Gαs promotes EEA1 endosome maturation and facilitates timely EGFR endocytic trafficking, down-regulation, and degradation.
FIGURE 6:

Inactive Gαs (Gαs-GA) reverses the effects of Gαs depletion on EGFR autophosphorylation and the membrane association of EEA1. (A, B) Transfection of Gαs-depleted cells with an inactive srGαs-GA mutant (lanes 10–12) but not an active srGαs-QL mutant (lanes 7–9) reverses the effects of Gαs depletion (lanes 4–6) and restores EGFR autophosphorylation to levels comparable to controls (lanes 1–3). Control (lanes 1–3) or Gαs siRNA–treated (lanes 4–12) HeLa cells were transfected with pCDNA3.1 (vector; lanes 1–6), constitutively active srGαs-QL (lanes 7–9), or inactive srGαs-GA (lanes 10–12) and then serum starved, stimulated with EGF, and immunoblotted as in Figure 3A. pY1068 and pY1045 bands such as those in A were quantified from four different experiments, averaged, normalized, and plotted as in Figure 3B (*p < 0.05). Black bar, control siRNA + vector; dark gray bar, Gαs siRNA + vector; light gray bar, Gαs siRNA + srGαs-Q227L; open bar, Gαs siRNA + srGαs-G226A. (C, D) An inactive Gαs mutant reverses the effect of Gαs depletion on the membrane distribution of EEA1. In Gαs-depleted cells transfected with srGαs-GA (lanes 5 and 6) and in controls transfected with vector alone (lanes 1 and 2), ∼16% of the total EEA1 is associated with the membrane fraction, whereas in Gαs-depleted cells (lanes 3 and 4), ∼29% of EEA1 is in the membrane fraction. Membrane and cytosol fractions were prepared from control siRNA–treated HeLa cells transfected with vector (lanes 1 and 2), Gαs siRNA–treated cells transfected with vector (lanes 3 and 4), or inactive srGαs-GA (lanes 5 and 6) and immunoblotted for EEA1, actin, and Gαs as in Figure 5A. (D) The percentage of EEA1 on membranes was calculated and plotted as in Figure 5B (n = 7, *p < 0.05). Light gray bar, control siRNA + vector; black bar, Gαs siRNA + vector; dark gray bar, Gαs siRNA + srGαs-GA.
Inactive Gαs directly binds GIV
We previously showed that GIV prolongs EGFR signaling and the association of the receptor with the PM, but once the receptor is internalized, it facilitates EGFR trafficking through endosomes and promotes EGFR degradation (Ghosh et al., 2010). We reasoned that the effects of GIV on endosome dynamics might be mediated through interaction with Gαs. To investigate this possibility, we first asked whether GIV interacts with Gαs in in vitro pull-down assays and whether binding depends on the activation state of the G protein. Purified glutathione S-transferase (GST)–Gαs or GST alone preloaded with GDP (to mimic the inactive state) or GDP/AlF4− (to mimic the active state; Garcia-Marcos et al., 2009) was incubated with HeLa or Cos7 cell lysates and analyzed for bound proteins. Inactive but not active GST-Gαs bound endogenous GIV from both Cos7 (Figure 7A) and HeLa cell lysates. In addition, endogenous GIV coimmunoprecipitated with Gαs-GFP in the presence of GDP but not in the presence of GDP/AlF4− (Figure 7, B and C). We further found that purified, recombinant GST-Gαs-GDP specifically bound the purified C-terminus (CT) of GIV (amino acids 1623–1870; Figure 7D), indicating that interaction between GIV and inactive Gαs is direct.
FIGURE 7:

Inactive Gαs directly binds GIV. (A) Endogenous GIV and Gβ (used as a positive control) preferentially bind inactive GST-Gαs-GDP (lane 3, upper panels). Little binding to active GST-Gαs-GDP/AlF3− (lane 5) or GST alone (lanes 2 and 4) is observed. Purified GST-Gαs (lanes 3 and 5) and GST alone (lanes 2 and 4) were preloaded with GDP (lanes 2 and 3) or GDP/AlF3− (lanes 4 and 5) and incubated overnight with ∼1 mg Cos7 cell lysate. Lane 1, 5% input. Recombinant proteins were visualized by Ponceau S staining (lower panel), and bound proteins were analyzed by immunoblotting for GIV and Gβ (top). (B, C) Endogenous GIV coimmunoprecipitates with Gαs-GFP-GDP (B, lane 2) but not Gαs-GFP-GDP/AlF3− (B, lane 3) or GFP alone (C; lanes 2 and 3), indicating that GIV preferentially interacts with GDP-bound Gαs. Cos7 cells expressing Gαs-GFP (B) or GFP alone (C) were lysed in the presence of GDP (lanes 1 and 2) or GDP/AlF3−, (lanes 3 and 4) and incubated with anti-GFP IgG, and bound proteins were analyzed by immunoblotting for GFP and endogenous GIV. Lanes 1 and 4, 1% input. (D) GST-Gαs-GDP (lane 4) but not GST-Gαs-GDP/AlF3− (lane 5) or GST alone (lanes 2 and 3) binds His-GIV-CT (amino acids 1623–1870), indicating that GIV-CT binds directly to inactive Gαs. Purified GST (lanes 2 and 3) or GST-Gαs (lane 4 and 5) was preloaded with GDP (lanes 2 and 4) or GDP/AlF3− (lanes 3 and 5) as in A and incubated with purified His-GIV-CT. Lane 1, 10% input. (E) GST-Gαs-GDP binds FLAG-GIV-wt (lane 3), but binding of the mutant FLAG-GIV-FA (lane 5) is greatly decreased, indicating that the GEF motif in the C-terminus of GIV binds inactive Gαs. Purified GST (lanes 2 and 4) or GST-Gαs (lanes 3 and 5) was preloaded with GDP and incubated with lysates from Cos7 cells expressing either FLAG-GIV-wt (lanes 1–3) or FLAG-GIV-FA (lanes 4–6). Lanes 1 and 6, 1% input. Recombinant proteins were visualized by Ponceau S staining (bottom), and bound proteins were analyzed by immunoblotting (top) for FLAG (FLAG-GIV) and Gβ.
GIV binds directly to Gαi-GDP via a defined guanine nucleotide exchange factor (GEF) motif within its C-terminus, and a point mutation within this motif (GIV-F1685A) virtually abolishes binding (Garcia-Marcos et al., 2009). To determine whether Gαs also binds to this region of GIV, we carried out pull-down assays with GST-Gαs-GDP on cell lysates from Cos7 cells expressing FLAG-tagged GIV-wt or the FLAG-GIV-F1685A (FA) mutant. We found that FLAG-GIV-FA binding to GST-Gαs-GDP is greatly reduced compared with FLAG-GIV-wt (Figure 7E), indicating that Gαs-GDP and Gαi3-GDP bind to the same motif in the C-terminus of GIV. In contrast to Gαi3, Gαs activity was not affected by recombinant GIV in vitro (unpublished data); however, these results do not rule out a possible effect of endogenous GIV on Gαs activity in vivo (e.g., due to phosphorylation; Poppleton et al., 1996; Lin et al., 2011).
GIV and Gαs localize to early EEA1 endosomes
Next we investigated the localization of endogenous Gαs and GIV. As shown previously for Gαs-GFP (Zheng et al., 2004), endogenous Gαs localized to EEA1 early endosomes (Figure 8, A–C). Similarly, endogenous GIV colocalized with EEA1 in both controls (Figure 8D) and Gαs-depleted cells (Figure 8E). In addition, when cyan fluorescent protein (CFP)–tagged GIV was coexpressed with a constitutively active Rab5 mutant (Rab5-QL; Stenmark et al., 1995; Simonsen et al., 1998), GIV and EEA1 colocalized on the enlarged Rab5QL early endosomes in both Gαs-depleted cells (Figure 8G) and controls (Figure 8F). Thus GIV and both endogenous and overexpressed Gαs are associated with EEA1 endosomes.
FIGURE 8:
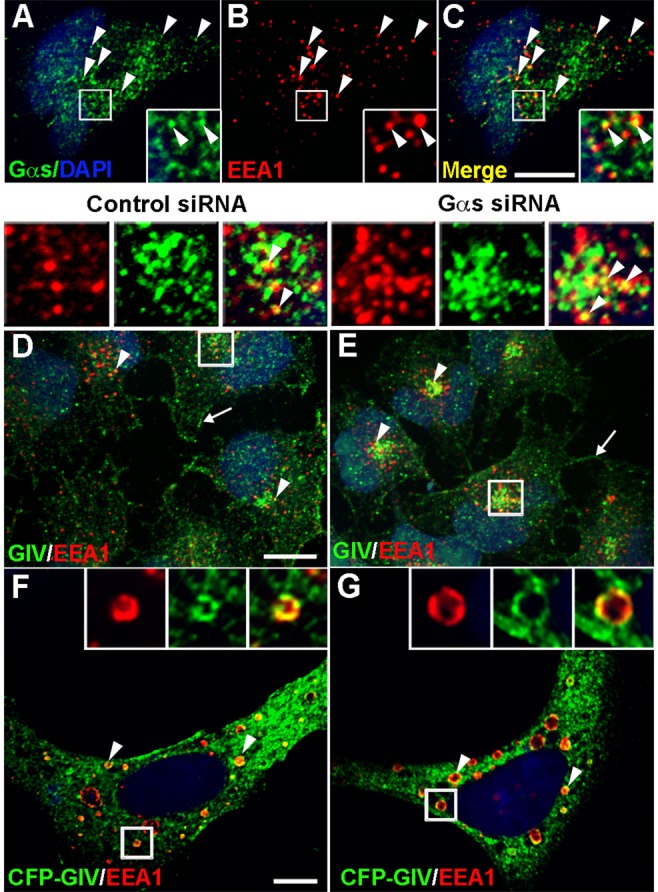
Gαs and GIV localize to EEA1 early endosomes. (A–C) Gαs is associated with EEA1 early endosomes in HeLa cells (C, arrowheads). HeLa cells were serum starved and stained for endogenous Gαs (green) and EEA1 (red) and processed and analyzed as in Figure 1. (D, E) In both control (control siRNA) and Gαs-depleted (Gαs siRNA) cells, GIV (green) is found along the PM (arrows) and associated with EEA1 early endosomes (arrowheads, yellow). Control and Gαs-depleted HeLa cells were serum starved, stained for endogenous GIV and EEA1, and processed and analyzed as in Figure 1. (F, G) CFP-GIV colocalizes with EEA1 on Rab5QL enlarged early endosomes (yellow, arrowheads) in both control (F) and Gαs-depleted cells (G). CFP-GIV and Rab5-QL were coexpressed in control or Gαs-depleted HeLa cells, stained for GIV (green) and EEA1 (red), and analyzed by confocal microscopy as in Figure 1. Bar, 10 μm. Insets, 3× enlargement of boxed regions.
GIV depletion prolongs the stay of activated EGFR and EGF in endosomes
We reasoned that because Gαs (Zheng et al., 2004) and GIV localize to endosomes and Gαs directly interacts with GIV, GIV might also regulate endosome maturation and EGFR trafficking through EEA1 early endosomes. To assess whether this is the case, we starved control and GIV-depleted HeLa cells, stimulated them with EGF for 0, 10, or 30 min, and stained for pY1068-EGFR and EEA1. After serum starvation (0 min), little pY1068 staining for activated receptors was observed at the PM or endosomes in either control or GIV-depleted cells (Figure 9, A and D). At 10 min after stimulation, activated EGFRs were associated with EEA1 endosomes in both control and GIV-depleted cells (Figure 9, B and E). By 30 min, activated EGFRs were barely detectable in EEA1 endosomes in controls (Figure 9C), whereas GIV-depleted cells showed a striking accumulation of activated EGFR in EEA1 endosomes (Figure 9F). The association of Alexa 488 EGF with EEA1 endosomes was similarly prolonged after GIV depletion (Supplemental Figure S5). Thus GIV depletion, like Gαs depletion, prolongs the stay of activated EGFRs in EEA1 endosomes and results in enhanced and prolonged EGFR signaling from EEA1 endosomes.
FIGURE 9:

GIV depletion increases the membrane association of EEA1 and prolongs and enhances EGFR signaling from EEA1 endosomes. (A–F) Before EGF stimulation (0 min), little pY1068 staining for activated receptors (green) is observed at the PM or EEA1 endosomes (red) in either control (A) or GIV-depleted (D) cells. At 10 min after stimulation some activated EGFRs are associated with EEA1 endosomes in both control (B) and GIV-depleted (E) cells (yellow, arrowheads). By 30 min, activated EGFRs are barely detectable in EEA1 endosomes in controls (C), whereas GIV-depleted cells show a striking accumulation of activated EGFRs in EEA1 endosomes (F; yellow, arrowheads). GIV-depleted HeLa cells and controls were serum starved, stimulated with EGF, and stained for pY1068-EGFR (green) and EEA1 (red). Bar, 10 μm. (G, H) After GIV depletion, 24% of the total EEA1 is associated with membrane fractions, ∼11% in controls. The distribution of EEA1, GIV, Gαs, and actin in membrane (120,000 × g pellet, P100) and cytosolic (120,000 × g supernatant, S100) fractions prepared from control (lanes 1 and 2) or GIV-depleted (lanes 3 and 4) HeLa cells was assessed by immunoblotting. EEA1 bands such as those in A were quantified from three different experiments and averaged, and the percentage of EEA1 on membrane fractions calculated and plotted as in Figure 5B (*p < 0.01). (I, J) Gαs and GIV cooperatively facilitate the loss of EEA1 from membranes. The amount of EEA1 on membranes after depletion of both Gαs and GIV (lanes 5 and 6) is similar to that seen after depletion of Gαs alone (lanes 7 and 8). HeLa cells were depleted of GIV, Gαs, or both GIV and Gαs and fractions prepared and immunoblotted as in A. Results are shown as the mean ± SEM (p = 0.02; n/s, no significant difference).
Gαs and GIV cooperatively regulate the membrane association of EEA1
Next we asked whether GIV might also regulate the membrane association of EEA1. Indeed, the amount of EEA1 on membranes doubled after GIV depletion (Figure 9, G and H), indicating that GIV, like Gαs, facilitates the loss of EEA1 from endosomal membranes. Our findings that GIV binds inactive Gαs and both GIV and Gαs facilitate the loss of EEA1 from membranes suggest that GIV and Gαs function in a common pathway that facilitates the dissociation of EEA1 from endosomal membranes. If so, the effects of depletion of both proteins on the membrane association of EEA1 should resemble that after depletion of either protein alone. This proved to be the case, as there was no significant difference between the results obtained after silencing both Gαs and GIV versus silencing Gαs alone (Figure 9, I and J), indicating that the effects of Gαs and GIV on EEA1 are not additive. These data implicate GIV and Gαs in a common pathway mediating the loss of EEA1 from membranes, which is a key step in EEA1 endosome maturation.
Overall our results indicate that both GIV and Gαs facilitate maturation of EEA1 endosomes and down-regulation of EGFR signaling from this compartment.
DISCUSSION
In this study we provide novel insights into the regulation of proliferative signaling via EGFR from EEA1 signaling endosomes. We find that in the absence of Gαs, EGFRs pass efficiently through APPL endosomes but their stay in EEA1 endosomes is prolonged and is associated with increased EGFR autophosphorylation, SH2 adaptor recruitment, activation of ERK1/2, and increased cell proliferation. Mechanistically, we find that inactive Gαs facilitates maturation of EEA1 endosomes and limits EGFR proliferative signaling and cell proliferation via direct interaction with GIV. Previously we showed that Gαs promotes ligand-induced degradation of EGFR (Zheng et al., 2004) and that Gαs binds to GIV in yeast two-hybrid assays (Le-Niculescu et al., 2005). Our present findings establish that EEA1 endosomes are the site of the Gαs effect on EGFR trafficking and that Gαs and GIV functionally interact to facilitate endosome maturation, EGFR degradation, and down-regulation of EGFR proliferative signaling.
GIV sequentially interacts with G proteins to compartmentalize EGFR signaling
Our present work and previous findings (Ghosh et al., 2010) define a critical role for interaction between GIV and G proteins in the spatial and temporal compartmentalization of EGFR signaling. Evidence that GIV and G proteins compartmentalize signaling initially arose from studies linking GIV and Gαi3 to EGF-induced cell migration (Ghosh et al., 2008). Later we found that GIV's C-terminus harbors a GEF motif that binds and activates Gαi3 (Garcia-Marcos et al., 2009) and upon EGF stimulation assembles an EGFR/GIV/Gαi3 complex at the PM that prolongs association of EGFR with the PM and enhances migratory Akt signaling and cell migration (Ghosh et al., 2010; Garcia-Marcos et al., 2012). Importantly, a point mutation (GIV-F1685A) within the GEF motif that disrupts GIV's ability to bind and activate Gαi3 not only inhibited Akt activation and cell migration (Garcia-Marcos et al., 2009), but also it caused increased EGFR internalization, led to accumulation of EGFR in endosomes, and resulted in increased proliferative ERK1/2 signaling (Ghosh et al., 2010). These effects of GIV on signal compartmentalization were attributed to the ability of GIV to bind and activate Gαi3 (Ghosh et al., 2010). Our present work shows that the same GIV-F1685A point mutation that disrupts interaction between GIV and Gαi3 also disrupts GIV's interaction with Gαs. This, together with our finding that Gαs affects later signaling from endosomes, whereas Gαi3 affects early EGFR signaling from the PM (Figure 3 and Supplemental Figure S4), suggests that the effects of GIV-F1685A on EGFR signaling at endosomes result from disrupting GIV's interaction with Gαs. Our working model (Figure 10) is that after EGF stimulation, GIV initially binds activated EGFR and activates Gαi3 and Akt to regulate EGFR signaling and cell migration at the PM (Ghosh et al., 2010), and later GIV binds Gαs at EEA1 endosomes to facilitate EEA1 endosome maturation and down-regulation of proliferative signaling from EEA1 endosomes as shown in the present work. Based on this model, interference with GIV's ability to bind to either G protein would alter the trafficking and signaling dynamics of EGFR and other growth factor receptors (e.g., platelet-derived growth factor receptor, nerve growth factor receptor) that follow similar trafficking itineraries (Wang et al., 2004; Howe and Mobley, 2005; Varsano et al., 2006; Murphy et al., 2009).
FIGURE 10:
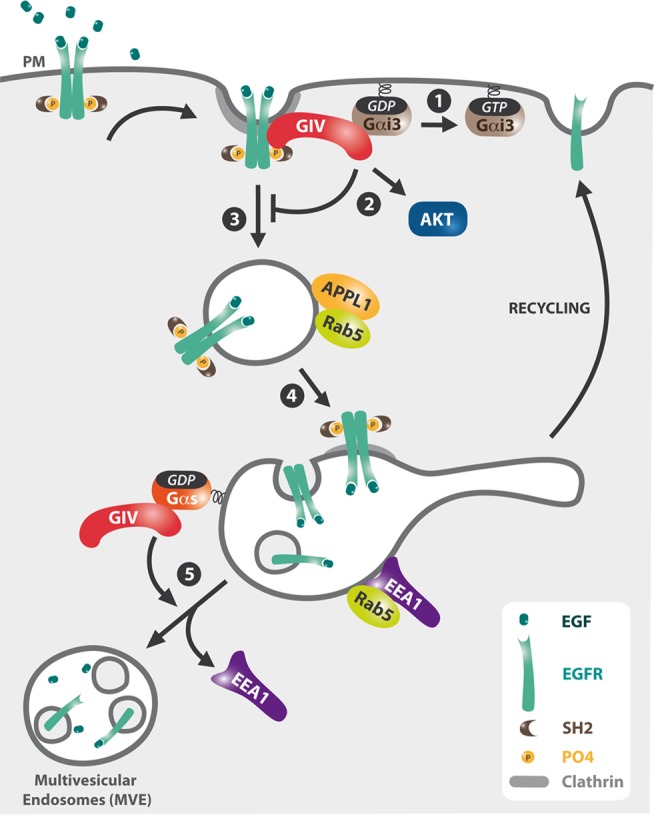
Working model. GIV spatially regulates the trafficking and signaling of EGFR via sequential interactions with Gαi3 and Gαs. Upon EGF stimulation, GIV binds EGFR and assembles an EGFR/GIV/Gαi3 complex at the PM that activates Gαi3 (1), prolongs the association of EGFR with the PM, and enhances PM-based Akt signaling (2). On internalization EGFR traffics to APPL endosomes (3) and then to EEA1 endosomes (4), where GIV binds inactive Gαs, and promotes dissociation of EEA1 and endosome maturation to MVEs (5), which facilitates EGFR down-regulation and shuts off proliferative signaling from endosomes.
Interaction of Gαs with GIV shuts down EGFR proliferative signaling from EEA1 endosomes
Our present work demonstrates that EEA1 endosomes are important signaling compartments that support and sustain proliferative signaling by EGFR. It has been clear for some time that activation of distinct signaling pathways by EGFR (e.g., Akt vs. ERK1/2; Vieira et al., 1996; Haugh and Meyer, 2002; Sigismund et al., 2008; Ghosh et al., 2010) and other receptors (Sorkin and von Zastrow, 2009; Scita and Di Fiore, 2010; Platta and Stenmark, 2011) requires their internalization and trafficking to endosomes. What has remained unclear is the contribution of individual endosomal subcompartments to signaling. Traditionally EEA1 endosomes have been viewed principally as sites at which EGFR are concentrated and sorted for degradation in downstream compartments (late endosomes, lysosomes; Sorkin and von Zastrow, 2009; Huotari and Helenius, 2011). Recently it has been shown that EGFRs traffic first to biochemically distinct APPL “signaling” endosomes (Zoncu et al., 2009), where EGFRs initiate and sustain cell survival signaling via activation of Akt and phosphorylation of glycogen synthase kinase 3 (Schenck et al., 2008), after which APPL endosomes are converted to EEA1 endosomes, where signal attenuation is assumed to occur (Varsano et al., 2006; Zoncu et al., 2009). This work implied that APPL endosomes represent the endosome subcompartment where signaling is initiated and sustained, whereas EEA1 endosomes function to attenuate and down-regulate signaling. Our findings provide strong evidence that proliferative signaling occurs from EEA1 endosomes and that the residence time of activated EGFR in EEA1 endosomes and duration of proliferative signaling is controlled by Gαs and its interaction with GIV.
We found that dissociation of EEA1 from endosomal membranes, a key step in the maturation of EEA1 endosomes (Rink et al., 2005), is facilitated by functional interaction between Gαs and GIV (Figure 9, G–J). The question as to how Gαs and GIV promote dissociation of EEA1 and facilitate EEA1 endosome maturation remains open. Among the possibilities that cannot be ruled out at present are specific effects on Rab5 activity (Barbieri et al., 1994), on the phosphoinositide composition of endosomal membranes (Slessareva et al., 2006), or on ESCRT-dependent receptor sorting (Zheng et al., 2004). Although EGFR ubiquitination facilitates sorting, an effect on this function seems unlikely because ubiquitination of EGFR facilitates its sorting, and we found that recruitment of c-Cbl, which ubiquitinates the receptor (Levkowitz et al., 1999), is increased and prolonged after Gαs depletion (Supplemental Figure S2).
Our present finding that Gαs is required for efficient sorting of EGFR for signal down-regulation at early endosomes (Babst, 2011) is in keeping with our previous finding that Gαs directly interacts with Hrs (Zheng et al., 2004), an ESCRT component required for efficient receptor sorting (Babst, 2011). However, we also found that Gαs does not affect the membrane association of Hrs (Figure 5), indicating that interaction of Gαs with Hrs may be required for efficient receptor sorting but not for the association of Hrs with endosomes.
GIV and G protein regulation of EGFR signaling during cancer progression
The sequential interaction of GIV with Gαi3 and Gαs in regulating the compartmentalization of EGFR signaling is relevant to cancer progression (Ghosh et al., 2011). We previously found that in early-stage tumors, which preferentially proliferate rather than migrate, GIV is alternatively spliced to produce a truncated protein (GIV-ΔCT) missing the C-terminal GEF motif that binds both Gαi (Garcia-Marcos et al., 2009) and Gαs, and when GIV-ΔCT is expressed in cultured cells proliferative signaling by EGFR and cell proliferation are enhanced (Ghosh et al., 2010). Based on our present findings, we propose that, like the GIV F1685A mutant, interaction between GIV and both Gαi and Gαs is critically disrupted in early tumors expressing GIV-ΔCT. Akt activation and cell migration by EGFR are inhibited due to interference with binding to Gαi, whereas EEA1 endosome maturation is delayed, proliferative signaling is enhanced, and cell proliferation is increased due to interference with Gαs binding. We also showed that GIV is overexpressed in late-stage metastatic tumors and migratory signaling by EGFR and cell migration is enhanced (Ghosh et al., 2010). We propose that GIV overexpression in metastatic tumors enhances cell migration by preferentially promoting migratory signaling from the PM via interaction with Gαi3 and then limiting endosome-based proliferative signaling via interaction with Gαs.
We conclude that the ability of GIV to sequentially interact with Gαi3 and Gαs at the PM and endosomes compartmentalizes EGFR signaling and thereby determines the cell's response to the growth factor.
MATERIALS AND METHODS
Antibodies and constructs
Silencer Negative Control #1 siRNA (Ghosh et al., 2008) was obtained from Ambion (Austin, TX), Gαs (Zheng et al., 2004) and GIV (Ghosh et al., 2010) siRNAs from Dharmacon (Lafayette, CO), and Gαi3 siRNA (Ghosh et al., 2008) from Santa Cruz Biotechnology (Santa Cruz, CA).
Affinity-purified rabbit anti-APPL1 and anti-Gαs immunoglobulin G (IgG) were gifts from Joseph Testa (Fox Chase Cancer Center, Philadelphia, PA) and Allen M. Spiegel (Albert Einstein College of Medicine, New York, NY). Mouse anti-Rab5 monoclonal antibody (mAb; clone 4F11-D9-C4) was a gift from Angela Wandinger-Ness (University of New Mexico, Albuquerque, NM). Rabbit antibodies against Girdin/GIV, pan-Gβ, Grb2, Hrs, and EGFR (sc-03) were purchased from Santa Cruz Biotechnology, Gαi3 and Gαs from Calbiochem (La Jolla, CA), and those against phospho–histone H3 (P-H3, Ser-10) from Millipore (Billerica, MA). Rabbit antibodies against pY1045-EGFR, pY1068-EGFR, pAkt (Ser-473), total Akt, pERK1/2, and EEA1 were purchased from Cell Signaling Technology (Beverly, MA).
Mouse mAbs were purchased as follows: GFP (Clontech, Mountain View, CA), LAMP-2 (Developmental Studies Hybridoma Bank, University of Iowa, Iowa City, IA), EGFR #528 (Calbiochem), EEA1 and BrdU (clone B44) for immunofluorescence (BD Biosciences), actin, tubulin, and BrdU for flow cytometry (Sigma-Aldrich, St. Louis, MO), and c-Cbl (BD Biosciences, San Diego, CA). Control mouse IgGs used for immunoprecipitation were purchased from Cell Signaling Technology.
For immunofluorescence, highly cross-absorbed Alexa Fluor 594 or 488 F(ab′)2 fragment of goat anti-mouse or anti-rabbit IgG (H+L) were purchased from Invitrogen (Carlsbad, CA). For immunoblotting, goat anti-mouse IgG (H+L) IRDye 800 and goat anti-rabbit Alexa Fluor 680 F(ab′)2 were purchased from Rockland Immunochemicals (Gilbertsville, PA) and Invitrogen, respectively.
For immunoelectron microscopy, sheep anti-EGFR IgG was purchased from Fitzgerald Industries International (Acton, MA), rabbit anti-goat IgG (used as a bridge) from Nordic Immunological Laboratories (Eindhoven, Netherlands), and 10-nm gold-conjugated goat anti-rabbit IgG from Amersham Biosciences (GE Healthcare, Piscataway, NJ).
Gαs-GFP in pCDNA3.1 was a gift from Mark Rasenick (University of Illinois at Chicago, Chicago, IL). Human WT and constitutively active Q227L (QL) Gαs (long and short isoforms) in pCDNA3.1 were purchased from Guthrie cDNA Resource Center (Missouri University of Science and Technology, Rolla, MO). pCDNA3.1 Gαs-G226A (GA) mutant was made using the QuikChange Site-Directed Mutagenesis Kit (Stratagene, Santa Clara, CA). siRNA-resistant Gαs WT, QL, and GA mutant constructs were made by introducing silent substitutions in the Gαs cDNA within the region of homology to the siRNA Gαs oligo (Zheng et al., 2004). N-terminally tagged FLAG-Rab5-QL was subcloned into p3XFLAG-CMV (Sigma-Aldrich). Human GIV was N-terminally tagged with CFP and cloned into the pAP4 vector. Gαs-WT (human, short) was cloned into pGEX-KG and purified as described previously (Ghosh et al., 2008). All primers are available upon request.
Cell culture, transfection, and EGF stimulation
HeLa and Cos7 cells (American Type Culture Collection, Manassas, VA) were grown in DME (Invitrogen) supplemented with 10% FBS (Hyclone, Logan, UT) and penicillin–streptomycin–glutamine (Invitrogen).
For transfection of siRNA oligos, HeLa cells were seeded (5.5 × 10⁴ cells/35 mm dish or 5.5 × 10⁵ cells/10 cm dish), and 24 h later they were transfected with 20 nM final siRNA for 14 h using Oligofectamine (Invitrogen) according to the manufacturer's instructions.
For reversal of the effects of Gαs depletion, 1 × 10⁵ HeLa cells were seeded/well (six-well dish) or 5.5 × 10⁵/10 cm dish, transfected with 20 nM siRNA oligo using Oligofectamine overnight as described, and then transfected with 2 μg/well or 10 μg/dish plasmid DNA (pCDNA3.1 alone or pCDNA3.1 siRNA-resistant Gαs-WT, QL, or GA mutants) for 8 h using FuGENE (Roche, Indianapolis, IN) or TransIT-LT1 (Mirus Bio, Madison, WI) according to the manufacturer's instructions.
For expression of FLAG-Rab5-QL and CFP-GIV, HeLa cells were transfected first with control and Gαs siRNA for 14 h using Oligofectamine and then cotransfected with 1 μg of FLAG-Rab5-QL and 2 μg of CFP-GIV for 8 h using TransIT-LT1.
For expression of GFP or Gαs-GFP, 10-cm dishes of Cos7 cells were transfected with 2 μg GFP or 10 μg Gαs-GFP for 14 h using TransIT-LT1.
For EGF stimulation experiments, 48 h after siRNA transfection the serum concentration was reduced from 10 to 0.2% overnight before stimulation with 50 nM EGF (mouse submaxillary gland; Invitrogen), 300 ng/ml Texas-red EGF (Invitrogen), or 300 ng/ml Alexa 488 EGF (Invitrogen) in DME alone.
Immunofluorescence and immunoelectron microscopy
For immunofluorescence analysis, cells grown on coverslips were fixed in 3% paraformaldehyde (PFA) for 30–60 min at room temperature (RT), quenched (50 mM NH4Cl2), blocked (10% normal goat serum), permeabilized (0.1% Triton X-100 [TX-100] in phosphate-buffered saline [PBS]), incubated in primary antibodies (1 h at RT) or overnight at 4°C (for phosphospecific IgGs) and then secondary IgGs (1 h at RT), and mounted on slides in 1% propyl-gallate (Sigma-Aldrich) in 1:1 glycerol:PBS. Antibody dilutions were as follows: EEA1, 1:200; pY1068-EGFR, 1:150; GIV, 1:180; APPL1, 1:200; phospho–histone H3, 1:150; EGFR (#528), 1:300; EEA1, 1:200; BrdU, 1:5; LAMP-2, 1:400; goat anti-mouse or anti-rabbit Alexa 488 or Alexa 594, 1:500. 4′,6-Diamidino-2-phenylindole (DAPI) (Invitrogen) was used at 1:3000. Confocal imaging was carried out on an inverted IX81 microscope (Olympus, Tokyo, Japan) equipped with 405-, 488-, 560-, and 640-nm laser lines, UltraView Vox Spinning Disk Confocal (PerkinElmer, Waltham, MA), a 60× oil (differential interference contrast) lens, an electron-multiplying charge-coupled device (CCD) Hamamatsu 14-bit camera (Hamamatsu, Hamamatsu, Japan), and Volocity software (PerkinElmer; University of California, San Diego, School of Medicine Light Microscopy Facility).
For immunoelectron microscopic studies, cells were fixed 4 h in 4% PFA, followed by 12 h in 1% PFA in 0.1 M phosphate buffer, pelleted in 10% gelatin, cryoprotected in sucrose, and snap frozen in liquid nitrogen. Ultrathin cryosections (70–80 nm) were cut as previously described (Zheng et al., 2004). For immunogold labeling of EGFR, sections were incubated sequentially with sheep anti-EGFR IgG (2 h), rabbit anti-goat IgG (bridging antibody; 1 h), and goat anti-rabbit IgG-gold conjugates (1 h) and then contrasted (10 min in 0.4% uranyl acetate and 1.8% methyl cellulose on ice). Imaging was carried out using a JEOL 1200 EX II electron microscope equipped with an Orius CCD Gatan camera and Gatan digital micrograph software (Gatan, Pleasanton, CA; University of California, San Diego, Cellular and Molecular Medicine Electron Microscopy Facility).
Whole-cell lysis and immunoblotting
Cells were harvested, suspended in 2.5× Laemmli sample buffer, and boiled for 15 min. Samples were separated by 10% SDS–PAGE or 15% SDS–PAGE (for P-H3 analysis) and transferred to PVDF-FL membranes (Millipore). Membranes were blocked (5% BSA, 0.1% Tween-20 in PBS) and incubated with primary antibodies (4°C overnight) and then with secondary antibodies (30 min at RT). Bands were imaged and quantified by two-color detection with the Odyssey infrared imaging system (Li-Cor Biosciences, Lincoln, NE). Antibody dilutions were as follows: pY1068- and pY1045-EGFR, pAkt, tAkt, Girdin/GIV, tERK1/2, Hrs, and c-Cbl, 1:250; Gαs, Gαi3, tEGFR, EEA1, Rab5, and APPL1, 1:500; Grb2, pERK1/2, actin, GFP, P-H3, and tubulin, 1:1000 to 1:2000; and goat anti-rabbit Alexa Fluor 680 and goat anti-mouse IRDye 800 F(ab′)2, 1:15,000.
Immunoprecipitation
To immunoprecipitate endogenous EGFR, control or Gαs deleted cells were harvested, lysed in buffer A (0.4% TX-100, 20 mM 4-(2-hydroxyethyl)-1-piperazineethanesulfonic acid, pH 7.2, 5 mM Mg acetate, 125 mM K acetate, 1 mM dithiothreitol [DTT], and 20 mM N-ethylmaleimide supplemented with Complete Protease Inhibitor cocktail [Roche] and Phosphatase Inhibitor Cocktail 2 [Sigma-Aldrich] inhibitors), incubated on ice (1 h) with vortexing every 10 min, and cleared by centrifugation (10,000 × g for 10 min). Cell lysates were incubated overnight at 4°C with either control or anti-EGFR mAb #528. Protein G–Sepharose beads (GE Health Sciences) were added and incubated an additional 60 min. Beads were washed, suspended, and boiled in Laemmli sample buffer, and bound proteins were analyzed by immunoblotting.
To immunoprecipitate GFP or Gαs-GFP, Cos7 cells were transfected for 48 h with GαsGFP or GFP alone, harvested, suspended in buffer A supplemented with 1 mM DTT, 10 mM MgCl2, and 30 μM GDP ± 10 mM NaF and 10 μM AlCl3, incubated on ice, and cleared by centrifugation as described. Cell lysates were incubated overnight at 4°C with anti-GFP mAb. Bound proteins were recovered and analyzed as described.
Cell proliferation assays
For P-H3 analyses, whole-cell lysates were prepared as described and analyzed for P-H3 by immunoblotting (1:2000) or by immunofluorescence (1:150) as described previously (Lehtonen et al., 2008; Ghosh et al., 2010).
For BrdU (Sigma-Aldrich) incorporation experiments, control or Gαs-depleted HeLa cells were incubated in 10 μM BrdU for 30 min at 37°C in DME supplemented with 10% FBS. Immunofluorescence and flow cytometry analysis of incorporated BrdU were carried out according to the manufacturer's instructions (Sigma-Aldrich). Briefly, cells were trypsinized, suspended in PBS, and fixed in 100% ethanol (30 min, RT). Samples were incubated in 2 N HCl (20 min, RT), followed by 0.1 M sodium borate (5 min) and mouse anti-BrDU (1:8 dilution; BD Biosciences, San Diego, CA) for 30 min, followed by goat anti-mouse Alexa Fluor 488 for 30 min. RNA was digested, and DNA content was stained by incubation in 100 μg/ml RNase and 5 μg/ml propidium iodide (PI) for 20 min at 37°C. Samples were filtered (10-μm Nitex nylon mesh; Sefar America, Depew, NY), loaded onto an LSRII flow cytometer (BD Biosciences), and analyzed using FlowJo software (TreeStar, Ashland, OR). Cells untreated or exposed only to anti-BrdU antibody or PI were used for background measurements.
Preparation of membrane and cytosolic fractions
Cells were harvested and suspended in 3 mM imidazole buffer in 250 mM sucrose, with protease and phosphatase inhibitors, and homogenized by passage (30×) through a 22-gauge needle as previously described (Felberbaum-Corti et al., 2005). Postnuclear supernatants (prepared by centrifugation of homogenates at 1200 × g for 10 min) were centrifuged for 1 h at 120,000 × g, the cytosolic fraction (120,000 × g supernatant) was collected, and the membrane fraction (120,000 × g pellet) was resuspended in one-half the volume of homogenization buffer. Equal-volume samples of cytosolic and membrane fractions were resuspended in 2× sample buffer and analyzed by immunoblotting.
In vitro protein-binding assays
A total of 20 μg of purified GST-Gαs or GST alone was immobilized on glutathione–Sepharose (GE Healthcare) in buffer B (50 mM Tris-HCl, pH 7.4, 100 mM NaCl, 0.4% [vol/vol] NP-40, 10 mM MgCl2, 5 mM EDTA, 2 mM DTT, protease and phosphatase inhibitors, 30 μM GDP, 12 mM DTT, ± 30 μM AlCl3, and 10 mM NaF) as described (Garcia-Marcos et al., 2009). Immobilized GST-Gαs or GST was incubated overnight at 4°C with purified histidine-tagged GIV-CT (1623-1870) or HeLa or Cos7 cell lysates prepared in buffer A as for immunoprecipitation. Beads were boiled in 2× sample buffer and analyzed by immunoblotting.
Statistical and image analysis
Each experiment presented in the figures is representative of at least three independent experiments. All averages, SEMs, and significance p values (t test) were calculated and graphed using Excel (Microsoft, Redmond, WA). Quantification of IF images was carried out using Volocity software. All images were processed and figures assembled using Photoshop software (Adobe, San Jose, CA).
Supplementary Material
Acknowledgments
We thank Gordon N. Gill for anti-EGFR antibodies, Gill and Pradipta Ghosh for scientific advice and thoughtful comments during preparation of the manuscript, and Steve Dowdy for use of his LSRII flow cytometer. This work was supported by National Institutes of Health Grant R01-CA100768 to M.G.F. M.G.M. was supported by a fellowship from the Susan G. Komen Foundation. Light microscopy facilities were supported in part by University of California, San Diego, Neuroscience Microscopy Shared Facility Grant P30 NS047101.
Abbreviations used:
- APPL
adaptor protein containing PH domain, PTB domain, and leucine zipper motif
- EEA1
early endosome autoantigen 1
- ESCRT
endosomal sorting complex required for transport
- GEF
guanine nucleotide exchange factor
- GIV
Gα-interacting vesicle–associated protein
- Grb2
growth factor receptor–bound protein 2
- Hrs
hepatocyte growth factor–regulated tyrosine kinase substrate
- LAMP
lysosomal-associated membrane protein
- P-H3
phospho–histone H3
- PI
propidium iodide
- PM
plasma membrane
- SH2
src homology 2
- sr
small interfering RNA resistant
- TR-EGF
Texas red–epidermal growth factor
Footnotes
This article was published online ahead of print in MBoC in Press (http://www.molbiolcell.org/cgi/doi/10.1091/mbc.E12-02-0133) on October 10, 2012.
*Present address: Department of Biochemistry, Boston University School of Medicine, Boston, MA 02118.
REFERENCES
- Babst M. MVB vesicle formation: ESCRT-dependent, ESCRT-independent and everything in between. Curr Opin Cell Biol. 2011;23:452–457. doi: 10.1016/j.ceb.2011.04.008. [DOI] [PMC free article] [PubMed] [Google Scholar]
- Barbieri MA, Li G, Colombo MI, Stahl PD. Rab5, an early acting endosomal GTPase, supports in vitro endosome fusion without GTP hydrolysis. J Biol Chem. 1994;269:18720–18722. [PubMed] [Google Scholar]
- Di Guglielmo GM, Baass PC, Ou WJ, Posner BI, Bergeron JJ. Compartmentalization of SHC, GRB2 and mSOS, and hyperphosphorylation of Raf-1 by EGF but not insulin in liver parenchyma. EMBO J. 1994;13:4269–4277. doi: 10.1002/j.1460-2075.1994.tb06747.x. [DOI] [PMC free article] [PubMed] [Google Scholar]
- Felberbaum-Corti M, Cavalli V, Gruenberg J. Capture of the small GTPase Rab5 by GDI: regulation by p38 MAP kinase. Methods Enzymol. 2005;403:367–381. doi: 10.1016/S0076-6879(05)03032-6. [DOI] [PubMed] [Google Scholar]
- Garcia-Marcos M, Ghosh P, Farquhar MG. GIV is a nonreceptor GEF for G alpha i with a unique motif that regulates Akt signaling. Proc Natl Acad Sci USA. 2009;106:3178–3183. doi: 10.1073/pnas.0900294106. [DOI] [PMC free article] [PubMed] [Google Scholar]
- Garcia-Marcos M, Kietrsunthorn PS, Pavlova Y, Adia MA, Ghosh P, Farquhar MG. Functional characterization of the guanine nucleotide exchange factor (GEF) motif of GIV protein reveals a threshold effect in signaling. Proc Natl Acad Sci USA. 2012;109:1961–1966. doi: 10.1073/pnas.1120538109. [DOI] [PMC free article] [PubMed] [Google Scholar]
- Ghosh P, et al. A Gαi-GIV molecular complex binds epidermal growth factor receptor and determines whether cells migrate or proliferate. Mol Biol Cell. 2010;21:2338–2354. doi: 10.1091/mbc.E10-01-0028. [DOI] [PMC free article] [PubMed] [Google Scholar]
- Ghosh P, Garcia-Marcos M, Bornheimer SJ, Farquhar MG. Activation of Galphai3 triggers cell migration via regulation of GIV. J Cell Biol. 2008;182:381–393. doi: 10.1083/jcb.200712066. [DOI] [PMC free article] [PubMed] [Google Scholar]
- Ghosh P, Garcia-Marcos M, Farquhar MG. GIV/Girdin is a rheostat that fine-tunes growth factor signals during tumor progression. Cell Adh Migr. 2011;5:237–248. doi: 10.4161/cam.5.3.15909. [DOI] [PMC free article] [PubMed] [Google Scholar]
- Graziano MP, Gilman AG. Synthesis in Escherichia coli of GTPase-deficient mutants of Gs alpha. J Biol Chem. 1989;264:15475–15482. [PubMed] [Google Scholar]
- Hans F, Dimitrov S. Histone H3 phosphorylation and cell division. Oncogene. 2001;20:3021–3027. doi: 10.1038/sj.onc.1204326. [DOI] [PubMed] [Google Scholar]
- Haugh JM, Meyer T. Active EGF receptors have limited access to PtdIns(4,5)P(2) in endosomes: implications for phospholipase C and PI 3-kinase signaling. J Cell Sci. 2002;115:303–310. doi: 10.1242/jcs.115.2.303. [DOI] [PubMed] [Google Scholar]
- Howe CL, Mobley WC. Long-distance retrograde neurotrophic signaling. Curr Opin Neurobiol. 2005;15:40–48. doi: 10.1016/j.conb.2005.01.010. [DOI] [PubMed] [Google Scholar]
- Huotari J, Helenius A. Endosome maturation. EMBO J. 2011;30:3481–3500. doi: 10.1038/emboj.2011.286. [DOI] [PMC free article] [PubMed] [Google Scholar]
- Lee E, Taussig R, Gilman AG. The G226A mutant of Gs alpha highlights the requirement for dissociation of G protein subunits. J Biol Chem. 1992;267:1212–1218. [PubMed] [Google Scholar]
- Lehtonen S, Shah M, Nielsen R, Iino N, Ryan JJ, Zhou H, Farquhar MG. The endocytic adaptor protein ARH associates with motor and centrosomal proteins and is involved in centrosome assembly and cytokinesis. Mol Biol Cell. 2008;19:2949–2961. doi: 10.1091/mbc.E07-05-0521. [DOI] [PMC free article] [PubMed] [Google Scholar]
- Le-Niculescu H, Niesman I, Fischer T, DeVries L, Farquhar MG. Identification and characterization of GIV, a novel Galpha i/s-interacting protein found on COPI, endoplasmic reticulum-Golgi transport vesicles. J Biol Chem. 2005;280:22012–22020. doi: 10.1074/jbc.M501833200. [DOI] [PubMed] [Google Scholar]
- Levkowitz G, et al. Ubiquitin ligase activity and tyrosine phosphorylation underlie suppression of growth factor signaling by c-Cbl/Sli-1. Mol Cell. 1999;4:1029–1040. doi: 10.1016/s1097-2765(00)80231-2. [DOI] [PubMed] [Google Scholar]
- Lin C, Ear J, Pavlova Y, Mittal Y, Kufareva I, Ghassemian M, Abagyan R, Garcia-Marcos M, Ghosh P. Tyrosine phosphorylation of the Galpha-interacting protein GIV promotes activation of phosphoinositide 3-kinase during cell migration. Sci Signal. 2011;4:ra64. doi: 10.1126/scisignal.2002049. [DOI] [PMC free article] [PubMed] [Google Scholar]
- Lowenstein EJ, Daly RJ, Batzer AG, Li W, Margolis B, Lammers R, Ullrich A, Skolnik EY, Bar-Sagi D, Schlessinger J. The SH2 and SH3 domain-containing protein GRB2 links receptor tyrosine kinases to ras signaling. Cell. 1992;70:431–442. doi: 10.1016/0092-8674(92)90167-b. [DOI] [PubMed] [Google Scholar]
- Miaczynska M, Pelkmans L, Zerial M. Not just a sink: endosomes in control of signal transduction. Curr Opin Cell Biol. 2004;16:400–406. doi: 10.1016/j.ceb.2004.06.005. [DOI] [PubMed] [Google Scholar]
- Murphy JE, Padilla BE, Hasdemir B, Cottrell GS, Bunnett NW. Endosomes: a legitimate platform for the signaling train. Proc Natl Acad Sci USA. 2009;106:17615–17622. doi: 10.1073/pnas.0906541106. [DOI] [PMC free article] [PubMed] [Google Scholar]
- Platta HW, Stenmark H. Endocytosis and signaling. Curr Opin Cell Biol. 2011;23:393–403. doi: 10.1016/j.ceb.2011.03.008. [DOI] [PubMed] [Google Scholar]
- Poppleton H, Sun H, Fulgham D, Bertics P, Patel TB. Activation of Gsalpha by the epidermal growth factor receptor involves phosphorylation. J Biol Chem. 1996;271:6947–6951. doi: 10.1074/jbc.271.12.6947. [DOI] [PubMed] [Google Scholar]
- Poteryaev D, Datta S, Ackema K, Zerial M, Spang A. Identification of the switch in early-to-late endosome transition. Cell. 2010;141:497–508. doi: 10.1016/j.cell.2010.03.011. [DOI] [PubMed] [Google Scholar]
- Rink J, Ghigo E, Kalaidzidis Y, Zerial M. Rab conversion as a mechanism of progression from early to late endosomes. Cell. 2005;122:735–749. doi: 10.1016/j.cell.2005.06.043. [DOI] [PubMed] [Google Scholar]
- Sachse M, Ramm G, Strous G, Klumperman J. Endosomes: multipurpose designs for integrating housekeeping and specialized tasks. Histochem Cell Biol. 2002;117:91–104. doi: 10.1007/s00418-001-0348-0. [DOI] [PubMed] [Google Scholar]
- Schenck A, Goto-Silva L, Collinet C, Rhinn M, Giner A, Habermann B, Brand M, Zerial M. The endosomal protein Appl1 mediates Akt substrate specificity and cell survival in vertebrate development. Cell. 2008;133:486–497. doi: 10.1016/j.cell.2008.02.044. [DOI] [PubMed] [Google Scholar]
- Scita G, Di Fiore PP. The endocytic matrix. Nature. 2010;463:464–473. doi: 10.1038/nature08910. [DOI] [PubMed] [Google Scholar]
- Shin HW, et al. An enzymatic cascade of Rab5 effectors regulates phosphoinositide turnover in the endocytic pathway. J Cell Biol. 2005;170:607–618. doi: 10.1083/jcb.200505128. [DOI] [PMC free article] [PubMed] [Google Scholar]
- Sigismund S, Argenzio E, Tosoni D, Cavallaro E, Polo S, Di Fiore PP. Clathrin-mediated internalization is essential for sustained EGFR signaling but dispensable for degradation. Dev Cell. 2008;15:209–219. doi: 10.1016/j.devcel.2008.06.012. [DOI] [PubMed] [Google Scholar]
- Simonsen A, Lippe R, Christoforidis S, Gaullier JM, Brech A, Callaghan J, Toh BH, Murphy C, Zerial M, Stenmark H. EEA1 links PI(3)K function to Rab5 regulation of endosome fusion. Nature. 1998;394:494–498. doi: 10.1038/28879. [DOI] [PubMed] [Google Scholar]
- Slessareva JE, Routt SM, Temple B, Bankaitis VA, Dohlman HG. Activation of the phosphatidylinositol 3-kinase Vps34 by a G protein alpha subunit at the endosome. Cell. 2006;126:191–203. doi: 10.1016/j.cell.2006.04.045. [DOI] [PubMed] [Google Scholar]
- Sorkin A, von Zastrow M. Endocytosis and signalling: intertwining molecular networks. Nat Rev Mol Cell Biol. 2009;10:609–622. doi: 10.1038/nrm2748. [DOI] [PMC free article] [PubMed] [Google Scholar]
- Stenmark H, Vitale G, Ullrich O, Zerial M. Rabaptin-5 is a direct effector of the small GTPase Rab5 in endocytic membrane fusion. Cell. 1995;83:423–432. doi: 10.1016/0092-8674(95)90120-5. [DOI] [PubMed] [Google Scholar]
- Varsano T, Dong MQ, Niesman I, Gacula H, Lou X, Ma T, Testa JR, Yates JR, 3rd, Farquhar MG. GIPC is recruited by APPL to peripheral TrkA endosomes and regulates TrkA trafficking and signaling. Mol Cell Biol. 2006;26:8942–8952. doi: 10.1128/MCB.00305-06. [DOI] [PMC free article] [PubMed] [Google Scholar]
- Vieira AV, Lamaze C, Schmid SL. Control of EGF receptor signaling by clathrin-mediated endocytosis. Science. 1996;274:2086–2089. doi: 10.1126/science.274.5295.2086. [DOI] [PubMed] [Google Scholar]
- Wang Y, Pennock SD, Chen X, Kazlauskas A, Wang Z. Platelet-derived growth factor receptor-mediated signal transduction from endosomes. J Biol Chem. 2004;279:8038–8046. doi: 10.1074/jbc.M311494200. [DOI] [PubMed] [Google Scholar]
- Zheng B, Lavoie C, Tang TD, Ma P, Meerloo T, Beas A, Farquhar MG. Regulation of epidermal growth factor receptor degradation by heterotrimeric Galphas protein. Mol Biol Cell. 2004;15:5538–5550. doi: 10.1091/mbc.E04-06-0446. [DOI] [PMC free article] [PubMed] [Google Scholar]
- Zoncu R, Perera RM, Balkin DM, Pirruccello M, Toomre D, De Camilli P. A phosphoinositide switch controls the maturation and signaling properties of APPL endosomes. Cell. 2009;136:1110–1121. doi: 10.1016/j.cell.2009.01.032. [DOI] [PMC free article] [PubMed] [Google Scholar]
Associated Data
This section collects any data citations, data availability statements, or supplementary materials included in this article.