

Abstract
Legumes form symbioses with rhizobial bacteria and arbuscular mycorrhizal fungi that aid plant nutrition. A critical component in the establishment of these symbioses is nuclear-localized calcium (Ca2+) oscillations. Different components on the nuclear envelope have been identified as being required for the generation of the Ca2+ oscillations. Among these an ion channel, Doesn't Make Infections1, is preferentially localized on the inner nuclear envelope and a Ca2+ ATPase is localized on both the inner and outer nuclear envelopes. Doesn't Make Infections1 is conserved across plants and has a weak but broad similarity to bacterial potassium channels. A possible role for this cation channel could be hyperpolarization of the nuclear envelope to counterbalance the charge caused by the influx of Ca2+ into the nucleus. Ca2+ channels and Ca2+ pumps are needed for the release and reuptake of Ca2+ from the internal store, which is hypothesized to be the nuclear envelope lumen and endoplasmic reticulum, but the release mechanism of Ca2+ remains to be identified and characterized. Here, we develop a mathematical model based on these components to describe the observed symbiotic Ca2+ oscillations. This model can recapitulate Ca2+ oscillations, and with the inclusion of Ca2+-binding proteins it offers a simple explanation for several previously unexplained phenomena. These include long periods of frequency variation, changes in spike shape, and the initiation and termination of oscillations. The model also predicts that an increase in buffering capacity in the nucleoplasm would cause a period of rapid oscillations. This phenomenon was observed experimentally by adding more of the inducing signal.
Plant growth is frequently limited by the essential nutrients nitrogen and phosphorus. Several plant species have established symbiotic relationships with microorganisms to overcome such limitations. In addition to the symbiotic relationship with arbuscular mycorrhizal fungi that many plants establish in order to secure their uptake of water, phosphorus, and other nutrients (Harrison, 2005; Parniske, 2008), legumes have developed interactions with bacteria called rhizobia, resulting in the fixation of atmospheric nitrogen within the plant root (Lhuissier et al., 2001; Gage, 2004; Riely et al., 2006).
Root symbioses initiate with signal exchanges in the soil. Plant signals are perceived by the symbionts, triggering the successive release of microbial signals. For rhizobia, the signal molecules are lipochitooligosaccharides termed Nod factors (Dénarié et al., 1996), and the release of lipochitooligosaccharides has also been found in the fungal interaction (Maillet et al., 2011). Upon receiving diffusible signals from the microsymbionts, the plant roots initiate developmental programs that lead to infection by rhizobia or arbuscular mycorrhizal fungi. Both programs employ the same signaling pathway with several components being common to both mycorrhizal and rhizobial interactions (Kistner and Parniske, 2002; Lima et al., 2009). In particular, both the symbioses show characteristic perinuclear and nucleoplasmic localized calcium (Ca2+) oscillations, so-called Ca2+ spiking (Oldroyd and Downie, 2006; Sieberer et al., 2009). It has been suggested that Ca2+ is released from an internal store, most likely the nuclear lumen and associated endoplasmic reticulum (ER; Matzke et al., 2009), with targeted release in the nuclear region (Capoen et al., 2011).
Genetic screens in the model legume Medicago truncatula have identified several genes that are required for the plant in the establishment of both symbioses. Two of these, Doesn’t Make Infections1 (DMI1) and DMI2, are essential for the induction of the Ca2+ oscillations, yet the precise roles and mechanisms of these components remain to be determined. DMI2 codes for a plasma membrane receptor-like kinase (Endre et al., 2002; Stracke et al., 2002) that is required to facilitate further signal transduction in the cell (Bersoult et al., 2005). DMI1 is a cation channel located preferentially on the inner nuclear envelope (Ané et al., 2004; Edwards et al., 2007; Riely et al., 2007; Charpentier et al., 2008; Capoen et al., 2011; Venkateshwaran et al., 2012). DMI3 encodes a calcium calmodulin-dependent protein kinase that interacts with downstream components and is thought to be the decoder of the Ca2+ oscillations (Lévy et al., 2004; Mitra et al., 2004; Hayashi et al., 2010). Additional genes coding for three nucleoporins called NUP85, NUP133, and NENA are also required for Ca2+ oscillations (Kanamori et al., 2006; Saito et al., 2007; Groth et al., 2010). The nuclear pore might be involved in trafficking secondary signals and/or ion channels to the inner nuclear membrane. These shared signaling components are collectively referred to as the common Sym pathway.
DMI1 plays a key role in the production of Ca2+ oscillations, but its exact mechanism is still unknown. Orthologs of DMI1 have been found; in Lotus japonicus, they are called CASTOR and POLLUX (Charpentier et al., 2008), and in pea (Pisum sativum), SYM8 (Edwards et al., 2007). CASTOR and POLLUX, as well as calcium calmodulin-dependent protein kinase, are highly conserved both in legumes and nonlegumes (Banba et al., 2008; Chen et al., 2009). This highlights the essential role of the Ca2+ oscillations in mycorrhizal signaling.
DMI1 is not the channel responsible for the release of Ca2+ (Charpentier et al., 2008; Parniske, 2008; Venkateshwaran et al., 2012) but probably influences the activity of Ca2+ channels. This is similar to how some K+ channels act in other plants and yeast (Peiter et al., 2007). Indeed, DMI1 is possibly a K+-permeable channel, based on the observation that POLLUX complements K+ transport in yeast (Charpentier et al., 2008). In symbiosis, the mode of action of DMI1 could be to allow cations into the nuclear envelope and in that way counterbalance the transmembrane charge that would occur following the release of Ca2+ into the nucleoplasm and cytoplasm. The cation channel could thus change the electrical potential across the nuclear membranes, affecting the opening of the voltage-activated Ca2+ channels (Edwards et al., 2007). This hypothesis is supported by a study reporting a membrane potential over the nuclear envelope in plants (Matzke and Matzke, 1986).
Pharmacological evidence and the characteristics of the Ca2+ oscillations supports the involvement of Ca2+ pumps and Ca2+ channels (Engstrom et al., 2002). The pumps are needed to resequester Ca2+ after each release event, actively transporting Ca2+ against the concentration gradient using ATP. A recent study found a SERCA-type Ca2+ ATPase, MCA8, that is located on the inner and outer nuclear envelope of M. truncatula and is required for the symbiotic Ca2+ oscillations (Capoen et al., 2011). Such SERCA pumps are widely distributed on plant membranes, and the variation in their structure points to them being differentially regulated (Sze et al., 2000).
Ca2+ channels release Ca2+ from the store, and the mechanism of activating these Ca2+ channels has been hypothesized to be voltage gated (Edwards et al., 2007; Oldroyd and Downie, 2008), but this remains to be verified experimentally. After release of Ca2+ into the cytosol and nucleoplasm, buffers quickly bind to and remove these free ions due to their toxicity to the cell (Sanders et al., 2002). Buffers, i.e. molecules that can bind Ca2+, may play an important role in determining the nonlinear behavior of the oscillatory system for Ca2+ signaling (Falcke, 2004). As numerous Ca2+ buffers are present in cells, it is important to take their contribution into account. Such buffers can also include experimentally introduced dyes and Ca2+ chelators.
In Capoen et al. (2011), we investigated the establishment and transmission of spatial waves across the nuclear envelope and demonstrated that the key components for Ca2+ spiking reside on the inner and outer surface of the nuclear membrane. The computational framework we employed for this analysis makes a number of approximations in order to provide the computational efficiency required to perform spatiotemporal simulations. Here, a main focus is to understand the effect of buffers on the Ca2+ oscillations.
In this article, we propose a mathematical model based on three key proteins; a Ca2+ ATPase, a voltage-gated Ca2+ channel, and the cation channel DMI1. The model reproduces the symbiotic Ca2+ oscillations, and we further demonstrate that Ca2+-binding proteins can explain initiation, termination, and experimentally observed variation in oscillation patterns. Furthermore, the model predicts that increases in buffering capacity can cause a period of rapid oscillations, and these were observed experimentally.
RESULTS
Assumptions Made to Model Ca2+ Behavior
The model consists of three key proteins: a K+ channel, a voltage-gated Ca2+ channel, and a Ca2+ ATPase. This is illustrated in Figure 1A, as well as these components’ location on the inner nuclear membrane. A more detailed explanation of the nuclear localization is shown in Supplemental Figure S1. The K+ channel represents the protein DMI1 (Venkateshwaran et al., 2012), which is modeled as a driver of changes in membrane voltage (Table I; Supplemental Fig. S5). The Ca2+ channel is assumed to be voltage dependent based on studies supporting such channels in plants (Grygorczyk and Grygorczyk, 1998). The released Ca2+ can feed back and bind to the K+ channel, based on a study predicting partial gating of DMI1 by Ca2+ (Edwards et al., 2007). In animal systems, some Ca2+-gated K+ channels are voltage gated, but the lack of voltage sensor motifs in the transmembrane domain of DMI1 suggests that changes in voltage would have no effect on the conductance of DMI1. The Ca2+ pump is modeled to represent MCA8, a SERCA-type Ca2+ ATPase (Capoen et al., 2011), and it resequesters the released Ca2+ into the Ca2+ store against the concentration gradient. In this model, DMI1 is presumed to be able to change the membrane voltage to provide a counterion current to the Ca2+ movement.
Figure 1.

A, Schematic overview of the basic model. The three key components in the model are the K+ channel, a voltage-gated Ca2+ channel, and a Ca2+ pump depicted on the inner nuclear membrane. B, Experimental Ca2+ oscillations using microinjection of the dyes OG and TR into a M. truncatula root hair cell. The trace has been detrended with the moving average method. C, Simulated Ca2+ oscillations from the basic model shown in A, excluding buffers. D, Phase space diagram of Ca2+ concentration and voltage of the oscillations shown in C. The system trajectory from an arbitrary initial condition is shown as a solid line making one full oscillation. The nullclines for the calcium concentration,  = 0, and for the voltage,
  = 0, are shown as dashed lines. The stable fixed point at (0,ECa) = (0,55) is shown as a closed circle, and the two unstable fixed points as open circles. The parameters can be found in Table II. [See online article for color version of this figure.]
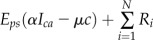
Table I. Equations for the oscillatory calcium model.
v is the voltage difference across the interior nuclear membrane, c is the concentration of Ca2+ in the nucleus, and pi denotes the concentrations of N various buffers for i = 1,…,N. The association and dissociation constants for the ith buffer are labeled  and
and  , and
, and  is the total concentration of the ith buffer. We assume binding to Ca2+ occurs in a 1:1 ratio. The Ca2+ current through the voltage-gated channel is described by Ica, and the K+ current through the K+ channel is described by Ik. Definitions of all parameters are given in Tables II and III.
| Symbol | Equation |
|---|---|
|
 |
|
 |
 |
 |
| Ri | 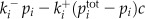 |
|
 |
| Ica | 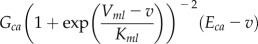 |
| Ik | 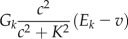 |
The model assumes an inner nuclear envelope localization in M. truncatula root hair cells, based on the preferential localization of DMI1 (Capoen et al., 2011). The nuclear envelope lumen is contiguous with the ER and is assumed to be the Ca2+ store, generating a concentration gradient across the inner nuclear envelope with high Ca2+ levels inside (nuclear envelope lumen) and low Ca2+ levels outside (nucleoplasm). For simplicity, we assumed an infinite Ca2+ store, and there is only one pool of Ca2+ in the model. That pool is the Ca2+ in the nuclear envelope lumen and ER, which can be released into the nucleoplasm.
A Mathematical Model to Recapitulate Ca2+ Oscillations
Our aim is to understand how the nuclear Ca2+ concentration varies over time. We therefore chose to model the symbiotic Ca2+ oscillations with a set of ordinary differential equations (ODEs). ODEs are a convenient way of describing time-dependent behavior. In addition, this framework allows us to build on published results of channel characteristics as a function of current and voltage.
The simple model consists of two ODEs (Table I). The first describes the changes in voltage over the inner nuclear membrane. The second describes the changes in free Ca2+ inside the nucleus. A part of these ODEs is two currents: the Ca2+ current through the Ca2+ channel and the K+ current through the K+ channel. This model is electrical in nature and is similar to a model for action potentials in a pancreatic beta cell (Atwater et al., 1983; Chay and Keizer, 1983; Bertram et al., 2000; Fridlyand et al., 2003, 2009, 2010; Bertram and Sherman, 2004; Tsaneva-Atanasova et al., 2006).
Additional ODEs can be added to this model to account for changes in buffers that bind to Ca2+, and this is described by the term Ri, where i represents an individual buffer species. In the simple model outlined above, Ri is zero. When buffers are present in the model, we assumed they bind Ca2+ in a 1:1 ratio. These buffers represent a perturbation to the basic system presented above. Perturbations such as changes in buffer capacity of the cell can influence the oscillations. Both of the model behaviors, oscillating or resting, are stable in the model; therefore, small perturbations only change the behavior quantitatively (Katok and Hasselblatt, 1995). For example, the introduction of buffers can lead to a change in oscillation frequency. However, when the change in buffer characteristics increases and they become a larger perturbation, then they can also change the time of transition between the two behaviors: oscillations and resting state.
The voltage-dependent Ca2+ channel is modeled with the classical Hodgkin-Huxley-type gates (Izhikevich, 2007). The Ca2+ channels conductance is voltage dependent, while the conductance of the K+ channel is Ca2+ dependent but not voltage dependent. The Ca2+ pump is modeled as electrically neutral, with a constant pump rate, comparable to what has been described for many Ca2+ ATPases (Thomas, 2009); therefore, in the model the Ca2+ ATPase does not contribute to the changes in membrane potential.
Four of the model parameters have been taken from previous measurements: the volume of the nucleus (Brière et al., 2006), the capacitance of the nuclear envelope (Grygorczyk and Grygorczyk, 1998), the resting potential of Ca2+ (Petersen et al., 1998), and a scaling factor relating total Ca2+ changes to changes in free Ca2+ (Brière et al., 2006). The remaining parameters have been estimated, and details on parameter estimation methods can be found in “Materials and Methods.” All the parameter values for the main figures are listed in Tables II and III and in Supplemental Table S1 for the supplemental figures.
Table II. Parameter definitions and values, initial conditions, and constants.
Lit., From the Literature; Fit, numerically fit.
| Symbol | Description | Value | Unit | Source |
|---|---|---|---|---|
| v | Initial voltage | −27.0 | mV | — |
| c | Initial calcium | 0.23 | μ m | — |
| p1 | Initial buffer 1 bound to calcium | 0.0 | μ m | — |
| p2 | Initial buffer 2 bound to calcium | 0.0 | μ m | — |
| Vn | Volume of nucleus | 160 | μm3 | Lit. |
| Cm | Capacitance of nuclear envelope | 5.1 | pF | Lit. |
| Eca | Resting potential of Ca2+ | 55 | mV | Lit. |
| F | Faraday constant | 1014 | fC ⋅ μmol−1 | Lit. |
| Eps | Scaling factor relating total Ca2+ changes to changes in free Ca2+ | 0.001 | — | Lit. |
| α | Conversion of Ca2+ current to Ca2+ flux | 0.03239 | μm ⋅ fC−1 |  |
| Gc | Total maximum conductance of voltage gated Ca2+ channels | 2864 | pS | Fit |
| Vml | Half-maximal activation of voltage gated Ca2+ channel | 50.0 | mV | Fit |
| Kml | Constant in scaling function for voltage gated Ca2+ channel | 14.7 | mV | Fit |
| Gk | Total maximum conductance of Ca2+ activated K+ channels | 302 | pS | Fit |
| K | Constant in Hill function for Ca2+ activated K+ channel | 0.953 | μm | Fit |
| μ | Pump rate into the nuclear envelope | 24.9 | s−1 | Fit |
| Ek | Resting potential of K+ | −17.7 | mV | Fit |
Table III. Buffer parameters used in the figures in the main text.
| Symbol | Description | Fig. 1C | Fig. 2B | Fig. 2D | Fig. 3 | Fig. 4B | Fig. 5A | Fig. 6 | Units |
|---|---|---|---|---|---|---|---|---|---|
 |
calcium off-rate for buffer 1 | — | 0.009 | 0.009 | 5.04 | 1.0 | 1.0 | 5.04 | s−1 |
 |
Kd for buffer 1 | — | 0.19 | 0.19 | 5.4 | 5.4 | 5.4 | 5.4 | μ m |
 |
total concentration of buffer 1 | — | 1.58 | 1.58 | 1.1 | 1.0 | 1.0 | Varied | μ m |
 |
calcium off-rate for buffer 2 | — | 0.15 | 9.9 | 4.5 | 0.004 | 0.006 | 4.5 | s−1 |
 |
Kd for buffer 2 | — | 0.17 | 5.4 | 7.7 | 0.76 | 1.0 | 7.7 | μ m |
 |
total concentration of buffer 2 | — | 0.0015 | 0.001 | Varied | 10.0 | 10.0 | 3.2 | μ m |
In dynamical systems theory, oscillations are called limit cycles and the resting states are called fixed points. We will use this terminology where appropriate.
Implications of the Model
We first evaluated the initial model, lacking buffers, to test the behavior with a minimal set of components. This can provide some valuable insights and clues of how to extend the system to account for further observations. Even this simple setup produced oscillations that correspond well to those experimentally observed (Fig. 1, B and C), suggesting that these three components can create a self-sustaining oscillation. This was achieved by fitting the parameters such that the resulting Ca2+ concentration profile from the model matched a single Nod factor-induced spike. The result is an oscillation, a stable limit cycle, with a period of approximately 85 s that oscillates between 130 and 630 nm Ca2+.
This oscillation is pictured in phase space in Figure 1D. The system also has three points where it does not oscillate, so-called fixed points, in this parameter range at (v,c) = {(55, 0), (54.975, 0.03185), (−2.64, 0.158)}, each of which are unstable except for the point at (55, 0). If the concentration of Ca2+ at the start of the simulation is below a threshold of approximately 22 nm Ca2+, then the system decays to this stable fixed point. The fixed points appear as circles in Figure 1D, while the nullclines for v and c appear in blue and green, respectively. The nullclines are the values for which the voltage or Ca2+ do not change over time. Where nullclines intersect, neither of the system’s variables change, in our case voltage and Ca2+; thus, the system is at rest. In Figure 1D, notice the characteristic inverted “N” shape of the voltage nullcline and its single intersection with the Ca2+ nullcline between the maximum and minimum of the “N.” These features are often associated with oscillations in other models, such as the Morris-Lecar equations (Fall, 2002).
This simple model fails to capture several experimental observations. First, it cannot reproduce differences in spike shapes that are observed using different experimental techniques nor the variation in period seen between and within individual time series. Second, the model fails to mimic a common observation of faster frequency spiking at the start of oscillations. Third, the model will oscillate continuously and thus lacks a termination mechanism. Finally, the experimental data are not real Ca2+ concentrations, but a relative measure of how much Ca2+ is bound to the Ca2+ reporter, an introduced buffer, so we should ideally fit the experimental data to Ca2+ bound to buffers in the simulations. We therefore added Ca2+-binding buffers to the model and investigated their effect on oscillations.
Buffering Capacity: A Key Player in Shaping the Ca2+ Signature?
We investigated the effects of changing the buffer characteristics on the dynamics of the system. Given that DMI1 binds Ca2+ in our model, leading to changes in membrane voltage and the subsequent release of a more Ca2+, it is reasonable to consider that buffers binding to the released Ca2+ might affect the oscillations.
When Ca2+ levels oscillate in the nucleoplasm, the proportion of bound and unbound buffers will also oscillate, since more buffers will bind Ca2+ when more Ca2+ ions are available. The bound buffer could represent a Ca2+ reporter, whose fluorescence indicates the level of Ca2+. However, we observed scenarios in our model where the oscillations of bound buffer do not precisely follow the Ca2+ oscillations. At low off-rates, k−, of Ca2+ from the buffer, the oscillation of the bound buffer lags behind the Ca2+ oscillations by several seconds (Supplemental Fig. S2A). However, as off-rates and dissociation constants, Kd, are increased, the buffer pattern becomes more and more similar to the Ca2+ spikes. Another scenario in which the buffer does not follow the Ca2+ oscillations is when the basal level of Ca2+ and the buffer concentration are higher than the amplitude of the Ca2+ oscillations, and k− and Kd of the buffer are small. In this case (Supplemental Fig. S2B), the concentration of bound buffer initially builds up to the level around which the bound buffer will oscillate. During this phase, a few high frequency Ca2+ spikes are seen before the Ca2+ oscillations settle into a periodic pattern with narrow peaks and long resting periods (about 200 s). However, for the current model with the parameters listed in Tables II and III, we found that the concentration of bound buffers accurately followed the Ca2+ dynamics if there was more than one buffer in the system, as is demonstrated in Supplemental Figure S2C, so the model was extended to include two buffer species.
To measure Ca2+, we use two main experimental techniques of Ca2+ indicators. The first is to inject fluorescent Ca2+-sensitive dyes into the cell, which increase their fluorescence when binding Ca2+ (Rudolf et al., 2003). The second method is to transform the plants with Ca2+ reporter genes that encode proteins that allow increases in Ca2+ to be measured using fluorescent resonant energy transfer (Miyawaki et al., 1999). These two methods show differences in spike shapes as a result of different binding characteristics of the Ca2+ indicators (Fig. 2, A and C). To allow the model to reproduce these experimental data, we optimized the parameters by matching model-generated spikes with different experimentally observed spikes (Fig. 2, B and D). The dissociation constant of one of the buffers was chosen to reflect the Ca2+ indicators typically used in experiments, which is either Ca2+ dyes or a Ca2+ reporter. When the Ca2+ dyes are used, both a sensitive dye and an insensitive dye are injected, and their ratio is taken. This decreases the impact of cytoplasmic streaming on the results. The Ca2+-sensitive dye Oregon Green (OG) has a Kd of 0.17 μm, and the insensitive dye Texas Red (TR) a Kd of 0.76 μm (Molecular Probes), while the Ca2+ reporter Cameleon YC2.1 has a Kd of 5.4 μm (Miyawaki et al., 1999). By changing the buffer characteristics to these known values in Figure 2, we were able to match both OG/TR and Cameleon YC2.1 spike shapes.
Figure 2.

The model parameters can be fitted to approximate different spikes shapes. A, Experimental Ca2+ transients measured using the dyes OG and TR. The y axis is the ratio OG/TR after the trace has been detrended with the moving average method. The spikes were aligned to produce the least squared difference over the shown range. The average spike is shown for comparison with the model. B, A simulated Ca2+ transient with buffer parameters optimized to replicate the shape measured with OG. C, An experimental Ca2+ transient recorded using Cameleon (YC2.1) as a reporter. The y axis is the ratio of YFP/CFP, after the trace has been detrended with the moving average method. The spikes were aligned to produce the least squared difference over the shown range. The average spike is shown for comparison with the model. D, A simulated Ca2+ transient with buffer parameters optimized to replicate the shape measured with Cameleon. The y axes of the simulated data represent the Ca2+ bound to the fluorescent dye/Cameleon complex and thus represent what would be measured in the experiments. The buffer parameter values are given in Table III. [See online article for color version of this figure.]
Experimental traces show a significant variation in period both between and within time series, and by including buffers, this behavior could be captured. In general, large amounts of buffers with large dissociation and association rates cause an increase in the period (Fig. 3). The bifurcation diagrams in Supplemental Figures S3 and S4 summarize the impact of buffers on the oscillations.
Figure 3.

The plot shows how changing the total buffer concentration can increase or decrease the period of the symbiotic Ca2+ oscillation. The simulation has relatively large dissociation and association rates of the Ca2+ buffers, which also slow oscillations, and it includes two buffers: one that was held at a constant concentration and one that was varied. For the buffer parameter values, see Table III.
Prediction and Experimental Validation of Rapid Ca2+ Oscillations
Fast oscillatory transients are often observed in the initial phases of experimental Ca2+ time series (Fig. 4A). To induce oscillations in M. truncatula root hairs, the Nod factor signal from M. truncatula’s symbiont Sinorhizobium meliloti was used, henceforth referred to as Nod factor. After Nod factor application at a concentration of 1 nm, we observed rapid spiking in seven out of 13 cases. We simulate this phenomenon in the case of two buffers in Figure 4B. These periods of rapid spiking in the model simulation are caused by the presence of high levels of unbound buffers, and the rapid spiking lasts until these buffers have been saturated. Therefore, this result suggests a sudden increase in the available buffer concentrations as oscillations start.
Figure 4.

The mathematical model can recapitulate rapid spiking often seen at the beginning of the experimental Ca2+ oscillations. A, An experimental Ca2+ time series showing initial rapid spiking. The data were recorded in a M. truncatula YC2.1 root hair cell and detrended with a moving average. B, Simulated rapid initial spiking. The simulation includes two buffers. The buffer parameter values are given in Table III. [See online article for color version of this figure.]
Furthermore, when the simulations are initiated with one buffer (Kd = 5.4 μm) and we add in another buffer (k− = 0.006 s−1 and Kd = 1 μm) during simulation, then we observe high frequency oscillations, much like the early-stage, high-frequency transients, before a new stable oscillatory pattern with a different frequency is reached (Fig. 5A). If we hypothesize that the perception of Nod factor causes an increase in buffering capacity in the nucleoplasm, then the model predicts that a period of rapid oscillations should occur also if further Nod factor is added during existing oscillations. To test this, we reapplied Nod factor to a cell that was already oscillating (Fig. 5B). As can be seen, the effect predicted by the model could be experimentally reproduced. These observations suggest that Nod factor perception may be accompanied by the production or transport of buffers by the cell to the nucleus.
Figure 5.

Rapid spiking can also be simulated when oscillations have already started by adding in new buffer quantities. This was reproduced experimentally by adding more inducing signal. A, Simulation showing that rapid spiking occurs when a new buffer with a slow dissociation rate is added into the system at 500 s. B, An experimental trace verifying the model prediction shown in A. Initial oscillations were induced with 30 pm Nod factor. At 800 s, a further 10 nm Nod factor was added, and this could induce a period of rapid spiking despite existing oscillations. [See online article for color version of this figure.]
A further observation in the case of multiple buffers concerns signal initiation and termination. We find that increasing the amount of buffer can terminate oscillations (Fig. 6). This observation suggests that secondary buffers and/or the increase in the concentration of a buffer already present may result in signal discontinuation. Either the gain or loss of buffering capacity from the nuclear environment could lead to termination of the Ca2+ oscillations. Likewise, such changes in buffer concentrations or kinetics could be the essence of signal initiation. A change in the amount of buffers with low dissociation constants can drive the system to oscillate.
Figure 6.

Simulation demonstrating how increasing buffer levels can inhibit Ca2+ oscillations. The model included two buffers: one that is held constant and a second that is increasing over time. A, The Ca2+ oscillations terminate as the buffer concentration increases. B, The buffer concentration increases with every time step in the simulation, starting at 2 μm. The other buffer parameter values can be found in Table III. [See online article for color version of this figure.]
DISCUSSION
We developed ODE models of symbiotic Ca2+ oscillations in legumes to suggest plausible key components and mechanisms for signal generation. The basic model consists of (1) a Ca2+ activated ion channel whose function is to hyperpolarize the nuclear membrane (DMI1), (2) a membrane voltage-activated Ca2+ channel that releases Ca2+ into the nucleoplasm, and (3) a Ca2+ pump that pumps Ca2+ back into the nuclear envelope lumen (MCA8). We have shown that the behavior of these three components is sufficient to produce self-sustaining Ca2+ oscillations.
The inclusion of buffers in our system has pronounced effects, consistent with previous observations (Marhl et al., 1997; Falcke 2004). As shown here, the changes in buffering capacity offer an attractive explanation for both the initiation and termination of oscillations. Furthermore, the model predicted that increasing the buffer capacity of an oscillating system would introduce an intermediate phase of rapid oscillations, which was verified experimentally. The observation of rapid spiking upon application of Nod factor prior to sustained, lower frequency oscillations can therefore be understood, as suggested by the modeling, as a consequence of higher buffer availability. These high frequency transients have been experimentally observed both when the cell has not previously come in contact with Nod factor as well as when the cell is already spiking due to prior application of Nod factor. From this we infer that the introduction of Nod factors to the system also brings with it the release of buffers, possibly the migration of calmodulin to the nucleoplasm from the cytosol, as is observed in animal systems when Ca2+ levels become elevated (Deisseroth et al., 1998), or other changes in the nucleoplasm that free up more buffers. This result suggests that components beyond those normally associated with the Sym pathway play a vital role in shaping the Ca2+ signature. Also, the cell-to-cell variability that is often observed may be caused by different concentrations and characteristics of buffers in the different cells.
Differences in Ca2+ oscillation signatures have been seen not only between genetically identical cells, but also between legume species. The aquatic legume Sesbania rostrata has been shown to have faster oscillations when nodulated at lateral root bases, compared with the oscillations associated with root hair invasion in M. truncatula (Capoen et al., 2009). Such differences could be caused by buffers, but could also be caused by other differences, for example, the pump rate. Our model can produce different spike shapes and periods by varying the pump rate (data not shown); however, only a small range of pump rates gives rise to oscillations. Thus, the pump rate is likely to contribute to the oscillatory behavior, but not be the major determining factor for the observed variation. In this article, we therefore focused on the effects of changing buffer characteristics. Ca2+ reporters are known to have different binding kinetics, and Ca2+ buffers are likely to change within cells. By changing the corresponding model parameters, we can account for a range of observations; however, we cannot exclude the, possibly combined, effect of other parameter changes as an alternative explanation.
We hypothesized a purely voltage-controlled Ca2+ channel. Voltage changes in the nuclear membrane of neural cells have been shown to be involved in periodic release of Ca2+ from the nuclear envelope (Yamashita, 2011). However, there are other mechanisms compatible with the data, such as the more complex option of voltage and ligand gating or purely ligand gating (Dodd et al., 2010). When more information is available on the identity and regulation of the Ca2+ channel involved in these symbiotic signals, the proposed model can be modified.
Since we are matching the simulated data to experimental data integrated over one entire cell, this Ca2+ model does not take into account spatial information. A possibility for further developments would be to extend this to a spatial model, which can then include, for example, the location of channels and diffusion rates. This would also allow for testing of other regulatory mechanisms of channels that require spatial information, such as Ca2+-induced Ca2+ release, which is a common mechanism in animal cells (Meyer and Stryer, 1991).
Recently, a study described symbiotic Ca2+ oscillations that occur in the cortical cell layer at later stages of symbiotic entry into the plant root (Sieberer et al., 2011). The authors showed that in both rhizobial and arbuscular mycorrhizal symbioses, the path of progression of the symbiont from the epidermal cell layer down to the cortical cells is preceded by slow Ca2+ oscillations, and, interestingly, the cells show a higher frequency of oscillations as the microbes start to enter the cell (Sieberer et al., 2011). It is interesting to speculate about the cause of this change in oscillation frequency, and one hypothesis could be a change in buffer characteristics in the cell. This could be triggered by a signal from the microbe, such as Nod factors, which would become available as the microbes pass the outer barriers of the cell.
The model presented here is a first attempt to reproduce the symbiotic Ca2+ oscillations based on three proteins that are genetically required or predicted to be required for the oscillations. Although our goal has been to provide insights in symbiotic Ca2+ oscillations, our model is not specific to legumes. Our model builds upon established work in pancreatic beta cells and studies into the effects of buffers in other systems. The proposed working model provides insight into the observed variability of oscillations by studying buffer influences, and it enhances our understanding of how the oscillations are produced.
MATERIALS AND METHODS
Plant Material and Ca2+ Imaging
Two approaches for monitoring Ca2+ in vivo were used. One method is to inject fluorescent Ca2+ indicator dyes into root hair cells of wild-type Medicago truncatula (Rudolf et al., 2003), following the protocol described by Capoen et al. (2009) for M. truncatula. The dyes are nonratiometric, using the Ca2+-sensitive dye OG 488 BAPTA-1-dextran 10,000 Kd and the insensitive TR-dextran 10,000 Kd (Molecular Probes). The resulting time series is the ratio of the two, OG/TR. The second Ca2+ measurement method is to transform the plants with the Ca2+ reporter gene YC2.1, which when expressed indicates Ca2+ levels by fluorescence resonance energy transfer (Miyawaki et al., 1999). A stable line of M. truncatula R108 YC2.1 was used, and the plant growth and imaging followed the protocol described by Miwa et al. (2006). The resulting time series consist of the ratio of yellow fluorescent protein (YFP) and cyan fluorescent protein (CFP).
Data Processing
Data processing was done in the statistical software R before comparing the experimental data to the simulated data. Large jumps caused by the imaging process were removed. The Ca2+ time series were detrended using the moving average method (Ghil et al., 2002) to remove the effect of photobleaching. All experimental traces shown are the ratios of OG/TR or YFP/CFP after detrending.
Model Simulations
The model ODEs are described in Table I. Analysis on candidate models was performed using XPPAUT (http://www.math.pitt.edu/∼bard/xpp/xpp.html; Ermentrout, 2002). The ODEs were solved numerically using a fifth-order Runge-Kutta method with adaptive step-size control (Press, 2002). To study the influence of buffers on system dynamics, exploratory simulations were run in the following value ranges: v = −27.0 − 55.0 mV, c = 0.0 − 1.0 μm, ptot = 0.01 − 10 μm, k− = 0.01 − 1 s−1, and Kd = 0.17 − 0.76 and 5.40 μm.
Parameter Estimations
Initial estimates of the parameters were determined such that the concentration profile matched a single Nod factor-induced spike (Supplemental Fig. S6) using a single shooting algorithm with a particle swarm optimizer with 10,000 particles (He et al., 2007). These parameters are listed and described in Table II. Further parameter refinement was carried out using the following methodology. We extracted all spikes, aligned them so that their squared differences were minimized, and used simulated annealing (Press, 2002) to minimize the least squares distance between the solution to the ODEs and the aligned spikes. We carried out this process for time series obtained using both YC2.1 and OG/TR. These fitted buffer parameters are shown in Table III. The buffer parameters for the supplemental figures are listed in Supplemental Table S1.
Bifurcation Analysis
The bifurcation diagrams were computed using the software package AUTO in XPP (Ermentrout, 2002). The computations were started from a steady state found by varying the parameter Eps, which relates total Ca2+ to free Ca2+. In some cases, AUTO was unable to trace the limit cycles for the entire chosen region of parameter space because of the computationally intensive calculation required.
Supplemental Data
The following materials are available in the online version of this article.
Supplemental Figure S1. The key symbiotic calcium spiking components and their location.
Supplemental Figure S2. Mimicking the calcium oscillations with buffers.
Supplemental Figure S3. System dynamics of buffers and calcium oscillations.
Supplemental Figure S4. Buffers can give rise to a new limit cycle.
Supplemental Figure S5. Key electrical characteristics as a function of the membrane voltage.
Supplemental Figure S6. Spike shapes can be matched to estimate parameters.
Supplemental Table S1. Buffer characteristics.
Glossary
- Ca2+
calcium
- ER
endoplasmic reticulum
- ODE
ordinary differential equation
- Kd
dissociation constant
- k−
low off-rate
- YFP
yellow fluorescent protein
- CFP
cyan fluorescent protein
- OG
Oregon Green
- TR
Texas Red
References
- Atwater I, Rosario L, Rojas E. (1983) Properties of the Ca-activated K+ channel in pancreatic beta-cells. Cell Calcium 4: 451–461 [DOI] [PubMed] [Google Scholar]
- Ané J-M, Kiss GB, Riely BK, Penmetsa RV, Oldroyd GED, Ayax C, Lévy J, Debellé F, Baek J-M, Kalo P, et al. (2004) Medicago truncatula DMI1 required for bacterial and fungal symbioses in legumes. Science 303: 1364–1367 [DOI] [PubMed] [Google Scholar]
- Banba M, Gutjahr C, Miyao A, Hirochika H, Paszkowski U, Kouchi H, Imaizumi-Anraku H. (2008) Divergence of evolutionary ways among common sym genes: CASTOR and CCaMK show functional conservation between two symbiosis systems and constitute the root of a common signaling pathway. Plant Cell Physiol 49: 1659–1671 [DOI] [PubMed] [Google Scholar]
- Bersoult A, Camut S, Perhald A, Kereszt A, Kiss GB, Cullimore JV. (2005) Expression of the Medicago truncatula DM12 gene suggests roles of the symbiotic nodulation receptor kinase in nodules and during early nodule development. Mol Plant Microbe Interact 18: 869–876 [DOI] [PubMed] [Google Scholar]
- Bertram R, Previte J, Sherman A, Kinard TA, Satin LS. (2000) The phantom burster model for pancreatic beta-cells. Biophys J 79: 2880–2892 [DOI] [PMC free article] [PubMed] [Google Scholar]
- Bertram R, Sherman A. (2004) A calcium-based phantom bursting model for pancreatic islets. Bull Math Biol 66: 1313–1344 [DOI] [PubMed] [Google Scholar]
- Brière C, Xiong TC, Mazars C, Ranjeva R. (2006) Autonomous regulation of free Ca2+ concentrations in isolated plant cell nuclei: a mathematical analysis. Cell Calcium 39: 293–303 [DOI] [PubMed] [Google Scholar]
- Capoen W, Sun J, Wysham D, Otegui MS, Venkateshwaran M, Hirsch S, Miwa H, Downie JA, Morris RJ, Ané J-M, et al. (2011) Nuclear membranes control symbiotic calcium signaling of legumes. Proc Natl Acad Sci USA 108: 14348–14353 [DOI] [PMC free article] [PubMed] [Google Scholar]
- Capoen W, Den Herder J, Sun J, Verplancke C, De Keyser A, De Rycke R, Goormachtig S, Oldroyd G, Holsters M. (2009) Calcium spiking patterns and the role of the calcium/calmodulin-dependent kinase CCaMK in lateral root base nodulation of Sesbania rostrata. Plant Cell 21: 1526–1540 [DOI] [PMC free article] [PubMed] [Google Scholar]
- Charpentier M, Bredemeier R, Wanner G, Takeda N, Schleiff E, Parniske M. (2008) Lotus japonicus CASTOR and POLLUX are ion channels essential for perinuclear calcium spiking in legume root endosymbiosis. Plant Cell 20: 3467–3479 [DOI] [PMC free article] [PubMed] [Google Scholar]
- Chay TR, Keizer J. (1983) Minimal model for membrane oscillations in the pancreatic beta-cell. Biophys J 42: 181–190 [DOI] [PMC free article] [PubMed] [Google Scholar]
- Chen C, Fan C, Gao M, Zhu H. (2009) Antiquity and function of CASTOR and POLLUX, the twin ion channel-encoding genes key to the evolution of root symbioses in plants. Plant Physiol 149: 306–317 [DOI] [PMC free article] [PubMed] [Google Scholar]
- Dodd AN, Kudla J, Sanders D. (2010) The language of calcium signaling. Annu Rev Plant Biol 61: 593–620 [DOI] [PubMed] [Google Scholar]
- Deisseroth K, Heist EK, Tsien RW. (1998) Translocation of calmodulin to the nucleus supports CREB phosphorylation in hippocampal neurons. Nature 392: 198–202 [DOI] [PubMed] [Google Scholar]
- Dénarié J, Debellé F, Promé JC. (1996) Rhizobium lipo-chitooligosaccharide nodulation factors: signaling molecules mediating recognition and morphogenesis. Annu Rev Biochem 65: 503–535 [DOI] [PubMed] [Google Scholar]
- Edwards A, Heckmann AB, Yousafzai F, Duc G, Downie JA. (2007) Structural implications of mutations in the pea SYM8 symbiosis gene, the DMI1 ortholog, encoding a predicted ion channel. Mol Plant Microbe Interact 20: 1183–1191 [DOI] [PubMed] [Google Scholar]
- Endre G, Kereszt A, Kevei Z, Mihacea S, Kaló P, Kiss GB. (2002) A receptor kinase gene regulating symbiotic nodule development. Nature 417: 962–966 [DOI] [PubMed] [Google Scholar]
- Engstrom EM, Ehrhardt DW, Mitra RM, Long SR. (2002) Pharmacological analysis of nod factor-induced calcium spiking in Medicago truncatula. Evidence for the requirement of type IIA calcium pumps and phosphoinositide signaling. Plant Physiol 128: 1390–1401 [DOI] [PMC free article] [PubMed] [Google Scholar]
- Ermentrout B. (2002). Simulating, Analyzing, and Animating Dynamical Systems: A Guide to XPPAUT for Researchers and Students. Society for Industrial and Applied Mathematics, Philadelphia [Google Scholar]
- Falcke M. (2004) Reading the patterns in living cells: the physics of Ca2+ signaling. Adv Phys 53: 255–440 [Google Scholar]
- Fall CP. (2002) Computational Cell Biology, Vol 20. Springer, New York [Google Scholar]
- Fridlyand LE, Jacobson DA, Kuznetsov A, Philipson LH. (2009) A model of action potentials and fast Ca2+ dynamics in pancreatic β-cells. Biophys J 96: 3126–3139 [DOI] [PMC free article] [PubMed] [Google Scholar]
- Fridlyand LE, Tamarina N, Philipson LH. (2003) Modeling of Ca2+ flux in pancreatic β-cells: role of the plasma membrane and intracellular stores. Am J Physiol Endocrinol Metab 285: E138–E154 [DOI] [PubMed] [Google Scholar]
- Fridlyand LE, Tamarina N, Philipson LH. (2010) Bursting and calcium oscillations in pancreatic beta-cells: specific pacemakers for specific mechanisms. Am J Physiol Endocrinol Metab 299: E517–E532 [DOI] [PMC free article] [PubMed] [Google Scholar]
- Gage DJ. (2004) Infection and invasion of roots by symbiotic, nitrogen-fixing rhizobia during nodulation of temperate legumes. Microbiol Mol Biol Rev 68: 280–300 [DOI] [PMC free article] [PubMed] [Google Scholar]
- Ghil M, Allen MR, Dettinger MD, Ide K, Kondrashov D, Mann ME, Robertson AW, Saunders A, Tian Y, Varadi F, et al. (2002) Advanced spectral methods for climatic time series. Rev Geophys 40: 3.1–3.41 [Google Scholar]
- Groth M, Takeda N, Perry J, Uchida H, Dräxl S, Brachmann A, Sato S, Tabata S, Kawaguchi M, Wang TL, et al. (2010) NENA, a Lotus japonicus homolog of Sec13, is required for rhizodermal infection by arbuscular mycorrhiza fungi and rhizobia but dispensable for cortical endosymbiotic development. Plant Cell 22: 2509–2526 [DOI] [PMC free article] [PubMed] [Google Scholar]
- Grygorczyk C, Grygorczyk R. (1998) A Ca2+- and voltage-dependent cation channel in the nuclear envelope of red beet. Biochim Biophys Acta 1375: 117–130 [DOI] [PubMed] [Google Scholar]
- Harrison MJ. (2005) Signaling in the arbuscular mycorrhizal symbiosis. Annu Rev Microbiol 59: 19–42 [DOI] [PubMed] [Google Scholar]
- Hayashi T, Banba M, Shimoda Y, Kouchi H, Hayashi M, Imaizumi-Anraku H. (2010) A dominant function of CCaMK in intracellular accommodation of bacterial and fungal endosymbionts. Plant J 63: 141–154 [DOI] [PMC free article] [PubMed] [Google Scholar]
- He Q, Wang L, Liu B. (2007) Parameter estimation for chaotic systems by particle swarm optimization. Chaos Solitons Fractals 34: 654–661 [Google Scholar]
- Izhikevich EM. (2007) Dynamical Systems in Neuroscience: The Geometry of Excitability and Bursting. MIT Press, Cambridge, MA [Google Scholar]
- Kanamori N, Madsen LH, Radutoiu S, Frantescu M, Quistgaard EMH, Miwa H, Downie JA, James EK, Felle HH, Haaning LL, et al. (2006) A nucleoporin is required for induction of Ca2+ spiking in legume nodule development and essential for rhizobial and fungal symbiosis. Proc Natl Acad Sci USA 103: 359–364 [DOI] [PMC free article] [PubMed] [Google Scholar]
- Katok A, Hasselblatt B. (1995). Introduction to the Modern Theory of Dynamical Systems. Cambridge University Press, Cambridge, UK [Google Scholar]
- Kistner C, Parniske M. (2002) Evolution of signal transduction in intracellular symbiosis. Trends Plant Sci 7: 511–518 [DOI] [PubMed] [Google Scholar]
- Lhuissier FGP, De Ruijter NCA, Sieberer BJ, Esseling JJ, Emons AMC. (2001) Time course of cell biological events evoked in legume root hairs by rhizobium nod factors: state of the art. Ann Bot (Lond) 87: 289–302 [Google Scholar]
- Lima PT, Faria VG, Patraquim P, Ramos AC, Feijó JA, Sucena E. (2009) Plant-microbe symbioses: new insights into common roots. Bioessays 31: 1233–1244 [DOI] [PubMed] [Google Scholar]
- Lévy J, Bres C, Geurts R, Chalhoub B, Kulikova O, Duc G, Journet E-P, Ané J-M, Lauber E, Bisseling T, et al. (2004) A putative Ca2+ and calmodulin-dependent protein kinase required for bacterial and fungal symbioses. Science 303: 1361–1364 [DOI] [PubMed] [Google Scholar]
- Maillet F, Poinsot V, André O, Puech-Pagès V, Haouy A, Gueunier M, Cromer L, Giraudet D, Formey D, Niebel A, et al. (2011) Fungal lipochitooligosaccharide symbiotic signals in arbuscular mycorrhiza. Nature 469: 58–63 [DOI] [PubMed] [Google Scholar]
- Marhl M, Schuster S, Brumen M, Heinrich R. (1997) Modeling the interrelations between the calcium oscillations and ER membrane potential oscillations. Biophys Chem 63: 221–239 [DOI] [PubMed] [Google Scholar]
- Matzke M, Weiger TM, Papp I, Matzke AJM. (2009) Nuclear membrane ion channels mediate root nodule development. Trends Plant Sci 14: 295–298 [DOI] [PubMed] [Google Scholar]
- Matzke MA, Matzke AJM. (1986) Visualization of mitochondria and nuclei in living plant cells by the use of a potential-sensitive fluorescent dye. Plant Cell Environ 9: 73–77 [Google Scholar]
- Meyer T, Stryer L. (1991) Calcium spiking. Annu Rev Biophys Biophys Chem 20: 153–174 [DOI] [PubMed] [Google Scholar]
- Mitra RM, Gleason CA, Edwards A, Hadfield J, Downie JA, Oldroyd GED, Long SR. (2004) A Ca2+/calmodulin-dependent protein kinase required for symbiotic nodule development: Gene identification by transcript-based cloning. Proc Natl Acad Sci USA 101: 4701–4705 [DOI] [PMC free article] [PubMed] [Google Scholar]
- Miwa H, Sun J, Oldroyd GED, Downie JA. (2006) Analysis of calcium spiking using a cameleon calcium sensor reveals that nodulation gene expression is regulated by calcium spike number and the developmental status of the cell. Plant J 48: 883–894 [DOI] [PubMed] [Google Scholar]
- Miyawaki A, Griesbeck O, Heim R, Tsien RY. (1999) Dynamic and quantitative Ca2+ measurements using improved cameleons. Proc Natl Acad Sci USA 96: 2135–2140 [DOI] [PMC free article] [PubMed] [Google Scholar]
- Oldroyd GED, Downie JA. (2006) Nuclear calcium changes at the core of symbiosis signalling. Curr Opin Plant Biol 9: 351–357 [DOI] [PubMed] [Google Scholar]
- Oldroyd GED, Downie JA. (2008) Coordinating nodule morphogenesis with rhizobial infection in legumes. Annu Rev Plant Biol 59: 519–546 [DOI] [PubMed] [Google Scholar]
- Parniske M. (2008) Arbuscular mycorrhiza: the mother of plant root endosymbioses. Nat Rev Microbiol 6: 763–775 [DOI] [PubMed] [Google Scholar]
- Peiter E, Sun J, Heckmann AB, Venkateshwaran M, Riely BK, Otegui MS, Edwards A, Freshour G, Hahn MG, Cook DR, et al. (2007) The Medicago truncatula DMI1 protein modulates cytosolic calcium signaling. Plant Physiol 145: 192–203 [DOI] [PMC free article] [PubMed] [Google Scholar]
- Petersen OH, Gerasimenko OV, Gerasimenko JV, Mogami H, Tepikin AV. (1998) The calcium store in the nuclear envelope. Cell Calcium 23: 87–90 [DOI] [PubMed] [Google Scholar]
- Press WH. (2002) Numerical Recipes in C++: The Art of Scientific Computing, Ed 2. Cambridge University Press, Cambridge, UK [Google Scholar]
- Riely BK, Lougnon G, Ané J-M, Cook DR. (2007) The symbiotic ion channel homolog DMI1 is localized in the nuclear membrane of Medicago truncatula roots. Plant J 49: 208–216 [DOI] [PubMed] [Google Scholar]
- Riely BK, Mun J-H, Ané J-M. (2006) Unravelling the molecular basis for symbiotic signal transduction in legumes. Mol Plant Pathol 7: 197–207 [DOI] [PubMed] [Google Scholar]
- Rudolf R, Mongillo M, Rizzuto R, Pozzan T. (2003) Looking forward to seeing calcium. Nat Rev Mol Cell Biol 4: 579–586 [DOI] [PubMed] [Google Scholar]
- Saito K, Yoshikawa M, Yano K, Miwa H, Uchida H, Asamizu E, Sato S, Tabata S, Imaizumi-Anraku H, Umehara Y, et al. (2007) NUCLEOPORIN85 is required for calcium spiking, fungal and bacterial symbioses, and seed production in Lotus japonicus. Plant Cell 19: 610–624 [DOI] [PMC free article] [PubMed] [Google Scholar]
- Sanders D, Pelloux J, Brownlee C, Harper JF. (2002) Calcium at the crossroads of signaling. Plant Cell (Suppl) 14: S401–S417 [DOI] [PMC free article] [PubMed] [Google Scholar]
- Sieberer BJ, Chabaud M, Timmers AC, Monin A, Fournier J, Barker DG. (2009) A nuclear-targeted cameleon demonstrates intranuclear Ca2+ spiking in Medicago truncatula root hairs in response to rhizobial nodulation factors. Plant Physiol 151: 1197–1206 [DOI] [PMC free article] [PubMed] [Google Scholar]
- Sieberer BJ, Chabaud M, Fournier J, Timmers ACJ, Barker DG. (2011). A switch in Ca2+ spiking signature is concomitant with endosymbiotic microbe entry into cortical root cells of Medicago truncatula Plant J 69: 822–830 [DOI] [PubMed] [Google Scholar]
- Stracke S, Kistner C, Yoshida S, Mulder L, Sato S, Kaneko T, Tabata S, Sandal N, Stougaard J, Szczyglowski K, et al. (2002) A plant receptor-like kinase required for both bacterial and fungal symbiosis. Nature 417: 959–962 [DOI] [PubMed] [Google Scholar]
- Sze H, Liang F, Hwang I, Curran AC, Harper JF. (2000) Diversity and regulation of plant Ca2+ pumps: insights from expression in yeast. Annu Rev Plant Physiol Plant Mol Biol 51: 433–462 [DOI] [PubMed] [Google Scholar]
- Thomas RC. (2009) The plasma membrane calcium ATPase (PMCA) of neurones is electroneutral and exchanges 2 H+ for each Ca2+ or Ba2+ ion extruded. J Physiol 587: 315–327 [DOI] [PMC free article] [PubMed] [Google Scholar]
- Tsaneva-Atanasova K, Zimliki CL, Bertram R, Sherman A. (2006) Diffusion of calcium and metabolites in pancreatic islets: killing oscillations with a pitchfork. Biophys J 90: 3434–3446 [DOI] [PMC free article] [PubMed] [Google Scholar]
- Yamashita M. (2011) Fluctuations in nuclear envelope’s potential mediate synchronization of early neural activity. Biochem Biophys Res Commun 406: 107–111 [DOI] [PubMed] [Google Scholar]
- Venkateshwaran M, Cosme A, Han L, Banba M, Satyshur KA, Schleiff E, Parniske M, Imaizumi-Anraku H, Ané JM. (2012) The recent evolution of a symbiotic ion channel in the legume family altered ion conductance and improved functionality in calcium signaling. Plant Cell 24: 2528–2545 [DOI] [PMC free article] [PubMed] [Google Scholar]