

Abstract
Improving the access to effective and affordable healthcare has long been a global endeavor. In this quest, the development of cost-effective and easy-to-use medical testing equipment that enable rapid and accurate diagnosis is essential to reduce the time and costs associated with healthcare services. To this end, point-of-care (POC) diagnostics plays a crucial role in healthcare delivery in both the developed and developing countries by bringing medical testing to patients, or to sites near patients. As the diagnosis of a wide range of diseases, including various types of cancers and many endemics relies on optical techniques, numerous compact and cost-effective optical imaging platforms have been developed in recent years for use at the POC. Here, we review the state-of-the-art optical imaging techniques that can have significant impact on global health by facilitating effective and affordable POC diagnostics.
1. Introduction
Early detection and accurate diagnosis are critical for effective treatment and prevention of diseases. In many cases, diagnosis unfortunately requires time-consuming and costly procedures and instruments, which limit their application and use to centralized settings with relatively advanced infrastrutures and well-trained healthcare professionals. Although such resources are readily available in developed countries, the cost of healthcare can still be prohibitive for patients to seek early diagnosis. In developing countries and low-resource environments, however, access to adequate medical equipment may not even be available. Unfortunately, most infectious diseases are still endemic in developing countries, significantly elevating the need for cost-effective and easy-to-use medical technologies. To address these issues, much research has been devoted to develop diagnostic tools for use at the point of care (POC). While the specific requirements may vary, POC devices should ideally be portable and cost-effective, while also providing reliable and rapid results to enable immediate clinical decisions to be made.1–19 The availability of such systems would not only reduce the costs and turn-around times associated with medical testing, but also help provide rapid and reliable healthcare to remote and resource limited settings.
Optical imaging techniques, in general, offer a number of important advantages for developing medical devices for diagnosis at the POC. Optical imaging can provide real-time and high-resolution microscopic and macroscopic information toward rapid and accurate diagnosis. The recent advances in a wide range of optical technologies such as optoelectronics, optical fibres, micro-optics and optical micro-electromechanical-systems (MEMS) further enable the miniaturization of optical imaging platforms as well as reduction of their costs. Morever, with the rapid growth of the consumer electronics market in recent years, high-performance imaging devices such as camera phones have become ubiquitous. In addition to being portable, compact and cost-effective, camera phones are also becoming a platform of choice for the development of various POC diagnostic tools. Furthermore, integration of microfluidic systems20–34 with these emerging optical detection platforms also paves the way for next generation lab-on-a-chip diagnostic technologies for use at the POC.
In this Review, we will focus on optical imaging techniques that are developed for POC diagnostics. We will first review in vitro optical imaging techniques, including various portable imaging tools, microscopes running on cell-phones, and emerging lensfree on-chip microscopes, which can be particularly useful for POC diagnostics in developing countries and low-resource settings. Next, we will review in vivo optical imaging modalities such as confocal microscopy, microendoscopy and optical coherence tomography (OCT) techniques. These in vivo imaging approaches can find use in both the developed and the developing countries, for e.g., early detection of cancer. The last section of this Review will discuss other recent innovations around optical imaging techniques that utilize cell-phones for evaluation of various diseases and medical conditions.
2. In vitro Optical Imaging Techniques for POC Diagnostics
2.1 Optical Microscopes
Light microscopy has been a powerful tool for biomedical research and clinical applications for several centuries. Microscopic inspection of specimen (e.g., tissue, sputum, or blood film) is still regarded as the gold standard for diagnosis of many diseases, especially for infectious diseases, such as Malaria and Tuberculosis (TB).35–36 Among various optical microscopy platforms, fluorescent microscopy has particular importance due to its high sensitivity and specificity.37 Conventional bright-field and fluorescent microscopes, however, are relatively bulky and costly, impeding their use beyond well-established and advanced laboratory facilities.
To address these limitations, there has been a considerable effort to develop compact and cost-effective microscopy modalities. Richards-Kortum group developed a Global Focus microscope (see Figure 1(A)), which is a portable, compact (7.5 × 13 × 18 cm) and light-weight (less than 1 kg) inverted bright-field and fluorescence microscope.38 This Global Focus microscope utilizes a battery-powered light emitting diode (LED) flashlight as the illumination source. A white LED is used for bright-field illumination, while a blue LED with a narrow spectral bandwidth excitation filter is utilized for fluorescence excitation. The Global Focus microscope achieves a spatial resolution of ~0.8 μm at 1000× magnification providing sufficient sensitivity to identify malaria parasites in bright-field mode and tuberculosis bacilli (see Figure. 1(B)) in fluorescent mode.
Figure 1.

(A) Shows a picture of the Global Focus microscope.38 Yellow arrows show the trans-illumination light path of the microscope. (B) Left image is the photograph of M. Tuberculosis bacilli stained with auramine orange, obtained with the Global Focus microscope at 400x magnification. Right image is a digital magnification detail of an M. tuberculosis bacillus. Reprinted from Ref. 38 with permission from PLoS One.
More recently, Schnitzer group also introduced a miniature integrated fluorescent microscope that was made of mass-producible parts, including simple LEDs and a CMOS sensor (see Figure 2).39–40 It has a maximum field-of-view (FOV) of 600 μm × 800 μm, and an optical magnification of 5× with a lateral resolution of 2.5 μm. Although this integrated microscope has been utilized to image mouse brain over an active area of ~0.5 mm2, it also holds potential for POC diagnostics applications.
Figure 2.

Miniature integrated fluorescent microscope.40 (A) Schematic illustration of an integrated microscope (shown in cross-section). (B) A photograph of an assembled integrated microscope. Insets, filter cube (bottom left), CMOS camera chip (top right) and PCB holding the LED illumination source (bottom right). Scale bar 5 mm. Reprinted from Ref. 40 with permission from Nature Publishing Group.
One possible drawback of these portable and compact microscope designs is their relatively small FOV. In order to image larger FOVs, e.g., a sputum smear, opto-mechanical components would be required to manually scan the sample. To address this FOV limitation, Tkaczyk group proposed a low-cost and compact digital array microscope platform capable of imaging separate FOVs without using opto-mechanical components.41 This microscope design includes an array of illumination LEDs and microscope objectives to sequentially image multiple FOVs onto the CCD of a commercially available full frame digital single lens reflex (DSLR) camera (see Figure 3). In their initial work, a single prototype miniature objective with a numerical aperture (NA) of 0.5 was developed, providing a spatial resolution of 0.63 μm over an FOV of 0.54 mm in diameter. This miniature objective was integrated to a Zeiss PrimoStar microscope to show TB images with good diagnostic imaging quality (see Figure 3(C)).
Figure 3.

(A) Schematic illustration of an integrated tuberculosis diagnosis platform.41 (B) Array microscope with separated, discontinuous fields of view. (C) Overlapping images of a positive sputum smear sample. Left and right digital images can be added numerically to form an overlapping image. Bacilli in the originally image can be seen in the overlapped image as indicated by the arrow. Reprinted from reference 41 with permission from Elsevier.
Along the same lines, several other research groups have recently developed cell-phone based bright-field and fluorescent microscopes particularly for global health applications using different approaches.42–46 According to the International Telecommunication Union (ITU), the number of cell-phone subscribers reached more than 5 billion worldwide and the majority of these users are located in the developing countries.47 Moreover, with the advances in mobile processors, images taken by a cell-phone microscope can be immediately processed and analyzed with the help of smart algorithms. Today’s global wireless infrastructure also permits transmission of these images to remote locations for telemedicine applications. Therefore ubiquitous cell-phone based microscopes can provide unique opportunities to combat global health problems, especially in developing countries.
Towards this end, Fletcher group developed a microscope attachment for cell-phones that is capable of both bright-field and fluorescent imaging (see Figure 4(A)).42 This microscope utilizes trans-illumination configuration with standard microscope eyepieces and objectives; magnification and resolution can be adjusted using different objectives. This mobile microscope provides a spatial resolution of ~ 1.2 μm across a FOV of ~ 0.025 mm2 using a 0.85 NA 60× achromatic objective and a 20× wide-field microscope eyepiece. This cell-phone microscope shows promising results for clinical use by imaging P. falciparum-infected and sickled red blood cells in bright-field mode, and M. tuberculosis-infected sputum samples in fluorescent mode with LED excitation. Using a similar architecture, Wachsmann-Hogiu group also developed a bright-field microscope and spectroscope on a cell-phone.46 This cell-phone microscope employs a 1 mm ball lens directly attaching to the cell-phone camera with a rubber ring and white-LED covered by matte-finished adhesive tape illuminating from the top. This configuration gives a magnification of 350× fold, providing a resolution of ~1.5 μm over a FOV of 150 μm × 150 μm without a digital processing step, and ~350 μm × 350 μm with digital post-processing. It has been used to image stained and unstained blood smears showing comparable results to a conventional bright-field microscope (see Figure 4(B)).
Figure 4.

(A) (Left) mobile phone microscope prototype,42 with LED and filters installed, capable of fluorescent imaging. (Right) the bright field and fluorescent imaging of 6 μm beads. (B) Micrographs of peripheral blood smears obtained by the cell phone microscope.46 Upper row: conventional microscope images. Bottom row: cell phone microscope images. Left column, images of normal blood sample. Center column, images of blood sample with iron deficiency anemia. Right column, images of blood sample with sickle cell anemia. Reprinted from references 42 and 46 with permission from PLoS One.
These cell-phone based bright-field and fluorescent microscopes can be particularly useful for diagnosing infectious diseases in developing countries. Meanwhile, there is also a need for more compact and higher throughput platforms that can image larger sample areas and volumes. This is especially critical for cytometry applications48 as well as for detection of rare cells and pathogens. Toward this end Ozcan group developed a wide-field fluorescent microscope on a cell-phone using a compact and light-weight optical attachment interfacing the existing camera-unit of a cell-phone (see Figure 5(A–B)).44 Instead of using epi-illumination or transmission illumination, this wide-field fluorescent microscope utilizes a side-illumination configuration using guided waves.49 In this approach, the fluorescent sample is pumped using battery-powered LEDs butt-coupled to the sample from the side. Due to the large cross-section of the sample holder and the LEDs, this butt-coupling scheme is rather tolerant to misalignments. In this design (see Figure 5), the sample holder (whether it is a glass-sample-glass assembly, a glass capillary or polydimethysiloxane (PDMS) microfluidic chip) acts as a multi-mode waveguide and the pump light is guided within the sample holder to uniformly excite the specimen. The fluorescent emission is then collected and imaged using a simple lens that is placed in front of the cell-phone camera unit. An inexpensive plastic absorption filter is used to reject the scattered pump light and provide the dark-field background for the fluorescent imaging. This side illumination approach greatly simplifies the optical design and eliminates the need for expensive interference filters that are typically employed in conventional fluorescent microscopes. This renders the optical attachment to be rather compact (3.5 × 5.5 × 2.4 cm) and cost-effective. This wide-field cell-phone based microscope has achieved a raw (without postprocessing) resolution of ~ 20 μm over an ultra-wide FOV of ~ 81 mm2. With further digital processing of the captured cell-phone images, spatial resolution is improved by two folds, down to ~10 μm, without trading off the imaging FOV (~ 81 mm2). This fluorescent cell-phone microscope has been used to image fluorescent labeled white blood cells (WBCs) (see Figure 5(C)) and water-born parasites such as Giardia cysts. The capability of this fluorescent microscope to image such large FOVs can be useful to screen large sample volumes (e.g. > 0.1 mL) for detection and imaging of cells at low concentrations. In addition, this wide-field cell-phone microscope can also be used as a “fluorescent assay reader” to quantify various fluorescent assays. To this end, a quantum-dot (QD) based sandwich immunoassay using glass capillaries as solid phase for the detection of Escherichia coli (E. Coli) on a cellphone has also been recently introduced.50 The fluorescent signal reporter QDs are excited by butt-coupled LEDs, and the fluorescent emission from the capillaries is directly imaged by the cell-phone microscope. The integrated fluorescent intensity along the capillary length is further quantified to correlate to the E. Coli concentration. This hybrid fluorescent imaging and sensing system provides a detection limit of 5 to 10 CFU per mL for E. Coli spiked in buffer solution and fat-free milk. These promising results illustrate that the wide-field microscopy tools can provide simple solutions for “reading” various microfluidics-based fluorescent assays that have already been developed for POC use.
Figure 5.

(A–B) An illustration and photograph of the wide-field fluorescent microscope on a cell-phone.44 The weight of the entire attachment is ~ 28 grams (~ 1 ounce) and the dimensions of the attachment are ~3.5 × 5.5 × 2.4 cm. (C) Cell-phone images of labeled WBCs (cropped), compressively-decoded (CS) images and conventional fluorescence microscope images of the same labeled WBCs are provided from left-to-right of the panel, respectively. Arrows point to WBCs that are resolved by CS. Reprinted from reference 44 with permission from RSC publishing.
To further increase the imaging throughput, Ozcan group also devised a fluorescent imaging flow-cytometer on a cell-phone45 (see Figure 6(A–B)). In this design, a simple PDMS based microfluidics channel is positioned in front of the cell-phone camera unit. This PDMS-liquid-PDMS channel structure forms an optofluidic slab-waveguide that confines the LED light to excite the fluorescent cells flowing through the channel. The sample is continually pumped through the microfluidic channel using a syringe pump. The cell-phone camera records a time-lapse video of the flow, and the microscopic movie of the flowing fluorescent labeled cells is then analyzed via a tracking algorithm to determine the number the cells flowing through the chamber. The device has been used to count the total white blood cells in diluted human whole blood samples, and the results provided by this cell-phone based imaging cytometer matched quite well to those of a standard hematology analyzer (see Figure 6(C–D)). This cell-phone based optofluidic flow cytometer could be especially useful for rapid screening of large volumes of fluids in resource-limited settings.
Figure 6.

(A–B) An illustration and photograph of the fluorescent imaging flow cytometry on a cell-phone.45 The entire attachment has dimensions of ~ 35 × 55 × 27.9 mm and a weight of ~ 18 grams. Total white blood cell counting results for a low WBC density sample (5000 cells/μL) (C) and for a higher WBC density sample (7800 cells/μL) (D) obtained from the cell-phone based imaging flow-cytometer Reprinted from reference 45 with permission from ACS publishing.
The above discussed field-portable microscopes and cell-phone based imaging platforms have demonstrated a spatial resolution in micrometer scale, which can be sufficient for a wide range of imaging applications for POC diagnostics. Nevertheless, there is also an important need to detect and characterize specimen at much smaller scales, such as viruses. To this end, Unlu group developed an imaging interferometer (see Figure 7) capable of detecting and sizing individual low-index nanoparticles and viruses on a robust imaging platform.51 The interferometric reflectance imaging (IRIS) system utilizes a common-path configuration (see Figure 7(A)), which consists of a thin silicon dioxide layer on a silicon substrate. When nanoparticles are immobilized on the surface, the interference of the scattered and back-reflected light gives a quantifiable signal that is used to detect and size the particles on the surface. The unique signatures for different nanoparticles can be obtained using multiple illumination wavelengths. To achieve that, IRIS utilizes LEDs at different colors to detect individual nanoparticles and intact viruses. The interferometric response on the surface is captured by a telescopic imaging system through a 50× objective lens (NA=0.8) and imaged on a CCD sensor array. With this configuration, IRIS was shown to accurately detect and size nanoparticles ranging from 70 nm to 200 nm in diameter. Furthermore, detection of H1N1 virions in a single experiment was also demonstrated.51
Figure 7.
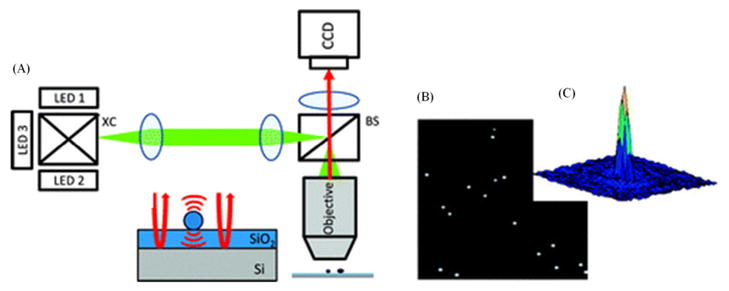
(A) Schematic of the interferometric reflectance imaging (IRIS).51 XC: X-cube used to combine the beams of the different LEDs. BS: beam splitter. (B) Interferometric intensity image of 150 nm diameter beads at a wavelength of 635 nm. (C) Response of a single 150 nm particle shown in (B). Reprinted from reference 51 with permission from ACS publishing.
2.2 Lensfree Computational Imaging Techniques
Another approach to developing imaging systems for POC applications has been to use computation to simplify the architecture of the optical imaging platform. Following this rationale, lensfree on-chip imaging eliminates the need for bulky and complex optics, and can be composed of as few components as a single light source (e.g., an LED) and a detector array. Typically, computational reconstruction methods are used to eliminate diffraction and/or undersampling effects that arise as a result of the absence of optical components and to obtain microscope-like images. Not being restricted by the small FOVs of conventional objective lenses, lensfree on-chip imaging offers high-resolution over a large FOV (e.g., > 24–30 mm2), in a cost-effective and field-portable architecture, making it especially suitable for imaging at the POC. Currently there are two mainstream approaches for lensfree on-chip imaging, digital inline holography and contact imaging, which will be reviewed next.
Lensfree on-chip imaging based on digital in-line holography
In on-chip digital in-line holography (see Figure 8), the sample is directly placed on top of an optoelectronic sensor array (such as a CMOS chip) with a vertical distance of Z2 <1–5 mm. A partially coherent light source, such as an LED, is first spatially filtered by a relatively large pinhole (~ 50–100 μm in diameter), without the need for any coupling optics and opto-mechanical components.52,53 This large aperture size also makes it robust to mechanical misalignments, making it highly suitable for field use by minimally trained personnel.53 The spatially filtered LED light then propagates a distance Z1 of e.g., 40–100 mm towards the sample plane, acquiring sufficient spatial coherence such that individual micro-objects are effectively illuminated with coherent light. The interference of the light scattered by the object (i.e., the object wave) with the unscattered portion of the illumination (i.e., the reference wave) creates in-line holograms of each object (with unit fringe magnification), which is recorded by the CMOS sensor array. Iterative phase recovery techniques are then used to reconstruct the holograms and obtain microscopic images of the samples placed on the sensor chip.52–55
Figure 8.
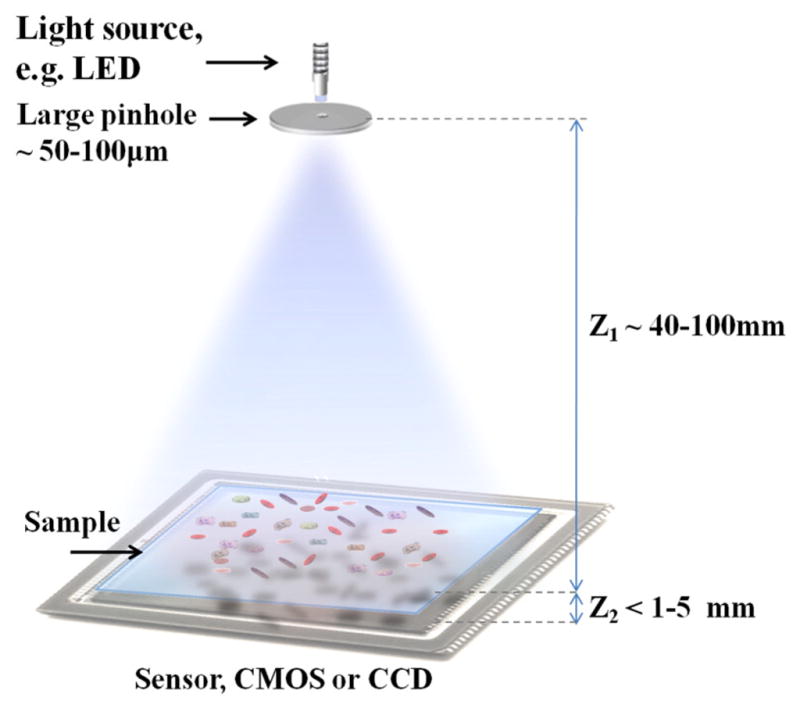
Schematic illustration of the lensfree on-chip holography platform.52,53,58,59 The objects are placed directly on a digital sensor array with typically Z2~ 1 mm distance to its active area. A partially-coherent light source, such as an LED, is placed Z1~ 40–100 mm away from the objects, and spatially filtered by a pinhole of diameter d~0.05–0.1 mm to record the digital in-line holograms of objects with unit fringe magnification over a large field-of-view (FOV), e.g., 24 mm2.
This compact, cost-effective, and robust lensfree in-line holography method can be particularly useful to build field-portable microscopes for POC applications.53 To this end, several different optical microscopes have been introduced by Ozcan group based on the partially coherent in-line holography approach.52–54,56–68 Earlier portable lensfree microscope prototypes are composed of a single LED, a pinhole, a sample tray and a CMOS image sensor.53 This design provides a lightweight (~ 42 grams) and compact (4.2 cm × 4.2 cm × 5.8 cm) device that is suitable for imaging at the POC. Despite its simplicity, it can provide a spatial resolution of ~ 1.5 μm over a large FOV of 24 mm2. This holographic microscope was shown to count red blood cells (RBCs) with an error less than 5% up to a concentration of 0.4 million cells per μL. Moreover, accurate cell volume and hemoglobin density measurements for RBCs were also demonstrated.58 Furthermore, white blood cell (WBC) imaging at sub-cellular resolution, and automated counting with < 4% error, was also shown using the same interface. In addition to blood analysis, this portable lensfree holographic microscope has also been used to image different types of pathogenic protozoan parasites, such as Giardia Lamblia and Cryptosporidium Parvum toward water quality inspection.59 Accurate quantification of Giardia Lamblia at concentrations as low as ~ 380 parasites per mL was achieved with a mean error of < 10%.
Recently, using the same on-chip digital in-line holography concept, a lensfree microscope running on a cell-phone has also been developed.43 A cost-effective add-on unit that is composed of an LED, a large pinhole (e.g., 0.05–0.1 mm), a sample tray and a battery is directly attached to the cell-phone body for lensfree imaging43. This cell-phone based holographic microscope has achieved a spatial resolution of ~1.5–2 μm over a FOV of ~24 mm2. This platform could be particularly useful for telemedicine applications, as the lensfree holographic images that are acquired by the cell-phone can be wirelessly transmitted to a remote server for rapid data processing as well as expert (e.g., pathologist) analysis.
In the above discussed lensfree on-chip holographic microscopy modalities, spatial resolution can be limited by the pixel size of the image sensor (i.e., sampling period) as no lenses are used for optical magnification. To mitigate this spatial under sampling problem and to improve the imaging resolution down to sub-micron scale, multi-frame pixel super resolution (SR) techniques are utilized.60–61,69,70 Pixel SR is a digital approach that synthesizes one super-resolved image from a stack of lower-resolution images. Each image in the stack is sub-pixel shifted with respect to another, thus contains slightly different information. The sub-pixel shifts between the lower resolution images can be achieved by mechanically shifting the light source,60 using multiple LEDs,61 or translating the object itself.68 Recent progress in lensfree computational on-chip microscopy techniques has achieved a numerical aperture of ~ 0.8 – 0.9 (in air and in oil, respectively) over a large FOV that is more than 20 mm2, also demonstrating giga-pixel microscopic imaging on a chip.54
This pixel SR approach has been recently implemented in a field-portable microscope design.61 This microscope provides sub-micron spatial resolution over a large FOV (~ 24–30 mm2) in a compact and light-weight (~ 95 grams) design. In this device, source shifting is achieved, without any mechanical scanning, using an array of 23 LEDs (see Figure 9A and B) that are individually butt-coupled to multi-mode fibers (core diameter ~0.1 mm). Since each fiber tip is physically located at a slightly different position, 23 sub-pixel shifted holograms can easily be recorded by sequentially turning on each LED using a low-cost micro-controller. The pixel super-resolved images obtained by this microscope provide enhanced resolution (for both phase and amplitude channels) that enables imaging of human RBCs infected with malaria parasites (Plasmodium falciparum), which can be useful for detection and monitoring of malaria in developing countries, where the disease is still an endemic. Although pixel SR technique improves spatial resolution beyond what is permitted by the pixel size, signal-to-noise ratio (SNR) can still limit the achievable resolution and contrast. To further improve the quality of lensfree images, particularly SNR, a wetting film approach was developed.62,71 In this generic approach, an ultra-thin liquid layer forms a micro-lens on-top of each specimen, which boosts SNR by several times (e.g., >4–100X). By using this wetting film approach, micro-objects (with dimensions of <0.5 μm, such as E. coli) that are typically weak scatterers were successfully imaged using pixel SR based lensfree on-chip imaging.62
Figure 9.

A photograph (A) and a schematic diagram (B) of the portable multi-height microscope are shown. This microscope images dense samples by recording few intensity measurements with different sample to sensor distances. (C) Imaging results obtained from the microscope shown in (A–B). A full FOV (~30 mm2) hologram of a Pap smear sample is shown in the left panel. The right panel shows zoomed reconstructed amplitude and phase images of region one and two and a microscope comparison images (60 ×, 0.65 NA). Reprinted from reference 64 with permission from RSC publishing.
The aforementioned holographic microscopes have rather large FOVs (24–30 mm2),64 however these microscopes might also exhibit artifacts for dense and connected samples such as confluent cells or tissue slides. This limitation is not inherent to lensfree imaging, but rather a result of in-line imaging geometry, where the reference beam also interacts with the samples.53,72 To address this limitation, a multi-height phase recovery approach is employed in lensfree on-chip microscopy to reconstruct phase and amplitude images of dense and confluent samples.63–64,73 In this iterative reconstruction method, several lensfree holographic intensity measurements at different sample-to-detector distances (Z2) are acquired, which provide additional information regarding the optical fields, and enable iteratively reconstructing refined lensfree images for confluent and spatially dense samples.63,64
A field-portable implementation of this multi-height imaging based lensfree holographic microscope has been recently demonstrated (see Figure 9).64 This microscope consists of a super-resolution illumination tube (as previously described) and a simple cost-effective vertical stage to manually change the distance between the sample and sensor planes. Figure 9(C) shows a full FOV (i.e., ~30 mm2) reconstructed image of a dense Papanicolaou test sample (used for cervical cancer screening), together with amplitude and phase images for different regions-of-interest.
In addition to these techniques, lensfree optical tomographic microscopy for 3D imaging of biological specimen has also been demonstrated recently.65–67 Lensfree optical tomography (LOT), which is a computed tomographic74–85 imaging technique, is based on partially coherent lensfree on-chip holography. LOT uses multiple angles of illumination in a way analogous to X-Ray Computed Tomography (CT)74 and Optical Projection Tomography (OPT) 86–87. Using lensfree optical tomography65–67 (LOT), an axial resolution of ~2.5 μm has been demonstrated along with sub-micron lateral resolution, and the technique has been applied to 3D imaging of e.g., C. elegans. LOT offers a large field-of-view, along with an extended depth-of-field (DOF) owing to the holographic recording scheme that permits digitally zooming at a given depth layer and performing tomographic imaging around a selected depth-of-interest. While this increases the imaging throughput, it does not translate to the ability to perform sectional imaging of thick samples (e.g. > 100 μm). Thick samples strongly scatter the incident light, and the reconstructed projection images do not represent projections of a useful property (such as phase or absorption coefficient) of the object. As a result, LOT is currently more suitable for 3D imaging of micro-objects (such as cells and micro-organisms that have < 100 μm thickness) distributed in a large volume/chamber. Compared to conventional bright-field microscopy tools, holographic and tomographic lensfree microscopes with above-mentioned configurations offer various advantages for POC diagnostics, including portability, large FOV and depth-of-field as well as cost-effectiveness.
Lensfree on-chip holographic microscopes can image a wide range of samples with minimal modifications to standard preparation steps, thus allowing a smooth integration to the end-user needs. However, one limitation of this imaging platform is the image acquisition and processing/reconstruction time. Each improvement in imaging capabilities of the technology e.g., pixel-super-resolution and multi-height phase recovery, requires additional image acquisition and processing time. For instance, for pixel-super-resolution to perform on a portable device, ~10–20 images are taken sequentially, and for using multi-height based SR phase recovery ~40–80 images have to be acquired (at e.g., 4 heights), which might take 20–40 seconds at a modest frame rate of 2–3 fps. This additional image acquisition time might pose a limitation for real-time imaging applications, which might demand for faster illumination and frame capture rates. However, for POC imaging needs in general, the image acquisition time is mostly a matter of convenience and not a necessity, since most samples are fixed on microscope slides.
The processing time of the acquired data might pose another bottleneck for lensfree imaging especially for POC use. However, this issue can be addressed by utilizing off-the-shelf Graphics Processing Units (GPUs), which are already commonly installed on laptop computers and even cell-phones, reducing the processing (i.e., image reconstruction) times by two orders of magnitude to less than 1 second for imaging a FOV of e.g., 20–30 mm2.53
Lensfree Contact Imaging
Lensfree contact imaging is another microscopy approach that allows imaging of two-dimensional samples.91–93 In lensfree contact imaging, the sample is positioned in proximity to an image sensor, and is illuminated by an incoherent light source. Consequently, the shadow/diffraction pattern of the object is recorded and assumed to be an accurate representation of the sample. In this approach, the distance between the image sensor (or the sampling plane in general) and the object needs to be minimized (to e.g., < 1 μm, ideally) to reduce diffraction artifacts that compromise spatial resolution and image quality. Therefore, the microlens array and color filters installed on sensor-chips are removed,92,93 and the sample is seeded on top of the image sensor.
In lensfree contact imaging, similar to lensfree on-chip holographic microscopy, the finite pixel-size of the image sensor can result in under-sampling issues. One elegant solution to mitigate the under-sampling effect in lensfree contact imaging was demonstrated in an optofluidic microscope (OFM) by Yang group.92 The OFM mobilizes the specimen (by flow or gravity) along a microfluidic channel that is positioned directly over the image sensor (see Figure 10). To increase the resolution of OFM, a ‘tilted’ array of metallic apertures (sub-pixel in size) is patterned directly over the image sensor. Each aperture is carefully positioned at the centre of a pixel so that shadows of the specimens can be sampled by these sub-micron apertures as they flow across the pinhole array. By using OFM, on-chip imaging of Caenorhabditis elegans mutant strains has been demonstrated. In addition to unavoidable diffraction related artifacts due to finite distance between the specimen and the sampling planes, the objects can also rotate and shift while in motion through the optofluidic channel, which might lead to inaccurate scanning of their shadows, thus resulting in smearing artifacts. To reduce such motion artifacts, holographic implementation of OFM has also been demonstrated by Ozcan group, which was also translated to tomographic optofluidic microscopy in their later work.66,68
Figure 10.

(A) A schematic diagram of OFM. The apertures (white circles) are fabricated directly on top of the optoelectronic sensor and incorporated in an optofluidic channel (blue lines). (B) A photograph of the OFM. (C) A schematic diagram that shows that by tilting the microscope, gravity can provide the flow of the sample. (D) Block diagram of OFM computational principles. Reprinted from reference 92 with permission from National Academy of Sciences, USA.
To mitigate under-sampling related issues in on-chip imaging, introduction of the use of pixel SR techniques in lensfree imaging has opened up new avenues.60,61,66,67 Following the same line of utilizing pixel-super-resolution, Yang group introduced the ePetri platform that is also based on contact imaging.93 In this imaging approach, the sample is positioned in proximity to the image sensor, and the source shifting approach60,61,67 is used for implementing pixel super-resolution. With this technique, Yang group demonstrated imaging of dense and confluent 2D samples (i.e., cell cultures) over a large field-of-view.
Contact imaging using source-shifting based pixel super-resolution, which is the basis for the ePetri platform, shows rather promising results in general. However, the etching of the microlens array of an imager chip is in general a time consuming and expensive process, which can also be invasive to the optimal design of the sensor chip. Moreover, in shadow imaging techniques, partial coherence of illumination has to be carefully taken into account. For instance, in Ref. 93 the light impinging on the detector-array is actually partially coherent (both spatially and temporally) which means the shadows of two closely spaced micro-objects (e.g., ≤1–2 μm apart) would interfere with each other and with the background-light, creating ‘holographic’ shadows at the detector-plane. These in-line holographic shadows make the interpretation of the observed micro-features in a shadow image (after e.g., pixel-super-resolution) rather difficult since these could be artifacts due to interference of objects’ shadows with each other and with the un-scattered background-light. Therefore, under partially coherent illumination, a shadow-imaging platform as in Ref. 93 is already holographic, and pixel-super-resolved shadows of the objects, without proper holographic reconstruction, would deviate from the original object features especially at the sub-micron scale.
Although change of illumination angle through source-shifting60,61,67 provides valuable opportunities to effectively reduce the pixel-size in shadow imaging using pixel-super-resolution techniques, this illumination angle diversity can also bring some limitations and artifacts. For instance any realistic three-dimensional object would have different cross-sections (and shadows) at different illumination angles. Furthermore, the shadows of micron-scale objects will also be physically stretched (i.e., asymmetrically widened) at the detector-plane with increasing angles. Therefore, under large illumination angles (e.g., up to ±60°) the recorded micro-shadows will ‘not’ be shifted versions of the ‘same’ object-function, which could introduce major artifacts in pixel-super-resolution. Different than contact imaging, the earlier reports60,61 used significantly smaller illumination angles such that the aforementioned artifacts due to object cross-section changes and asymmetric shadow-stretching at the detector-array can be ignored. In fact, if these different cross-sections are preserved under wide-angle illumination, and if appropriate processing is used to account for micro-shadow stretching at the detector-array, lensless tomographic microscopy can be demonstrated.67
It should be noted that pixel-super-resolution does not correct for the artifacts due to diffraction between the objects and the active-region of the detector. This gap is not only physically unavoidable as it is required for passivation and insulation, but it is also necessary to achieve source-shifting based pixel super-resolution. This inevitably limits the achievable resolution due to diffraction and holographic interference, as a result of which, lensfree contact imaging has not been able to provide high-resolution imaging of a volume of three-dimensional objects.
Lensfree Imaging Techniques for Biosensing
Microfluidics based immunoassays have been extensively studied for POC diagnostics due to their small sample consumption, fast response time, high sensitivity and portability.2–5 To translate these micro-fluidics systems for practical POC applications, it is essential to integrate them with cost-effective, robust and compact detectors. Toward this end, several recent studies have demonstrated the integration of lensfree imaging modalities with e.g., immunoassay or a cell-based biosensor for the quantification of biomolecules, the study of cell function or for testing the cardio-toxicity of drugs.96–102 To this end, Ozcan and Revzin groups demonstrated the use of antibody microarrays and lensfree holographic imaging for high-throughput analysis of leukocytes from human blood.96 This platform achieved accurate enumeration of CD4 and CD8 T-cells specifically captured on these antibody spots to determine the CD4/CD8 ratio in blood samples of healthy volunteers and HIV infected patients. This technique also enabled quantification of three different cytokines (IFN-γ, TNF-R, and IL-2) that were secreted by captured T-cells using horseradish peroxidase (HRP)-labeled anticytokine Abs and a visible color reagent. These results are quite promising for multi-parametric blood analysis at the POC.
Rasooly group also developed a lensfree CCD-based fluorometer97 using a micro-machined stacked Poly(methyl methacrylate) (PMMA) pinhole array, functioning as an optical Soller collimator, to deliver the fluorescent emission from the assay onto a small area of a CCD sensor (see Figure 11). This configuration, where the sample does not need to be placed in proximity to the CCD sensor, enables conveniently interchanging the microfluidic chips while still maintaining a compact architecture. Using this platform, a limit of detection (LOD) of 1.25 nM was demonstrated, which is comparable to the LOD of a modern enzyme-linked immunosorbant assay (ELISA) plate reader. This compact lensfree fluorometer could be useful for a wide range of medical diagnostic immunoassays integrated with lab-on-a-chip platforms,99 particularly in low-resource settings.
Figure 11.

The basic configuration of the lensfree detector based on Soller collimator configuration.97 (A–B) A photograph and schematic configuration of the basic elements of the lensfree detector (the size of the bars are 1 cm), (B) a schematic configuration of the detector. 1. Multi-wavelength LED, 2. Narrow band blue emission filter, 3. Assay microfluidics, 4 and 6. Light collimator, 5. Emission filter, and 7. CCD. (C) a photograph of the assembled lensfree detector. Reprinted from reference 97 with permission from RSC publishing.
More recently, Khademhosseini group also demonstrated the application of lensfree on-chip imaging to cell-based bio-sensing. In their work, a portable real-time biosensor was developed to detect cardio-toxicity (see Figure 12).101 This on-chip sensor employs a simple LED-based illumination module together with a low-cost CMOS sensor for detection. This platform was successfully used to study the effects of two different drugs, isoprenaline and doxorubicin, on the beating rate and beat-to-beat variations of cardiomyocytes in real-time.
Figure 12.
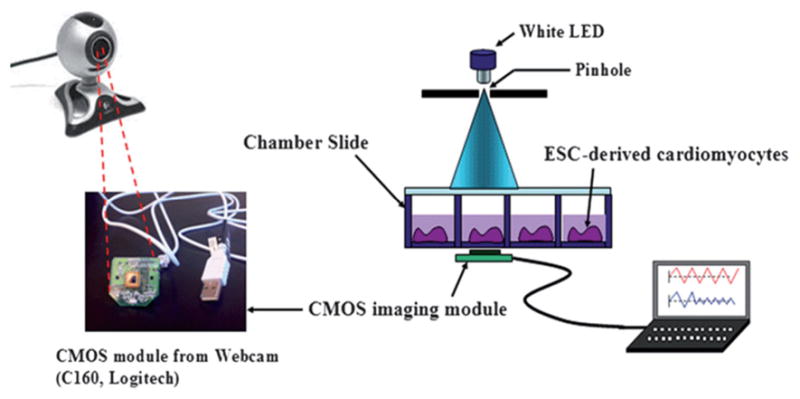
Schematic illustration of the cell-based biosensor platform for the detection of cardiotoxicity using webcam based lensfree imaging technique. The white LED illuminates the chamber slide, which containes the ESC-derived carrdiomyocytes. The real-time beating rates of the cardiomyocytes are recorded by the CMOS imaging module taken from a webcam, and analyzed by imaging processing program. Reprinted from reference 101 with permission from RSC publishing
3. In vivo Optical Imaging Techniques for POC Diagnostics
In vitro microscopic examination of biological samples (e.g., tissue or blood) remains as one of the main tools for diagnosis of disease. However, it typically requires invasive sample collection (e.g., biopsy) steps as well as time consuming sample preparation protocols (e.g., fixation and staining).103,104 On the other hand, in vivo optical imaging techniques enable real-time visualization and might provide accurate information for diagnostics, making them highly desirable for the POC diagnostics both at advanced settings as well as resource-limited regions. In this section, we will review two in-vivo optical imaging techniques, i.e., confocal microscopy/microendoscopy and optical coherence tomography (OCT) that hold significant promise for use in POC applications.
3.1 Confocal Microscopy and Microendoscopy
Conventional confocal microscopy, pioneered by Marvin Minsky,105 operates based on point source illumination that is sequentially focused across the specimen. The objects are illuminated through a pinhole, and the light scattered off the specimen is collected through a second pinhole located in front of the detector plane, which is used to partially reject the scattered out-of-focus light. This confocal operation principle does not only provide high resolution imaging capability but also allows three-dimensional (3D) imaging of the specimen, incorporating a series of optical sections acquired by scanning along the vertical axis. Although the main components (e.g., conjugated pinhole couple and point-by-point scanning) have not significantly changed on modern confocal imagers, recent efforts have focused on the development of rapid and portable designs to operate in a minimally invasive manner. In specific, integration of optical fibers into confocal microscopy has enabled significant miniaturization to perform in vivo imaging within a compact design. A fiber optic bundle that comprises thousands of closely-spaced optical fibers eliminates the need for scanning. Packaged together with an objective lens, this coherent fiber bundle has been utilized in both reflectance106–111 as well as fluorescence confocal imagers112–118 that exhibit significant promise towards in vivo and in situ microscopic applications such as epithelial precancer screening.
In addition to the integration of optical fibers to confocal imagers, development of microelectromechanical systems (MEMS) and micro-optical components have further complemented the efforts to miniaturize confocal microscopy tools that can enable volumetric in vivo imaging. Towards this goal, Solgaard, Contag and Kino et al. widely investigated the use of MEMS mirrors and scanners in portable confocal microscopes to significantly improve the precision of scanning and light rejection/collection efficiency.119–122 They demonstrated a dual-axis confocal (DAC) microscope that utilizes a 2-D MEMS mirror for raster scanning in lateral plane and a MEMS scanner with a piezoelectric stage actuator for depth-sectioning. Providing a transverse resolution of 2.5 μm and an axial resolution of 5.8 μm, this portable DAC microscope was used to image transgenic mice both ex vivo and in vivo121 as well as mouse skins to screen spatio-temporal in vivo gene expression patterns122, exhibiting a highly promising toolset that could also be translated to field use.
Zhang group also demonstrated a handheld single fiber confocal microscope that integrates comb-drive silicon microscanners, achieving 0.80 μm and 9.55 μm lateral and axial resolution, respectively, over an imaging field-of-view of 200 μm × 110 μm at 3.5–5.0 frames per second.123 This reflectance confocal imager utilizes a flexible probe that integrates a custom-developed two-axis vertical comb-drive scanning micromirror with a miniature objective lens, overcoming the drawbacks caused by the distal-end scanning such as flexibility and restricted access to the biological site (e.g., oral cavity). It was used to image epithelial precancers in vivo, porcine oral tissue in vitro, and human fingernail in vivo, providing a promising endoscopic imaging platform especially for early evaluation of oral and cervical pre-cancerous lesions.
On the other hand, the recent advancements in consumer-grade digital camera market also offer several opportunities, providing cost-effective and high-resolution imagers that can be utilized for field-portable endoscopic imaging. As a complementary effort toward this end, Richard-Kortum group introduced a portable fiber-optic fluorescence imaging platform that uses a digital single-lens reflex (DSLR) camera to visualize subcellular features in oral cancer cell lines and human tissue specimen, targeting POC detection of cancer in remote locations124 (see Figure 13). This portable microendoscopy system utilizes a simple LED source that is coupled to a bandpass filter and a dichroic mirror, illuminating the proximal end of a coherent fiber optic bundle. In contact with the specimen, distal end of the same fiber bundle collects fluorescent emission, which is recorded by an opto-electronic sensor already embedded on the consumer-grade digital camera. On the proximal end of the fiber bundle, an infinity-corrected (0.4 NA) and tube lens as well as a long-pass filter form the magnified image of the bundle, visualized in real-time on the LCD display of the DSLR camera. This DSLR camera based micro-endoscope was used to image oral cancer cell lines, a surgically resected oral tissue with an oral squamous carcinoma in ex vivo and oral mucosa in vivo on human volunteers (see Figure 13(C–D)). Effective spatial resolution of this platform is currently limited by under-sampling due to the core-to-core spacing (i.e., 4 μm) between individual fibers in the coherent bundle. Its performance has been characterized by imaging a USAF test target, resolving grating with a line width of 4.4 μm. Although the width of the fiber bundle utilized in this system is 800 μm, it overfills the DSLR camera sensor, providing an effective field-of-view of 660 μm in width.
Figure 13.
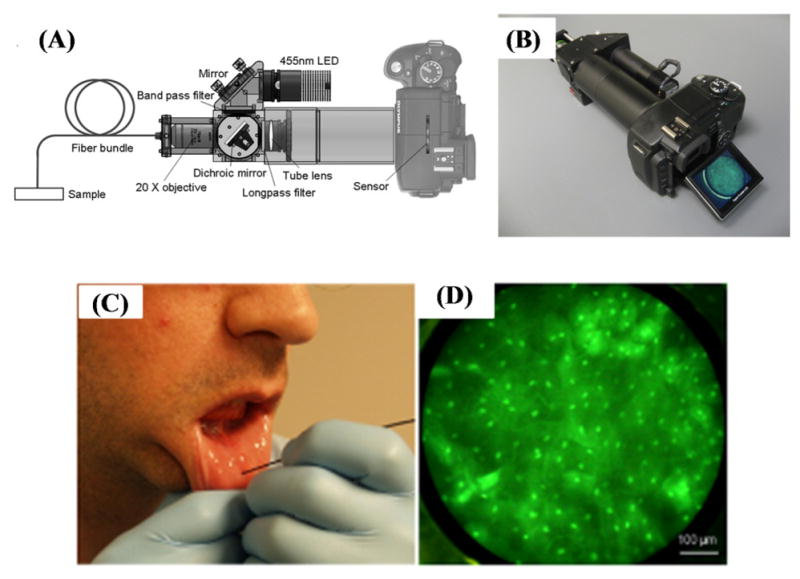
Schematic diagram (A) and picture (B) of the portable fiber-optic fluorescence imaging platform that uses a digital single-lens reflex (DSLR) camera introduced by Shin et. al.124 (C) In vivo imaging of healthy human oral mucosa. (D) An image of human mucosa that is labeled by proflavine were acquired by the DSLR based micro-endoscope shown in (A) and (B). Reprinted from Ref. 124 with permission from PLoS One.
The integration of fiber optics and consumer-grade electronics into the endoscopic imaging and confocal microscopy, as summarized above, opens up new opportunities toward cost-effective and miniaturized imaging platforms, enabling real-time and minimally invasive POC screening even in low-resource locations, where advanced laboratory facilities are not available or difficult to access.
3.2 Optical Coherence Tomography
Optical coherence tomography (OCT) is a three-dimensional microscopic imaging technique that is especially suitable for in vivo imaging applications. Since its earlier demonstrations,125–132 OCT has advanced to a level where it finds routine clinical use for imaging ~1–3 mm deep into tissue at an axial resolution of e.g., ~1–20 μm, which can be especially useful in ophthalmology, cardiology, gastroenterology and oncology applications, among others.133–142 OCT is an interferometric imaging technique that employs light sources (typically in the near-infrared) with relatively large spectral bandwidths (e.g. ~ 10–300 nm), to achieve cross-sectional biomedical imaging. OCT systems in general employ a fiber-based Michelson interferometer to measure the backscattered light from an object. This backscattered light is used to calculate the reflectivity or scattering potential profile of the object, e.g., tissue, along the probe beam direction. By scanning the probe beam in the transverse direction, 3D images of the object can be reconstructed. In order to measure the depth profile using the backscattered light, different methods have been demonstrated. Among these, time-domain OCT (TD-OCT) exploits the fact that the reference beam can interfere with the backscattered light only if their path length difference is within the coherence length of the source, forming a coherence gate. Therefore, by changing the length of the reference arm, this coherence gate can be moved through the depth of the sample. Then, the amplitude of the measured 1-D interference signal as a function of the reference arm length (i.e. coherence gate position) indicates the reflectivity of the corresponding point of the object.125 Instead of varying the length of the reference arm, the scanning can alternatively be performed in the wavelength domain.133 In source-swept OCT (SS-OCT), a tunable laser is used to record a spectral interference signal as the wavelength is swept in time. This interferogram is first uniformly re-sampled as a function of wave-number, and then Fourier transformed, to obtain the axial profile along the illumination beam.133 In SS-OCT the light source is instantaneously quasi-monochromatic (e.g. <0.5 nm), and the wavelength is tuned within the full spectral range of the source to synthesize the spectral interference point-by-point. Doing this, SS-OCT relies on the Fourier diffraction theorem, that is, the complex amplitude of the back-scattered light can be mapped to the Fourier space of the scattering potential of the object.143 Tuning the illumination wavelength then permits mapping different axial spatial frequency components.133
In both TD-OCT and SS-OCT, some form of time-sequential scanning is required to obtain a depth-profile, in addition to raster scanning of the illuminating spot to achieve 3D imaging. The need for scanning to perform depth sectioning can be eliminated as achieved by spectral-domain OCT (SD-OCT). In SD-OCT, the interference at the output of a Michelson interferometer is coupled to an optical spectrometer to obtain the spectral interference in a single shot. This approach increases the imaging speed, which can be particularly desired for in-vivo imaging applications, although image quality may be compromised to some extent for imaging thick and strongly scattering samples.144
The relative simplicity of the optics employed, together with the increasing availability of compact solid-state light sources, renders the miniaturization of OCT systems feasible. As a result, OCT appears to be a promising non-invasive imaging technique that lends itself to a compact, relatively cost-effective and portable architecture for diagnostic imaging applications at the POC. To this end, several OCT systems have been proposed. For example, Iftimia et al. have demonstrated a portable low-coherence interferometry (LCI) system for guiding fine needle aspiration biopsy (FNAB).145 LCI is essentially the building block of TD-OCT, where the depth-profile is obtained only along a single line instead of reconstructing a 3D image by raster scanning the illumination spot. In this instrument, a fiber-optic based Michelson interferometer employing a broadband light source is assembled as a portable system, roughly the size of a laptop computer, to achieve depth sectioning at ~11 μm axial resolution over a tissue depth of ~1.4 mm. The optical fiber that is used both for illumination and detection at the sample arm is integrated with the fine needle. Proof-of-concept of breast tissue characterization using the LCI instrument has been demonstrated, suggesting that this system can enhance the diagnostic outcome of FNAB, as well as speeding up the process by eliminating the need for manual palpation to determine the location of the needle.
Tearney and Bouma groups demonstrated a miniaturized SS-OCT system, which can fit a volume of several decks of cards, to achieve 10 μm axial resolution over ~1.75 mm thick tissue.146 In this work, one of the goals was the development of a compact tunable laser, as most SS-OCT systems employ tunable lasers with large form factors less suitable for use at the POC (see Figure 14). Accordingly, a miniaturized linear-cavity was designed that employs a semiconductor gain medium and a compact galvanometric scanner to slightly deflect the laser beam in the cavity that in turn tunes the output wavelength over a spectral bandwidth of ~75 nm. The entire light source assembly, which fits in a volume of 3 in. × 2.5 in. × 3 in., can be continuously operated for more than one hour on a single charge of battery. The system has been tested for imaging of ventral surface of a human forefinger.
Figure 14.

(Top panel) Shows a cartoon drawing and a photograph of the tunable laser source developed for use in point-of-care SS-OCT systems. (Bottom panel) Shows cross sectional images of the ventral surface of a human forefinger obtained during the forward scan (left) and the backward scan (middle) of the resonant mirror inside the linear cavity, together with a combined image (right). Reprinted from Ref. 146 with permission from Optical Society of America.
More recently, an SD-OCT system for POC diagnostics has also been developed (see Figure 15).147 In their work, Jung et al. developed a handheld OCT scanner that achieves ~4 μm axial resolution, along with ~ 15 μm lateral resolution using a handheld unit with dimensions of 11.5 cm × 11.5 cm × 6.3 cm, providing cross-sectional images (i.e., B-scans) at 70 frames/s owing to the high-speed nature of SD-OCT systems. Tomographic imaging of a rat eye and normal human tissue has been demonstrated using this instrument.
Figure 15.

(Top panel) Shows a photograph of the handheld SD-OCT scanner unit (left) together with a schematic illustration of the entire OCT system (right). (Bottom panel) Shows in vivo cross-sectional images of normal human tissue obtained by using this OCT system147 Reprinted from Ref. 147 with permission from IEEE Engineering in Medicine and Biology Society.
These OCT systems designed particularly for POC applications are rather exciting and can have significant impact for improving global health. Including the additional peripheral devices such as the power supplies and drive electronics, these platforms are either implemented on optical tables146 or on portable carts.147 Further reduction of the form factor and the overall costs, together with more ergonomic designs, would help these OCT systems find massive clinical use at the POC, especially in low-resource settings.
4. Other Optical Imaging Techniques for POC Diagnostics
As emphasized earlier, with more than 5 billion mobile phone subscribers worldwide, cell-phones have massively penetrated into the most remote locations of the world, making them a rather suitable platform to be utilized for medical diagnostics and biomedical research as imaging and sensing tools. In parallel to the cell-phone based microscopy and cytometry platforms discussed earlier,42–45 there have been other efforts to develop cell-phone based optical imaging devices for POC diagnostics. 148–151 For example, CATRA (Cataract Maps with Snap-on Eyepiece for Mobile Phones) has been introduced by Raskar group, providing a field-portable and cost-effective platform to detect and quantify cataracts using a compact eyepiece attached to a cell phone150 (see Figure 16) Cataracts, the leading cause of blindness, are typically diagnosed by examining back-scattering from the eye using bulky and costly equipment (e.g., slit-lamp) operated by a highly-trained medical examiner. However, backscattering examination cannot address early stages of cataracts and can present a subjective and simple grade of severity. To address this limitation, CATRA operates based on forward-scattering by offering an interactive experience to the users. Using a snap-on eyepiece attachment installed on a cell phone display, users respond to the projected patterns and give real-time feedback regarding to the light-attenuation in each section of the eye using the buttons on the cell-phone application. Collected user feedback is then processed to generate a quantified map of opacity, attenuation, contrast and point-spread functions of the eye, enabling the analysis of the severity of cataracts. Therefore, this portable cell-phone based cataract analyzer can be quite useful for quantified evaluation of cataract onset and can be operated by minimally trained individuals for self-screening.
Figure 16.
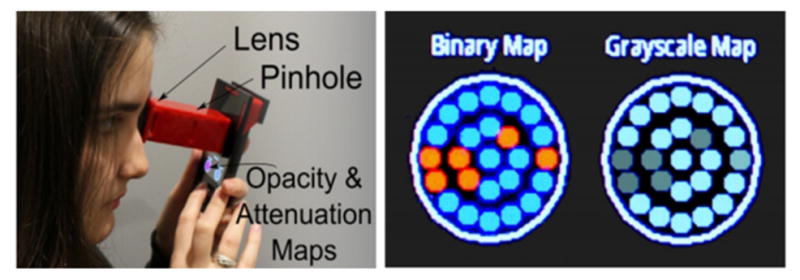
CATRA provides an interactive experience to the user to self-evaluate the severity of her/his cataract using a snap-on cell-phone attachment (left).150 Based on real-time user feedback in response to the digitally projected patterns, opacity and attenuation maps can be generated to quantify the stage of cataracts (right). Refer to Ref. 150 for further details.
Another recent telemedicine platform that leverages wireless communication devices and networks is integrated rapid-diagnostic-test (RDT) reader platform for digital reading and evaluation of different types of RDTs (see Figure 17).151 Using a cost effective and light-weight (~60 grams) snap-on attachment, this cell-phone based RDT reader enables quantitative analysis of chromatographic tests and generates a detailed test report which is then automatically uploaded to a secure central server for real-time spatio-temporal mapping of infectious diseases. Powered by the cell-phone battery or AAA batteries, this RDT reader attachment is composed of simple off-the-shelf components such as diffused light-emitting-diode (LED) arrays and an inexpensive plano-convex lens to digitally acquire transmission or reflection images of different RDTs (see Figure 17). This universal RDT reader platform is designed to fit on different cell-phone devices (e.g., iPhone and Android based cell-phones) to create a global network of digital RDT readers.
Figure 17.

(A–B) An RDT reader prototype powered by the cell-phone battery.151 A cost-effective snap-on attachment (b) is required to convert a cell phone to a smart digital RDT reader (b), which automatically evaluates various RDTs and generates a detailed RDT report.
In this design (Figure 17), to be compatible with different formats of RDTs with varying dimensions (e.g., dipstick, cassettes, etc.), two diffused LED arrays are located underneath the RDT plane to acquire reflection images and another diffused LED is positioned on the top for the acquisition of transmission images of RDTs. Using a simple micro-controller, the reader identifies if the RDT is properly inserted to the attachment and accordingly powers the desired LED array (transmission or reflection) to illuminate the RDT of interest. A custom-developed cell-phone application records and automatically processes raw RDT images and generates detailed RDT evaluation reports that include the validation and quantitative digital analysis of the RDT. Together with other related information (e.g., raw RDT images, patient data, etc.), these test evaluation reports are transferred to a secure server/database or stored in the internal memory to be transmitted once wireless communication becomes available. This secure central server presents its database on an online map through geo-tagging and can be accessed via the cell-phone application or internet browsers using remote personal computers.
In order to test the performance of this RDT reader platform, several immunochromatographic RDTs (e.g., P. falciparum-specific and Pan-specific Malaria, HIV and TB IgG/IgM Combo cassette tests) activated using healthy human blood as well as positive control wells (containing recombinant antigens) have been extensively evaluated.151 This RDT reader design correctly analyzed all negative and positive RDTs that were activated using even low concentrations of positive control antigens. Differentiating even minor color intensity changes in response to varying densities of disease antigens, this platform exhibits a significant advantage over visual examination of RDTs through human eye that is rather subjective and sensitive to external illumination/lighting conditions. Moreover, this cell-phone based telemedicine platform can assist healthcare professionals to remotely track the burden of infectious diseases and rapidly evaluate statistical risk factors to prevent local and global outbreaks through spatio-temporal mapping of epidemics.
5. Summary
Aiming to bring effective medical testing to patients, or to sites near patients, POC diagnostics increases the affordability and efficiency of healthcare in both the developed and developing countries. The success of POC diagnostics heavily depends on the continued development of alternative medical technologies that are cost-effective, yet sensitive and sufficiently accurate. In this quest, optical technologies play an increasingly important role, as the advances in opto-electronics, fiber optics, optical microsystems and microfluidics are rapidly transforming the field of biomedical optics. As part of this transformation, various optical imaging technologies, such as conventional light microscopes, confocal scanning optical microscopes and OCT systems are being re-designed to provide highly integrated and miniaturized imaging tools for use at the POC, as exemplified by the portable light microscopes, micro-endoscopes and OCT systems summarized in this Review.
In addition to miniaturization and integration of relatively more established optical imaging platforms, an alternative approach is to develop new imaging techniques, generally assisted by computation (a ubiquitous resource), either to significantly simplify the optical hardware used, or to convert existing mobile devices into biomedical imaging and sensing platforms. Among the emerging examples to this latter approach, one can include lensfree on-chip microscopy modalities and the wide range of recently introduced cell-phone based diagnostic imagers, cytometers and sensors. By enabling high-throughput imaging and detection within compact and cost-effective architectures, these platforms can also help realize the translation of microfluidic and lab-on-a-chip systems into various clinical applications.
In general, these compact, cost-effective and portable optical imaging and sensing devices can provide direct in vivo and in vitro visualization to obtain rapid diagnostic information at the POC. Often times, however, reduction in size and cost comes at a price of compromised imaging performance, such as lower spatial and temporal resolution. Therefore, more research and development have to be performed so as to improve the performance of these tools to, or even beyond, the level of their respective gold standards. This is critical to expedite the adoption of these POC diagnostics platforms for clinical use, in both advanced and low-resource settings.
Acknowledgments
A. Ozcan gratefully acknowledges the support of the Presidential Early Career Award for Scientists and Engineers, Army Research Office Young Investigator Award, National Science Foundation CAREER Award, Office of Naval Research Young Investigator Award and National Institutes of Health Director’s New Innovator Award DP2OD006427 from the Office of the Director, National Institutes of Health.
References
- 1.Wang J. Biosens Bioelectron. 2006;21:1887–1892. doi: 10.1016/j.bios.2005.10.027. [DOI] [PubMed] [Google Scholar]
- 2.Myers FB, Lee LP. Lab Chip. 2008;8:2015–2031. doi: 10.1039/b812343h. [DOI] [PubMed] [Google Scholar]
- 3.Boyle DS, Hawkins KR, Steele MS, Singhal M, Cheng X. Trends in Biotechnology. 2012;30:45–54. doi: 10.1016/j.tibtech.2011.06.015. [DOI] [PMC free article] [PubMed] [Google Scholar]
- 4.Weigl B, Domingo G, LaBarre P, Gerlach J. Lab Chip. 2008;8:1999–2014. doi: 10.1039/b811314a. [DOI] [PMC free article] [PubMed] [Google Scholar]
- 5.Chin CD, Linder V, Sia SK. Lab Chip. 2007;7:41–57. doi: 10.1039/b611455e. [DOI] [PubMed] [Google Scholar]
- 6.Linder V. Analyst. 2007;132:1186–1192. doi: 10.1039/b706347d. [DOI] [PubMed] [Google Scholar]
- 7.Warsinke A. Anal Bioanal Chem. 2009;393:1393–1405. doi: 10.1007/s00216-008-2572-0. [DOI] [PubMed] [Google Scholar]
- 8.Soper S, Brown K, Ellington A, Frazier B, Garcia-Manero G, Gau V, Gutman S, Hayes DF, Korte B, Landers JL, Larson D, Ligler F, Majumdar A, Mascini M, Nolte D, Rosenzweig A, Wang J, Wilson D. Biosens Bioelectron. 2006;21:1932–1942. doi: 10.1016/j.bios.2006.01.006. [DOI] [PubMed] [Google Scholar]
- 9.Gervais L, Delamarche E. Lab Chip. 2009;9:3330–3337. doi: 10.1039/b906523g. [DOI] [PubMed] [Google Scholar]
- 10.Dungchai W, Chailapakul O, Henry CS. Anal Chem. 2009;81:5821–5826. doi: 10.1021/ac9007573. [DOI] [PubMed] [Google Scholar]
- 11.Ellerbee A, Philips S, Siegel AC, Mirica KA, Martinez AW, Striehl P, Jain N, Prentiss M, Whitesides GM. Anal Chem. 2009;81:8447–8452. doi: 10.1021/ac901307q. [DOI] [PubMed] [Google Scholar]
- 12.Ligler FS. Anal Chem. 2009;81:519–526. doi: 10.1021/ac8016289. [DOI] [PMC free article] [PubMed] [Google Scholar]
- 13.Jokerst JV, McDevitt JT. Nanomedicine. 2010;5:143–155. doi: 10.2217/nnm.09.94. [DOI] [PMC free article] [PubMed] [Google Scholar]
- 14.Sun S, Yang M, Kostov Y, Rasooly A. Lab Chip. 2010;10:2093–2100. doi: 10.1039/c003994b. [DOI] [PubMed] [Google Scholar]
- 15.Chin CD, Laksanasopin T, Cheung YK, Steinmiller D, Linder V, Parsa H, Wang J, Moore H, Rouse R, Umviligihozo G, Karita E, Mwambarangwe L, Braunstein SL, van de Wijgert J, Sahabo R, Justman J, El-Sadr W, Sia SK. Nat Medicine. 2011;17:1015–1019. doi: 10.1038/nm.2408. [DOI] [PubMed] [Google Scholar]
- 16.Tudos AJ, Besselink GAJ, Schasfoort RBM. Lab Chip. 2001;1:83–95. doi: 10.1039/b106958f. [DOI] [PubMed] [Google Scholar]
- 17.Luppa PB, Muller C, Schlichtiger A, Schlebusch H. Trends in Analytical Chemistry. 2011;30:887–898. doi: 10.1016/j.trac.2011.01.019. [DOI] [PMC free article] [PubMed] [Google Scholar]
- 18.Nichols JM. Accred Qual Assur. 2006;11:273–277. [Google Scholar]
- 19.Yager P, Domingo GJ, Gerdes J. Annu Rev Biomed Eng. 2008;10:107–44. doi: 10.1146/annurev.bioeng.10.061807.160524. [DOI] [PubMed] [Google Scholar]
- 20.Akmorton, Tran HM, Brenman JS, Giannobile WV, Singh AK. Proc Natl Acad Sci USA. 2007;104:5268–5273. doi: 10.1073/pnas.0607254104. [DOI] [PMC free article] [PubMed] [Google Scholar]
- 21.Sia SK, Whitesides GM. Electrophoresis. 2003;24:3563–3576. doi: 10.1002/elps.200305584. [DOI] [PubMed] [Google Scholar]
- 22.Sia SK, Kricka LJ. Lab Chip. 2008;8:1982–1983. doi: 10.1039/b817915h. [DOI] [PubMed] [Google Scholar]
- 23.Dimov IK, Kijanka G, Park Y, Ducree J, Kang T, Lee LP. Lab Chip. 2011;11:2701–2710. doi: 10.1039/c1lc20105k. [DOI] [PMC free article] [PubMed] [Google Scholar]
- 24.Dimov IK, Basabe-Desmonts L, Garcia-Cordero JL, Ross BM, Riccoa AJ, Lee LP. Lab Chip. 2011;11:845–850. doi: 10.1039/c0lc00403k. [DOI] [PubMed] [Google Scholar]
- 25.Martinez WW, Phillips ST, Whitesides GM. Proc Natl Acad Sci USA. 2008;19:606–611. [Google Scholar]
- 26.Nagrath S, Sequist LV, Maheswaran S, Bell DW, Irimia D, Ulkus L, Smith MR, Kwak EL, Digumarthy S, Muzikansky A, Ryan P, Balis UJ, Tompkins RG, Haber DA, Toner M. Nature. 2007;450:1235–1239. doi: 10.1038/nature06385. [DOI] [PMC free article] [PubMed] [Google Scholar]
- 27.Cheng X, Irimia D, Dixon M, Sekine K, Demirci U, Zamir L, Tompkins RG, Rodriguez W, Toner M. Lab Chip. 2007;7:170–178. doi: 10.1039/b612966h. [DOI] [PMC free article] [PubMed] [Google Scholar]
- 28.Stott SL, Hsu CH, Tsukrov DI, Yu M, Miyamoto DT, Waltman BA, Rothenberg SM, Shah AM, Smas ME, Korir GK, Floyd FP, Gilman AJ, Lord JB, Winokur D, Springer S, Irimia D, Nagrath S, Sequist LV, Lee RJ, Isselbacher KJ, Maheswaran S, Haber DA, Toner M. Proc Nat Acad Sci. 2010;107:18392–18397. doi: 10.1073/pnas.1012539107. [DOI] [PMC free article] [PubMed] [Google Scholar]
- 29.Mao X, Huang T. Lab Chip. 2012;12:1412–1416. doi: 10.1039/c2lc90022j. [DOI] [PMC free article] [PubMed] [Google Scholar]
- 30.Yager P, Edwards T, Fu E, Helton K, Nelson K, Tam MR, Weigl BH. Nature. 2006;442:412–418. doi: 10.1038/nature05064. [DOI] [PubMed] [Google Scholar]
- 31.Rohrman BA, Richards-Kortum RR. Lab Chip. 2012;12:3082–3088. doi: 10.1039/c2lc40423k. [DOI] [PMC free article] [PubMed] [Google Scholar]
- 32.Sun S, Ossandon M, Kostov Y, Rasooly A. Lab Chip. 2009;9:3275–3281. doi: 10.1039/b912097a. [DOI] [PMC free article] [PubMed] [Google Scholar]
- 33.Yang M, Sun S, Kostov Y, Rasooly A. Anal Biochem. 2011;416:74–81. doi: 10.1016/j.ab.2011.05.014. [DOI] [PMC free article] [PubMed] [Google Scholar]
- 34.Yang M, Sun S, Kostov Y, Rasooly A. Sens Actuators B Chem. 2011;153:176–181. doi: 10.1016/j.snb.2010.10.027. [DOI] [PMC free article] [PubMed] [Google Scholar]
- 35.Makler MT, Palmer CJ, Ager AL. Ann Trop Med Parasitol. 1998;92:419–433. doi: 10.1080/00034989859401. [DOI] [PubMed] [Google Scholar]
- 36.Steingart KR, Henry M, Ng V, Hopewell PC, Ramsay A, Cunningham J, Urbanczik R, Perkins MD, Aziz MA, Pai M. Lancet Infect Dis. 2006;6:570–581. doi: 10.1016/S1473-3099(06)70578-3. [DOI] [PubMed] [Google Scholar]
- 37.Lichtman JW, Conchello J. Nat Methods. 2005;2:910–919. doi: 10.1038/nmeth817. [DOI] [PubMed] [Google Scholar]
- 38.Miller AR, Davis GL, Oden ZM, Razavi MR, Fateh A, Ghazanfari M, Abdolrahimi F, Poorazar S, Sakhaie F, Olsen RJ, Bahrmand AR, Pierce MC, Graviss EA, Richards-Kortum R. PlosOne. 2010;5:e11890. doi: 10.1371/journal.pone.0011890. [DOI] [PMC free article] [PubMed] [Google Scholar]
- 39.Flusberg BA, Nimmerjahn A, Cocker ED, Mukamel EA, Barretto RPJ, Ko TH, Burns LD, Jung JC, Schnitzer MJ. Nat Methods. 2008;5:935– 938. doi: 10.1038/nmeth.1256. [DOI] [PMC free article] [PubMed] [Google Scholar]
- 40.Ghosh KK, Burns LD, Cocker ED, Nimmerjahn A, Ziv Y, Gamal AE, Schnitzer MJ. Nat Methods. 2011;8:871–878. doi: 10.1038/nmeth.1694. [DOI] [PMC free article] [PubMed] [Google Scholar]
- 41.McCall B, Pierce M, Graviss EA, Richards-Kortum R, Tkaczyk T. Tuberculosis. 2011;91:S54–S60. doi: 10.1016/j.tube.2011.10.011. [DOI] [PubMed] [Google Scholar]
- 42.Breslauer DN, Maamari RN, Switz NA, Lam WA, Fletcher DA. PlosOne. 2009;4:e6320. doi: 10.1371/journal.pone.0006320. [DOI] [PMC free article] [PubMed] [Google Scholar]
- 43.Tseng D, Mudanyali O, Oztoprak C, Isikman SO, Sencan I, Yaglidere O, Ozcan A. Lab Chip. 2010;10:1787. doi: 10.1039/c003477k. [DOI] [PMC free article] [PubMed] [Google Scholar]
- 44.Zhu H, Yaglidere O, Su T, Tseng D, Ozcan A. Lab Chip. 2010;11:315–322. doi: 10.1039/c0lc00358a. [DOI] [PMC free article] [PubMed] [Google Scholar]
- 45.Zhu H, Mavandadi S, Coskun AF, Yaglidere O, Ozcan A. Anal Chem. 2011;83:6641–6647. doi: 10.1021/ac201587a. [DOI] [PMC free article] [PubMed] [Google Scholar]
- 46.Smith ZJ, Chu K, Espenson AR, Rahimzadeh M, Gryshuk A, Molinaro M, Dwyre DM, Lane S, Mattews D, Wachsmann-Hogiu S. PlonOne. 2011;6:e17150. doi: 10.1371/journal.pone.0017150. [DOI] [PMC free article] [PubMed] [Google Scholar]
- 47.International Telecommunication Union. Market information and statistics. 2010 http://www.itu.int/ITU-D/ict/statistics/index.html.
- 48.Kim JS, Anderson GP, Erickson JS, Golden JP, Nasir M, Ligler FS. Anal Chem. 2009;81:5426–5432. doi: 10.1021/ac9005827. [DOI] [PMC free article] [PubMed] [Google Scholar]
- 49.Kiesel P, Bassler M, Beck M, Johnson N. Appl Phys Lett. 2009;94:041107–3. [Google Scholar]
- 50.Zhu H, Sikora U, Ozcan A. Analyst. 2012;137:2541–2544. doi: 10.1039/c2an35071h. [DOI] [PMC free article] [PubMed] [Google Scholar]
- 51.Daaboul GG, Yurt A, Zhang X, Hwang GM, Goldberg BB, Unlu MS. Nano Lett. 2010;10:4727–4731. doi: 10.1021/nl103210p. [DOI] [PubMed] [Google Scholar]
- 52.Oh C, Isikman SO, Khademhosseinieh B, Ozcan A. Opt Express. 2010;18:4717–4726. doi: 10.1364/OE.18.004717. [DOI] [PMC free article] [PubMed] [Google Scholar]
- 53.Mudanyali O, Tseng D, Oh C, Isikman SO, Sencan I, Bishara W, Oztoprak C, Seo S, Khademhosseini B, Ozcan A. Lab Chip. 2010;10:1417–1428. doi: 10.1039/c000453g. [DOI] [PMC free article] [PubMed] [Google Scholar]
- 54.Greenbaum A, Luo W, Su TW, Göröcs Z, Xue L, Isikman SO, Coskun AF, Mudanyali O, Ozcan A. Nat Methods. 2012;9:889–895. doi: 10.1038/nmeth.2114. [DOI] [PMC free article] [PubMed] [Google Scholar]
- 55.Goodman JW. Introduction to Fourier Optics. 3. Roberts & Company Publishers; 2005. [Google Scholar]
- 56.Biener G, Greenbaum A, Isikman SO, Lee K, Tseng D, Ozcan A. Lab Chip. 2011;11:2738–2743. doi: 10.1039/c1lc20169g. [DOI] [PMC free article] [PubMed] [Google Scholar]
- 57.Lee M, Yaglidere O, Ozcan A. Biomed Opt Express. 2011;2:2721–2730. doi: 10.1364/BOE.2.002721. [DOI] [PMC free article] [PubMed] [Google Scholar]
- 58.Seo S, Isikman SO, Sencan I, Mudanyali O, Su TW, Bishara W, Erlinger A, Ozcan A. Anal Chem. 2010;82:4621–4627. doi: 10.1021/ac1007915. [DOI] [PMC free article] [PubMed] [Google Scholar]
- 59.Mudanyali O, Oztoprak C, Tseng D, Erlinger A, Ozcan A. Lab Chip. 2010;10:2419–2423. doi: 10.1039/c004829a. [DOI] [PMC free article] [PubMed] [Google Scholar]
- 60.Bishara W, Su TW, Coskun AF, Ozcan A. Opt Express. 2010;18:11181–11191. doi: 10.1364/OE.18.011181. [DOI] [PMC free article] [PubMed] [Google Scholar]
- 61.Bishara W, Sikora U, Mudanyali O, Su TW, Yaglidere O, Luckhart S, Ozcan A. Lab Chip. 2011;11:1276–1279. doi: 10.1039/c0lc00684j. [DOI] [PMC free article] [PubMed] [Google Scholar]
- 62.Mudanyali O, Bishara W, Ozcan A. Opt Express. 2011;19:17378–17389. doi: 10.1364/OE.19.017378. [DOI] [PMC free article] [PubMed] [Google Scholar]
- 63.Greenbaum A, Ozcan A. Opt Express. 2012;20:3129–3143. doi: 10.1364/OE.20.003129. [DOI] [PMC free article] [PubMed] [Google Scholar]
- 64.Greenbaum A, Sikora U, Ozcan A. Lab Chip. 2012;12:1242–1245. doi: 10.1039/c2lc21072j. [DOI] [PubMed] [Google Scholar]
- 65.Isikman SO, Bishara W, Sikora U, Yaglidere O, Yeah J, Ozcan A. Lab Chip. 2011;11:2222–2230. doi: 10.1039/c1lc20127a. [DOI] [PMC free article] [PubMed] [Google Scholar]
- 66.Isikman SO, Bishara W, Zhu H, Ozcan A. App Phys Lett. 2011;98:161109–161111. doi: 10.1063/1.3548564. [DOI] [PMC free article] [PubMed] [Google Scholar]
- 67.Isikman SO, Bishara W, Mavandadi S, Yu FW, Feng S, Lau R, Ozcan A. Proc Nat Acad Sci. 2011;18:7296–7301. doi: 10.1073/pnas.1015638108. [DOI] [PMC free article] [PubMed] [Google Scholar]
- 68.Bishara W, Zhu H, Ozcan A. Opt Express. 2010;18:27499–27510. doi: 10.1364/OE.18.027499. [DOI] [PMC free article] [PubMed] [Google Scholar]
- 69.Park S, Park M, Kang M. IEEE Signal Processing Magazine. 2003;20:21–36. [Google Scholar]
- 70.Hardie RC, Barnard KJ, Bognar JG, Armstrong EE, Watson EA. Opt Eng. 1998;37:247. [Google Scholar]
- 71.Allier CP, Hiernard G, Poher V, Dinten JM. Biomed Opt Express. 2010;1:762–770. doi: 10.1364/BOE.1.000762. [DOI] [PMC free article] [PubMed] [Google Scholar]
- 72.Fienup JR. Opt Lett. 1978;3:27–29. doi: 10.1364/ol.3.000027. [DOI] [PubMed] [Google Scholar]
- 73.Allen LJ, Oxley MP. Optics Communications. 2001;199:65–75. [Google Scholar]
- 74.Hsieh J. Computed Tomography: Principles, Design, Artifacts, and Recent Advances. 2. SPIE Publications; 2009. [Google Scholar]
- 75.Hoelen CGA, de Mul FFM, Pongers R, Dekker A. Opt Lett. 1998;23:648–650. doi: 10.1364/ol.23.000648. [DOI] [PubMed] [Google Scholar]
- 76.Zhang HF, Maslov K, Stoica G, Wang LV. Nat Biotech. 2006;24:848–851. doi: 10.1038/nbt1220. [DOI] [PubMed] [Google Scholar]
- 77.Choi W, Fang-Yen C, Badizadegan K, Oh S, Lue N, Dasari RR, Feld MS. Nat Methods. 2007;4:717–719. doi: 10.1038/nmeth1078. [DOI] [PubMed] [Google Scholar]
- 78.Debailleul M, Simon B, Georges V, Haeberle O, Lauer V. Meas Sci Technol. 2008;19:074009. [Google Scholar]
- 79.Charrière F, Pavillon N, Colomb T, Depeursinge C, Heger TJ, Mitchell EAD, Marquet P, Rappaz B. Opt Exp. 2006;14:7005–7013. doi: 10.1364/oe.14.007005. [DOI] [PubMed] [Google Scholar]
- 80.Huisken J, Swoger J, Del Bene F, Wittbrodt J, Stelzer EHK. Science. 2004;305:1007–1009. doi: 10.1126/science.1100035. [DOI] [PubMed] [Google Scholar]
- 81.Keller PJ, Schmidt AD, Wittbrodt J, Stelzer EHK. Science. 2008;322:1065–1069. doi: 10.1126/science.1162493. [DOI] [PubMed] [Google Scholar]
- 82.Zysk AM, Reynolds JJ, Marks DL, Carney PS. Opt Lett. 2003;28:701–703. doi: 10.1364/ol.28.000701. [DOI] [PubMed] [Google Scholar]
- 83.Hahn J, Lim S, Choi K, Horisaki R, Brady DJ. Opt Express. 2011;19:7289–98. doi: 10.1364/OE.19.007289. [DOI] [PubMed] [Google Scholar]
- 84.Paturzo M, Finizio A, Ferraro P. J Disp Tech. 2011;7:24–28. [Google Scholar]
- 85.Ferraro P, Grilli S, Miccio L, Alfieri D, De Nicola S, Finizio A, Javidi B. J Disp Tech. 2008;4:97–100. [Google Scholar]
- 86.Sharpe J, Ahlgren U, Perry P, Hill B, Ross A, hecksher-Sorensen J, Baldock R, Davidson D. Science. 2002;296:541–545. doi: 10.1126/science.1068206. [DOI] [PubMed] [Google Scholar]
- 87.Fauver M, Seibel MEJ. Opt Exp. 2005;13:4210. doi: 10.1364/opex.13.004210. [DOI] [PubMed] [Google Scholar]
- 88.Wolf E. Opt Comm. 1969;1:153–156. [Google Scholar]
- 89.Fang-Yen C, Choi W, Sung Y, Holbrow CJ, Dasari RR, Feld MS. J of Biomed Opt. 2011;16:011005. doi: 10.1117/1.3522506. [DOI] [PMC free article] [PubMed] [Google Scholar]
- 90.Debailleul M, Simon B, Georges V, Haeberle O, Lauer V. Meas Sci Technol. 2008;19:074009. [Google Scholar]
- 91.Lange D, Storment CW, Conley CA, Kovacs GTA. Sens Actuators, B. 2005;107:904–914. [Google Scholar]
- 92.Cui X, Lee LM, Heng X, Zhong W, Sternberg PW, Psaltis D, Yang C. Proc Nat Acad Sci. 2008;105:10670. doi: 10.1073/pnas.0804612105. [DOI] [PMC free article] [PubMed] [Google Scholar]
- 93.Zheng G, Lee SA, Antebi Y, Elowitz MB, Yang C. Proc Nat Acad Sci. 2011;108:16889. doi: 10.1073/pnas.1110681108. [DOI] [PMC free article] [PubMed] [Google Scholar]
- 94.Lee SA, Leitao R, Zheng G, Yang S, Rodriguez A, Yang C. PLoS ONE. 2011;6:e26127. doi: 10.1371/journal.pone.0026127. [DOI] [PMC free article] [PubMed] [Google Scholar]
- 95.Zheng G, Lee SA, Yang S, Yang C. Lab Chip. 2010;10:3125. doi: 10.1039/c0lc00213e. [DOI] [PubMed] [Google Scholar]
- 96.Stybayeva G, Mudanyali O, Seo S, Silangcruz J, Macal M, Ramanculov E, Dandekar S, Erlinger A, Ozcan A, Revzin A. Ana Chem. 2010;82:3736–3744. doi: 10.1021/ac100142a. [DOI] [PMC free article] [PubMed] [Google Scholar]
- 97.Balsam J, Ossandon M, Kostov Y, Bruck HA, Rasooly A. Lab Chip. 2011;11:941–949. doi: 10.1039/c0lc00431f. [DOI] [PubMed] [Google Scholar]
- 98.Balsam J, Bruck HA, Kostov Y, Rasooly A. Sens Actuators B. 2012;171:141–147. doi: 10.1016/j.snb.2012.02.003. [DOI] [PMC free article] [PubMed] [Google Scholar]
- 99.Sun S, Yang M, Kostov Y, Rasooly A. Lab Chip. 2010;10:2093–2100. doi: 10.1039/c003994b. [DOI] [PubMed] [Google Scholar]
- 100.Roda A, Mirasoli M, Dolci LS, Buragina A, Bonvicini F, Simoni P, Guardigli M. Ana Chem. 2011;83:3178–3185. doi: 10.1021/ac200360k. [DOI] [PubMed] [Google Scholar]
- 101.Kim SB, Bae H, Cha JM, Moon SJ, Dokmeci MR, Cropek DM, Khademhosseini A. Lab Chip. 2011;11:1801–1807. doi: 10.1039/c1lc20098d. [DOI] [PMC free article] [PubMed] [Google Scholar]
- 102.Vykoukal DM, Stone GP, Gascoyne PRC, Alt EU, Vykoukal J. Angewandte Chemie. 2009;48:7649–7654. doi: 10.1002/anie.200901814. [DOI] [PMC free article] [PubMed] [Google Scholar]
- 103.Murphy CL, Eulitz M, Hrncic R, Sletten K, Westermark P, Williams T, Macy SD, Wooliver C, Wall J, Weiss DT, Solomon A. Am J Clin Pathol. 2001;116:135–142. doi: 10.1309/TWBM-8L4E-VK22-FRH5. [DOI] [PubMed] [Google Scholar]
- 104.Brezinski ME, Tearney GJ, Bouma BE, Izatt JA, Hee MR, Swanson EA, Southern JF, Fujimoto JG. Circulation. 1996;93:1206–1213. doi: 10.1161/01.cir.93.6.1206. [DOI] [PubMed] [Google Scholar]
- 105.Minsky M. Scanning. 1988;10:128–138. [Google Scholar]
- 106.Maitland KC, Gillenwater AM, Williams MD, El-Naggar AK, Descour MR, Richards-Kortum R. Oral Oncol. 2008;44:1059–66. doi: 10.1016/j.oraloncology.2008.02.002. [DOI] [PMC free article] [PubMed] [Google Scholar]
- 107.Collier T, Guillaud M, Follen M, Malpica A, Richards-Kortum R. J Biomed Opt. 2007;12:024021. doi: 10.1117/1.2717899. [DOI] [PubMed] [Google Scholar]
- 108.Liang C, Descour M, Sung KB, Richards-Kortum R. Opt Express. 2001;9:821–830. doi: 10.1364/oe.9.000821. [DOI] [PubMed] [Google Scholar]
- 109.Huang Y, Zhang K, Lin C, Kang JU. Opt Eng. 2011;50:083201. [Google Scholar]
- 110.Kuck M, Schanzer S, Ulrich M, Bartels NG, Meinke MC, Fluhr J, Krah M, Blume-Peytavi U, Stockfleth E, Lademann J. J Biomed Opt. 2012;17:101504. doi: 10.1117/1.JBO.17.10.101504. [DOI] [PubMed] [Google Scholar]
- 111.Juškaitis R, Wilson T, Watson TF. Scanning. 1997;19:15–19. [Google Scholar]
- 112.Kennedy GT, Manning HB, Elson DS, Neil MA, Stamp GW, Viellerobe B, Lacombe F, Dunsby C, French PM. J Biophotonics. 2010;3:103–107. doi: 10.1002/jbio.200910065. [DOI] [PubMed] [Google Scholar]
- 113.Tanbakuchi AA, Udovich JA, Rouse AR, Hatch KD, Gmitro AF. Am J Obstet Gynecol. 2010;202:90. doi: 10.1016/j.ajog.2009.07.027. [DOI] [PMC free article] [PubMed] [Google Scholar]
- 114.Jean F, Bourg-Heckly G, Viellerobe B. Opt Express. 2007;15:4008–4017. doi: 10.1364/oe.15.004008. [DOI] [PubMed] [Google Scholar]
- 115.Laemmel E, Genet M, Le Goualher G, Perchant A, Le Gargasson JF, Vicaut E. J Vasc Res. 2004;41:400–411. doi: 10.1159/000081209. [DOI] [PubMed] [Google Scholar]
- 116.Gmitro AF, Aziz DJ. Opt Lett. 1993;18:565–567. doi: 10.1364/ol.18.000565. [DOI] [PubMed] [Google Scholar]
- 117.Dubaj V, Mazzolini A, Wood A, Harris M. J Microsc. 2002;207:108–117. doi: 10.1046/j.1365-2818.2002.01052.x. [DOI] [PubMed] [Google Scholar]
- 118.Rogers JD, Landau S, Tkaczyk TS, Descour MR, Rahman MS, Richards-Kortum R, Kärkäinen AH, Christenson T. J Biomed Opt. 2008;13:054020. doi: 10.1117/1.2978060. [DOI] [PMC free article] [PubMed] [Google Scholar]
- 119.Maitland KC, Shin HJ, Ra H, Lee D, Solgaard O, Richards-Kortum R. Opt Express. 2006;14:8604–8612. doi: 10.1364/oe.14.008604. [DOI] [PubMed] [Google Scholar]
- 120.Liu JT, Mandella MJ, Ra H, Wong LK, Solgaard O, Kino GS, Piyawattanametha W, Contag CH, Wang TD. Opt Lett. 2007;32:256–258. doi: 10.1364/ol.32.000256. [DOI] [PMC free article] [PubMed] [Google Scholar]
- 121.Ra H, Piyawattanametha W, Mandella MJ, Hsiung PL, Hardy J, Wang TD, Contag CH, Kino GS, Solgaard O. Opt Express. 2008;16:7224–7232. doi: 10.1364/oe.16.007224. [DOI] [PMC free article] [PubMed] [Google Scholar]
- 122.Ra H, Gonzalez-Gonzalez E, Smith BR, Gambhir SS, Kino GS, Solgaard O, Kaspar RL, Contag CH. J Biomed Opt. 2010;15:036027. doi: 10.1117/1.3432627. [DOI] [PMC free article] [PubMed] [Google Scholar]
- 123.Kumar K, Hoshino K, Zhang X. Biomed Microdevices. 2008;10:653–660. doi: 10.1007/s10544-008-9176-5. [DOI] [PubMed] [Google Scholar]
- 124.Shin D, Pierce MC, Gillenwater AM, Williams MD, Richards-Kortum R. Plos One. 2010;5:e11218. doi: 10.1371/journal.pone.0011218. [DOI] [PMC free article] [PubMed] [Google Scholar]
- 125.Huang D, et al. Optical Coherence Tomography. Science. 1991;254:1178. doi: 10.1126/science.1957169. [DOI] [PMC free article] [PubMed] [Google Scholar]
- 126.Fercher AF, Hitzenberger CK, Juchem M. J Mod Opt. 1991;38:1327. [Google Scholar]
- 127.Hitzenberger CK. App Opt. 1992;31:6637. doi: 10.1364/AO.31.006637. [DOI] [PubMed] [Google Scholar]
- 128.Fujimoto JG, et al. Nature Medicine. 1995;1:970. doi: 10.1038/nm0995-970. [DOI] [PubMed] [Google Scholar]
- 129.Fercher AF, Hitzenberger CK, Kamp G, El-Zaiat SY. Opt Comm. 1995;117:43. [Google Scholar]
- 130.Tearney GJ, et al. Science. 1997;276:2037–2039. doi: 10.1126/science.276.5321.2037. [DOI] [PubMed] [Google Scholar]
- 131.Boppart SA, Bouma BE, Pitris C, Tearney GJ, Fujimoto JG, Brezinski ME. Opt Lett. 1997;22:1618–1620. doi: 10.1364/ol.22.001618. [DOI] [PubMed] [Google Scholar]
- 132.de Boer JF, Cense B, Park BH, Pierce MC, Tearney GJ, Bouma BE. Opt Lett. 2003;28:2067–2069. doi: 10.1364/ol.28.002067. [DOI] [PubMed] [Google Scholar]
- 133.Fercher AF, Drexler W, Hitzenberger CK, Lasser T. Rep Prog Phys. 2003;66:239. [Google Scholar]
- 134.Zysk AM, Nguyen FT, Oldengurg A, Marks DL, Boppart SA. J Bio Opt. 2007;12:051403. doi: 10.1117/1.2793736. [DOI] [PubMed] [Google Scholar]
- 135.Drexler W, Fujimoto JG. Prog Retin Eye Res. 2008;27:45. doi: 10.1016/j.preteyeres.2007.07.005. [DOI] [PubMed] [Google Scholar]
- 136.Vakoc BJ, Fukumura D, Jain RK, Bouma BE. Nat Rev. 2012;12:363. doi: 10.1038/nrc3235. [DOI] [PMC free article] [PubMed] [Google Scholar]
- 137.Tan W, Sendemir-Urkmez A, Fahrner LJ, Jamison R, Leckband DL, Boppart SA. Tissue Enginering. 2004;10:1747–1756. doi: 10.1089/ten.2004.10.1747. [DOI] [PubMed] [Google Scholar]
- 138.Luo W, Nguyen FT, Zysk AM, Ralston TS, Brockenbrough J, Marks DL, Oldenburg AL, Boppart SA. Technology in Cancer Research & Treatment. 2005;4:539–547. doi: 10.1177/153303460500400507. [DOI] [PubMed] [Google Scholar]
- 139.Xi C, Marks DL, Schlachter S, Luo W, Boppart SA. J Biomed Opt. 2006;11:034001. doi: 10.1117/1.2209962. [DOI] [PubMed] [Google Scholar]
- 140.Liu L, Gardecki JA, Nadkarni SK, Toussaint JD, Yagi Y, Bouma BE, Tearney GJ. Nat Med. 2011;17:1010–1014. doi: 10.1038/nm.2409. [DOI] [PMC free article] [PubMed] [Google Scholar]
- 141.Bouma BE, Yun SH, Vakoc BJ, Suter MJ, Tearney GJ. Curr Opin Biotechnol. 2009;20:111–118. doi: 10.1016/j.copbio.2009.02.007. [DOI] [PMC free article] [PubMed] [Google Scholar]
- 142.Reed WA, Yan MF, Schnitzer MJ. Optics Letters. 2002;27:1794–1796. doi: 10.1364/ol.27.001794. [DOI] [PubMed] [Google Scholar]
- 143.Wolf E. Opt Comm. 1969;1:153. [Google Scholar]
- 144.Zheng K, Liu B, Huang C, Brezinski ME. App Opt. 2008;47:6151. doi: 10.1364/ao.47.006151. [DOI] [PMC free article] [PubMed] [Google Scholar]
- 145.Iftimia NV, Bouma BE, Pitman MB, Goldberg B, Bressner J, Tearney GJ. Rev Sci Inst. 2005;76:064301. [Google Scholar]
- 146.Goldberg BD, Nezam SMRM, Jillella P, Bouma BE, Tearney GJ. Opt Exp. 2009;17:3619. doi: 10.1364/oe.17.003619. [DOI] [PMC free article] [PubMed] [Google Scholar]
- 147.Jung W, Kim J, Jeon M, Chaney EJ, Stewart CN, Boppart SA. IEEE Trans Biomed Eng. 2011;58:741. doi: 10.1109/TBME.2010.2096816. [DOI] [PMC free article] [PubMed] [Google Scholar]
- 148.Lu Y, Shi W, Qin J, Lin B. Electrophoresis. 2009;30:579–582. doi: 10.1002/elps.200800586. [DOI] [PubMed] [Google Scholar]
- 149.Martinez AW, Phillips ST, Carrilho E, Thomas SW, Sindi H, Whitesides GM. Analytical Chemistry. 2008;80:3699–3707. doi: 10.1021/ac800112r. [DOI] [PMC free article] [PubMed] [Google Scholar]
- 150.Pamplona V, Passos E, Zizka J, Oliveira M, Lawson E, Clua E, Raskar R. SIGGRAPH. 2011. CATRA: Cataract Probe with a Lightfield Display and a Snap-on Eyepiece for Mobile Phones. [Google Scholar]
- 151.Mudanyali O, Dimitrov S, Sikora U, Padmanabhan S, Navruz I, Ozcan A. Lab Chip. 2012;12:2678–2686. doi: 10.1039/c2lc40235a. [DOI] [PMC free article] [PubMed] [Google Scholar]