

Abstract
Previous investigations have combined transcriptional and genetic analyses in human cell lines1-3, but few have applied these techniques to human neural tissue4-8. To gain a global molecular perspective on the role of the human genome in cortical development, function and ageing, we explore the temporal dynamics and genetic control of transcription in human prefrontal cortex in an extensive series of post-mortem brains from fetal development through ageing. We discover a wave of gene expression changes occurring during fetal development which are reversed in early postnatal life. One half-century later in life, this pattern of reversals is mirrored in ageing and in neurodegeneration. Although we identify thousands of robust associations of individual genetic polymorphisms with gene expression, we also demonstrate that there is no association between the total extent of genetic differences between subjects and the global similarity of their transcriptional profiles. Hence, the human genome produces a consistent molecular architecture in the prefrontal cortex, despite millions of genetic differences across individuals and races. To enable further discovery, this entire data set is freely available (from Gene Expression Omnibus: accession GSE30272; and dbGaP: accession phs000417.v1.p1) and can also be interrogated via a biologist-friendly stand-alone application (http://www.libd.org/braincloud).
The temporal dynamics of genome expression throughout the body and its genetic and epigenetic control are central to a synthetic understanding of how a relatively small number of DNA molecules can give rise to an entire human. Similarly, temporal expression patterns in neural tissue and their regulation across the lifespan will elucidate molecular mechanisms involved in the formation, mature function and degeneration of the human brain.
Previous studies have combined transcriptome and genetic analyses to investigate the genetic control of gene expression in human cell lines1-3. Few studies have applied these genomic techniques to human neural tissue4-7 or human brain disease8. Others have focused on the transcriptome in human fetal brain tissue9, temporal patterns of gene expression in postnatal life10, and gene co-expression patterns in the brain11,12. Here we describe the combination of genome-wide DNA and RNA analyses in a large collection of meticulously curated human brain specimens to produce a comprehensive view of how the expression of the human genome in the prefrontal cortex (PFC) progresses from fetal development through ageing and how sequence variation in the genome impacts on these expression patterns.
The post-mortem brain tissue collection (n = 269 subjects without neuropathological or neuropsychiatric diagnosis) spans the majority of the human lifespan (Fig. 1a, b). From each subject in the brain collection, RNA from PFC grey matter was analysed using spotted oligonucleotide microarrays yielding data from 30,176 gene expression probes. DNA from cerebellar tissue was studied with Illumina BeadChips producing 625,439 single nucleotide polymorphism (SNP) genotypes for each subject.
Figure 1. A global view of the PFC transcriptome.

a, Histogram of subject ages in the brain collection. Birth is indicated by the dashed white line. This colour scale serves as the legend for all panels in Fig. 1 and Fig. 2b. b, Box plot of absolute rates of expression change within each stage of life. Because the rates of expression change are so high early in life, the y-axis scale is different for fetal and infant stages than for all other stages. The two horizontal dotted lines in the left panel show the entire extent of the y axis in the right panel. Only microarray probes showing systematic variation with age (R2 > 0.5) were included (n = 8,704 probes). Age ranges: fetal, 14–20 gestational weeks; infant, 0–6 months; child, 1–10 years; decades as labelled. Open points depict the mean expression correlation across subjects within each age stage (Pearson’s r calculated across all expression measures; y axis scale at far right). Filled points depict the mean expression correlation across subjects between adjacent age stages. The grey histogram displays the distribution of ages that marked a change in the trajectory of expression for genes across the postnatal lifespan (see Methods). c, A global view of dynamic PFC transcription across the lifespan, using MDS (distance = 1 − r, stress = 20.5) and expression correlation. Each mRNA sample is represented as a single point coloured by the age of the subject. Pairwise distances are derived from correlation across all expression measures between subjects, such that proximity indicates similarity, whereas distance indicates dissimilarity. d, PCA of transcription in PFC across the lifespan. PCA was performed on data from all gene expression probes to represent each mRNA sample as a single point coloured by the age of the subject.
The absolute rate of expression change within each life stage was quantified for all genes using linear models (Fig. 1b, box plot). The rate of expression change during fetal development is much faster than at any other stage in human life. Changes during infancy are much slower, yet still more rapid than at any later time in life. After the first half year of postnatal life, rates of expression change slow markedly, and continue to slow during the childhood and teenage years, subsequently maintaining a low rate of change through the 20s, 30s and 40s. After this period, rates of expression change begin to rise again through several decades, and in the aged human brain, change reaches and then exceeds rates observed during teenage years.
The distribution of expression trajectory turning points was investigated across postnatal life (Fig. 1b, grey histogram). Rates of expression change decrease from childhood through the teenage years (blue boxes) as many genes redirect expression trajectories (peak in grey histogram near 20 years). In contrast, in ageing, expression change accelerates (yellow–orange boxes) as more genes enter turning points (the minor peak in the grey histogram near 60 years).
The correlation of expression measures across subjects was explored within each age stage and between adjacent stages (Fig. 1b, points). Transcription in PFC appears most similar across individuals at the beginning of life and then again to a lesser extent nearer its end, demonstrating the most diversity during the years of mature brain functioning, when age-dependent rates of expression change are lowest (this observation is also clear in Fig. 1c). The separation of mean within- and between-age stage correlations observed early in life indicates the occurrence of fundamentally distinct transcriptional programs within fetal, infant and childhood development, followed by a smoother more continuous progression of change throughout the rest of the lifetime.
To obtain a global perspective on transcription in PFC across the human lifetime, expression profile correlations were combined with multidimensional scaling (MDS) to reduce the complexity of the expression data and produce an intuitive visualization of global patterns (Fig. 1c). The spatial progression of the colour scale in this plot is a reflection of age-dependent change in human PFC transcription. Even within the brief 6-week range of fetal development examined, there is clearly observable systematic expression change with time (along the vertical axis). Following fetal development, the path of global transcriptional change alters markedly, progressing steadily away from the fetal state through the neonatal, infant and childhood ages, each of which has a relatively distinct identity compared with other periods (across the horizontal axis). A second redirection of global transcriptional change occurs at the end of the teenage years (also observed from a different perspective in Fig. 1b, grey histogram), followed by a more linear progression through adulthood and into ageing. This global view was also used to inspect the effects of covariates (Supplementary Fig. 1).
In another global view of prefrontal transcription, the age effect within the fetal samples is effectively illustrated using principal components analysis (PCA, Fig. 1d). The first principal component (PC1) separates the fetal from postnatal samples, whereas the second (PC2) appears to align with age effects within both the fetal and postnatal samples. The directions of the fetal and postnatal age effects along PC2 appear to be in opposition. Additionally, fetal expression changes are negatively correlated with those in other stages of early life: infancy r = −0.45, P = 1.3 × 10−90; childhood r = −0.48, P = 1.5 × 10−47; and teenage years r = −0.18, P = 2.3 × 10⁻⁸ (including only probes with slopes at P < 0.05 in both stages, Supplementary Table 1). This might indicate that select fetal expression changes are reversed at different times across the lifespan, beginning immediately after birth.
To investigate further this observation of reversing trajectories, genes showing significant expression change across age in both fetal and infant development were compared directly (Fig. 2a, b). Approximately three-quarters of genes showing significant change in both stages reverse their direction of expression change between fetal and early postnatal life, with most changing from an increase in utero to a decrease in the months after birth.
Figure 2. Reversal of fetal expression changes in infancy and ageing.

a, Scatter plot of fetal and infant gene expression change with age. Each gene is represented as a single point. Only genes with slopes at P < 0.05 in both stages were included in this analysis (n = 1,502 genes measured by 1,819 probes: Supplementary Table 2). The number of genes in each quadrant is indicated in black. The P-values listed were derived from Pearson’s χ2 tests comparing the proportion of genes in each quadrant compared to an expected proportion of 0.25. Key functional gene groups are highlighted and listed in the quadrants where they are over-represented. b, Depiction of individual genes’ expression across the human lifespan, illustrating the four patterns of expression across fetal and infant development shown in a. The gene depicted in each panel is an example drawn from gene groups highlighted in the corresponding quadrants in a. Expression levels (normalized log2(sample/reference)) are on the y axis, with age on the x axis. The linear age scale is variable within each of the individual stages of life as labelled. Subjects are coloured by age as in Fig. 1a. GW, gestational week. Clockwise from top left: NADH dehydrogenase (ubiquinone) 1α subcomplex 7, 14.5 kDa (NDUFA7; ATP synthesis); γ-aminobutyric acid A receptor, α1 (GABRA1; synapse); stathmin-like 2 (STMN2; axon); and cyclin B2 (CCNB2; cell cycle). c, Visualization of ageing (50s) and infant expression trajectories among genes showing reversal between fetal development and infancy (same genes depicted in a, lower right and upper left panels, n = 1,105). The red line depicts a linear fit to the data.
To gain functional insight into these changing expression patterns, the genes within each of the quadrants in Fig. 2a were interrogated for the over-representation of functional gene groups. Detailed functional group lists for each of the quadrants are contained in Supplementary Table 3. This examination of gene expression trajectories in early life may give a global genomic perspective on mechanisms in neural development that have been well studied at the individual cell and gene level: genes involved in cell division are over-represented among genes for which expression decreases during both fetal development and infancy. Inversely, genes related to the synapse are over-represented among genes showing expression increases during both stages. This pair of findings is a genomic reflection of the well-characterized decrease in cell proliferation with opponent increase in neuronal differentiation through both late fetal and early infant development.
In contrast to synaptic components, genes with axonal function are highly enriched among genes showing increasing expression during fetal development followed by decreases after birth. This coordinated reversal of expression trajectories among axonal genes while many synaptic genes continue to increase in infancy is probably a genomic view of the process of pruning exuberant axons while synapse development and maturation at appropriate target sites advance13. Specific gene expression changes in synaptic and axonal genes during fetal and infant life are listed in Supplementary Table 4.
Genes in ATP synthesis also show a reversal of expression patterns, but in this case, decreasing during fetal development and rising after birth. In fetal development, energy metabolism seems to be slowing along with the decrease in cellular proliferation, consistent with cell division as the primary energy consuming process during fetal development. However, after birth, proliferation in the PFC continues to slow while expression of energy metabolism genes increases markedly. Other functional gene groups with increasing expression during these first postnatal months include genes involved in Ca2+ binding, Ca2+ transport, gated ion channels, voltage-gated K+ channels and active ion transport (Supplementary Table 3), indicating that neuronal maturation and activity now drive energy production.
This functional analysis of expression trajectories also reveals potentially novel mechanisms in early cortical development: in the heavily populated quadrant showing increasing expression in the fetus and decreasing expression in infancy, 22 of the top 49 over-represented gene groups are microRNA (miRNA) target gene groups (Supplementary Table 3, P = 6.5 × 10⁻⁵ and below). Together, these miRNA target groups account for 266 of the 673 genes in this quadrant (40%). miR-9 targets are the most highly enriched of these miRNA target gene groups. miR-9 is brain-specific14 and is used reiteratively in diverse processes in neural development, including patterning, neurogenesis and differentiation15,16, as well as cell migration17.
The reversal of fetal expression trajectories is also seen much later in life. Fetal expression trajectories show a strong negative correlation with changes observed in the sixth decade of life (50s) (r = −0.46, P = 2.4 × 10⁻²¹; Supplementary Table 1). This finding is consistent with the age-dependent repression of neuronal genes observed previously18. Whereas fetal expression trajectories show negative correlation with both infant and 50s trajectories, expression trajectories in infancy do not correlate with those observed in the 50s (Supplementary Table 1). However, within the set of genes showing trajectory reversal between fetal and infant ages, expression change in infancy and in the 50s share a striking amount of similarity (Fig. 2c). Therefore, although infant expression changes do not globally resemble those happening later in life, the specific reversal of fetal expression trajectories seen in infancy is mirrored within changes in ageing.
These fetal reversals in ageing can also be demonstrated by comparing our observations in fetal development with recent findings in ageing. Genes with significant increases during fetal development are enriched for genes shown to decrease in the ageing cortex19, whereas genes decreasing during fetal development are enriched for genes known to increase in ageing (P = 1.0 × 10⁻⁶ and P = 4.6 × 10⁻¹¹, respectively; see Supplementary Table 5). Similar reversals are also seen in genes reported to change in Alzheimer’s disease20: fetal increases are enriched for genes downregulated in Alzheimer’s disease and fetal decreases are enriched for genes upregulated in Alzheimer’s disease (P = 2.2 × 10⁻²¹ and P = 7.1 × 10⁻⁷, respectively; see Supplementary Table 5). Hence, in the PFC, the reversal of specific expression patterns from in utero development occurs in infancy and then again much later in normal ageing and in the neuropathological processes of Alzheimer’s disease.
To explore the genetic control of prefrontal expression patterns, DNA from the sample collection was interrogated with high-density SNP microarrays to catalogue common genomic polymorphisms. All possible associations of SNP genotypes with gene expression levels were examined (expression quantitative trait loci, or eQTL): n = 30,176 expression probes × 625,439 SNP genotypes = 1.89 × 10¹⁰ (~19 billion) possible associations. Consistent with previous observations, we see that individual SNPs can profoundly affect the expression level of individual genes. When considering data across all subjects, 1,628 individual associations surpass genome-wide Bonferroni correction. Association analysis was also conducted within the African American and Caucasian samples separately (significant associations for all analyses are in Supplementary Table 6).
The strength and location of associations relative to transcriptional start sites (TSS) are explored in Fig. 3a. Consistent with past eQTL studies across many organisms, we find that effects proximal to TSSs are of greater average strength than associations across greater distances or across chromosomes (Fig. 3a). There are considerably more strong associations downstream (3′) from the TSS than upstream. This is consistent with previous observations8, and demonstrates that downstream polymorphisms (often within gene sequences) that impact on expression are stronger and/or more numerous than alterations at equal distances upstream (potentially in promoter or enhancer sequences). Additionally, expression-associated SNPs are biased towards positions within genes (fold enrichment = 1.61, P = 2.9 × 10−76). Within this gene bias, both exonic and intronic locations are over-represented, but to vastly different degrees (fold enrichment = 4.3 and 1.4, P = 5.0 × 10−94 and 1.2 × 10⁻³², respectively).
Figure 3. Genetic control of PFC gene expression.

a, Position and strength of associations of SNP genotype with gene expression levels (distance of the SNP from the associated TSS is plotted on the x axis). Only gene–SNP pairs lying on the same chromosome are displayed here. Negative log10(P value) is on the y axis. Only P values <0.0001 are included in this analysis. The genome-wide Bonferroni-corrected P = 0.05 is shown as a horizontal dashed grey line: P = 0.05/1.89 × 1010 associations = 2.6 × 10⁻¹² (11.6 on this y-axis scale). The numbers of associations listed in the plot refer to those passing this genome-wide alpha level. Both solid blue curves depict a local nonlinear regression fit (loess, span = 0.5) of association strength across distance from the TSS. The blue fit lying close to the y axis is a fit plotted in the same scale as the plotted P values (y axis at left). The second blue fit is the same fit, plotted on an expanded y axis (y axis at right). The minimum value of this fit both upstream and downstream from the TSS (that is, approximately where the local estimate of enrichment for greater association reaches zero) is marked with a vertical blue dashed line. b, The most significant observed association of a single SNP with the expression of one gene across the lifespan (highlighted in a in green): the rs1045599 SNP lies within the ZSWIM7 gene on chromosome 17 (ZSWIM7, zinc finger, SWIM-type containing 7). Age scales are defined as in Fig. 2b. ZSWIM7 expression level (normalized log2(sample/reference)) is on the y axis and is coloured by rs1045599 genotype.
The single strongest association observed was between the expression of the ZSWIM7 gene and SNP rs1045599, located within this same gene (Fig. 3a, b). This association of genotype with expression level is observed across all ages and races studied. Similar to this analysis, the freely available interactive stand-alone application that we have developed enables the visualization of expression data across the lifespan and the exploration of genetic associations for individual gene queries (http://www.libd/braincloud). We invite the research community to explore this resource with their own interests.
To explore the relationship between the genome as a whole and the PFC transcriptome as a whole, we compared genetic distance and transcriptional distance in all possible pairwise subject comparisons (Fig. 4). Although individual SNPs clearly have an impact on the expression of individual genes (Fig. 3 and Supplementary Table 6) globally, there is no association of genetic distance between individual humans with the similarity of their prefrontal transcriptional profiles (Fig. 4, R2 = 0.002).
Figure 4. The genome produces a consistent molecular architecture in PFC.
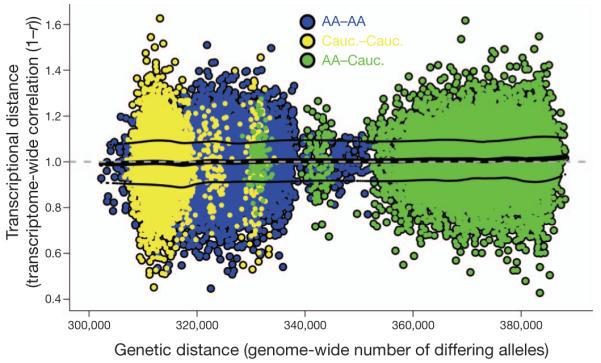
Global comparison of genetic and transcriptional differences between subjects. Each point represents a comparison of two subjects in the collection. Genetic distance between subjects is depicted on the x axis as the number of differing alleles over the portion of the genome interrogated. Transcriptional distance is shown on the y axis as 1 minus the correlation across all gene expression values from the subjects (as used in Fig. 1c). Each subject comparison is coloured to indicate the races (AA, African American; Cauc., Caucasian) of the two individuals involved in the comparison. The thick black curve is an estimate of the local mean (loess, span = 0.25) of transcriptional distance as it varies across genetic distance. The thin black curves depict fits to the residuals around this mean. Only African American and Caucasian sample comparisons are visualized here (>96% of the collection).
This dramatic lack of association between genetic distance and transcriptome distance across our sample is a surprising result that requires further interrogation. It is possible that no association is found in Fig. 4 because most of the genetic polymorphisms measured do not impact on gene expression. Therefore, we repeated this search for association by investigating global transcriptional distance across a focused subset of the genetic data: only SNPs involved in genome-wide significant SNP–expression associations were considered. This analysis also revealed no association between focused genetic distance and global transcriptional distance (Supplementary Fig. 2). In addition, these same analyses performed within individual races showed no association between global transcriptional distance and genetic distance when either global or focused genetic distance was used.
We conclude that despite the many genetic polymorphisms that individually can affect the expression of single genes, the human genome produces a consistent molecular architecture in the human prefrontal cortex across the lifespan. This is true across (the human) race. It is possible that individual genetic traits and complex combinations of traits that disrupt this architecture are selected against in the general population and would not appear in studies of normal human brain development. The clear observation of associations of individual genetic polymorphisms with gene expression (Fig. 3) in the absence of a relationship between global genetic and transcriptome profiles (Fig. 4) demonstrates our ability to analyse microscale genetic effects while macroscale interactions remain elusive. It is perhaps useful to consider each individual complete genome as a grand combination of variants which is acted upon (in evolution and in environment) and which acts (in development, biological function and disease) as a whole, rather than individual genetic traits in isolation. Characterization of the higher-order interactions within this whole is a great challenge facing biologists today.
By creating this freely available public resource, we hope that the research community can further explore this data set. This full data set is downloadable at http://www.ncbi.nlm.nih.gov/geo/query/acc.cgi?acc=GSE30272 (expression data) and http://www.ncbi.nlm.nih.gov/projects/gap/cgi-bin/study.cgi?study_id=phs000417.v1.p1 (SNP data). In addition, we have constructed a biologist-friendly stand-alone application designed to allow the research community to interrogate this resource one gene at a time (http://www.libd.org/braincloud).
METHODS SUMMARY
Brain tissue collection
Post-mortem human brains from the NIMH Brain Tissue Collection in the Clinical Brain Disorders Branch (NIMH, CBDB) were obtained at autopsy. Additional brain tissue samples were provided by the NICHD Brain and Tissue Bank for Developmental Disorders (http://www.BTBank.org). Clinical characterization, diagnoses and macro- and microscopic neuropathological examinations, toxicological analysis, RNA extraction and quality control measures were performed using a standardized paradigm. Subjects with evidence of neuropathology, drug use, alcohol abuse, or psychiatric illness were excluded. Subject demographics and sample details are contained in Supplementary Table 7.
RNA resources
Post-mortem PFC grey matter tissue homogenates were obtained from all subjects. Total RNA was extracted, amplified and fluorescently labelled. Reference RNA was pooled from all samples and treated identically to sample RNAs. Labelled RNAs were hybridized to two-colour custom-spotted arrays from the NHGRI microarray core facility. After normalization21, log2 intensity ratios were further adjusted to reduce the impact of known and unknown sources of systematic noise on gene expression measures using surrogate variable analysis22 (SVA). Validation of microarray expression patterns was performed by Taqman qPCR (Supplementary Table 8). In this study of RNA derived from tissue homogenates, differential gene expression within a population of cells stable in cell type is indistinguishable from a change in the abundance of cell types that express different genes. There is no doubt that both phenomena contribute to signals measured here in the prefrontal cortex.
DNA resources
DNA for genotyping was obtained from the cerebella of samples in the collection and applied to Illumina BeadArrays. Genotypes were called using BeadExpress software.
Functional gene groupings
To generate functional gene groups for the analysis described in Fig. 2a and the text, microarray probes were annotated with data from numerous public, online sources. Enrichment of functional gene groups within various gene lists as described in the text was assessed by a standard hypergeometric test.
SNP–expression associations
SNP–expression associations were carried out using linear models that included surrogate variables, age, life stage (as defined in Fig. 1b), an interaction of age and life stage, sex, race and the SNP under investigation. SNP was included as a continuous variable.
Full Methods and any associated references are available in the online version of the paper at www.nature.com/nature.
METHODS
Human post-mortem brain tissue collection
The NIMH Brain Tissue Collection in the Clinical Brain Disorders Branch (NIMH, CBDB) obtained post-mortem human brains at autopsy primarily from the Offices of the Chief Medical Examiner of the District of Columbia, and of the Commonwealth of Virginia, Northern District, all with informed consent from the legal next of kin (protocol 90-M-0142 approved by the NIMH/NIH Institutional Review Board). Additional post-mortem fetal, infant, child and adolescent brain tissue samples were provided by the National Institute of Child Health and Human Development Brain and Tissue Bank for Developmental Disorders (http://www.BTBank.org) under contracts NO1-HD-4-3368 and NO1-HD-4-3383. The Institutional Review Board of the University of Maryland at Baltimore and the State of Maryland approved the protocol, and the tissue was donated to the NIMH under the terms of a Material Transfer Agreement. Clinical characterization, diagnoses, and macro- and microscopic neuropathological examinations were performed on all CBDB cases using a standardized paradigm. Details of tissue acquisition, handling, processing, dissection, clinical characterization, diagnoses, neuropathological examinations, RNA extraction and quality control measures were described previously23. The Brain and Tissue Bank cases were handled in a similar fashion (http://medschool.umaryland.edu/BTBank/ProtocolMethods.html). Toxicological analysis was performed on every case. Subjects with evidence of macro- or microscopic neuropathology, drug use, alcohol abuse, or psychiatric illness were excluded. Subject demographics and sample details are contained in Supplementary Table 7.
RNA resources and analysis
Post-mortem tissue homogenates of PFC grey matter (DLPFC, that is, BA46/9 in postnatal samples and the corresponding region of PFC in fetal samples) were obtained from all subjects (n = 269 after all exclusion criteria). Total RNA was extracted from ~100 mg of tissue using the RNeasy kit (Qiagen) according to the manufacturer’s protocol. Samples with RNA integrity number (RIN) <5 were excluded. 500 ng of each total RNA sample was reverse transcribed with an oligo dT-T7 and amplified (T7) using the Ambion MessageAmp II kit (catalogue no. 1753, Ambion). The generated aminoallyl UTP-labelled antisense RNAs (aRNAs) were then coupled with Cy3 mono NHS ester CyDye from GE Healthcare. Reference RNA was pooled from all samples and was treated identically to sample RNAs, but was labelled with the Cy5 fluorescent dye. Two-colour custom-spotted oligonucleotide microarrays from the NHGRI microarray core facility using the Illumina Oligoset (HEEBO7) of 49,152 70-mer probes were used. After purification, the labelled aRNAs are hybridized overnight to the oligo arrays in 53 SSC, 25% formamide and 0.2% SDS buffer at 45 °C using Maui Mixer FL hybridization chambers (BioMicro Systems). The slides are then washed at room temperature in a series of SSC/SDS buffers and dried by centrifugation. A laser confocal scanner (Agilent Technologies) was used to scan the hybridized microarrays. DeArray software (Scanalytics, Inc.) was used to export intensity data. Probes that were non-human, nonspecific (that is, mapped to >1 expressed sequence), incorrectly annotated, or probes containing polymorphisms with minor allele frequency > 0.01 according to HapMap in either YRI or CEU populations were removed from the analysis. Intensities below an empirically determined low intensity cutoff of 5.3 on the log2 scale were dropped from the data. Probes with fewer than half of the fetal or postnatal data pointsremaining after thisstep were removed. Additionally, outliers defined as >6 mean average deviations from the age-appropriate linear fit were removed. The total number of probes remaining was 30,176. After background correction on the linear scale, log2 ratios (sample/reference) were normalized across mean log2 florescent intensities using loess correction21. Missing data in the gene expression data matrix were imputed at this stage to enable both SVA and PCA. After normalization, log2 ratios were further adjusted to reduce the impact of known and unknown sources of systematic noise on gene expression measures using SVA22. Two surrogate variables were generated and used to adjust log2 ratios in all subsequent linear models. Correlation between the naively created surrogate variables and known sources of noise were evident: SV1 + RIN: r = 0.37, P = 4.7 × 10⁻¹⁰; SV2 + ArrayBatch: r = 0.73; P < 2 × 10⁻¹⁶. All of these microarray data analyses were conducted using custom code and tools from the Bioconductor project (http://www.bioconductor.org/) in the R statistical language (http://www.r-project.org/). Validation of microarray expression patterns was performed by Taqman qPCR (Supplementary Table 8).
DNA resources and analysis
DNA for genotyping was obtained from the cerebella of 266 of the total 269 samples in the collection and applied to either Illumina Infinium II 650K or Illumina Infinium HD Gemini 1M Duo BeadChips according to manufacturer’s protocols. Only genotypes common to both platforms are analysed here. Genotypes were called using BeadExpress software. SNPs were removed if the call rate was <98% (mean call rate for this study >99%), if not in Hardy–Weinberg equilibrium (P < 0.001) within Caucasian and within African American races separately, or not polymorphic (MAF <0.01). The total number of SNPs remaining in the analysis was 625,439 (96.2%).
Expression turning points
For each probe, a linear-spline model of expression across age was fit with a single change point. The change point was allowed to vary across the entire age range, and the change point that produced the lowest meansquared error was selected as the expression turning point for that probe. Data within the first and last decade of the range interrogated (0–10 and 70–80 years) were excluded to avoid edge effects (n = 7,272 probes). See Fig. 1b (grey histogram).
MDS using expression correlation as a distance metric
This representation (see Fig. 1c) was generated using 1 − r as a distance metric, where r is the pairwise Pearson’s correlation coefficient calculated across all gene expression probes for each pair of samples. These distances were coupled with an MDS algorithm to attempt to satisfy all the pairwise distances in two-dimensional space. For both MDS and PCA, three-dimensional analyses more precisely depict systematic age effects (Supplementary Fig. 1, parts 2 and 3). It is important to note in this analysis (and those shown in Figs 1b and 4) that because expression data are expressed as a ratio to reference here, the mean expression correlation across all samples is near zero: r = 0.02.
Functional gene groupings
To generate functional gene groups for the analysis described in Fig. 2a and the text, we annotated all probes with data from Kyoto Encyclopedia of Genes and Genomes Pathways (http://www.genome.jp/kegg), the Gene Ontology project (http://www.geneontology.org), the Pfam database (http://www.sanger.ac.uk/Software/Pfam), mouse knockout phenotypes and human disease phenotypes collected by Kevin Becker’sgroup at the National Institute on Ageing24,25, the GSA project at Stanford (http://www-stat.stanford.edu/~tibs/GSA) and the GSEA project at the Broad Institute (http://www.broad.mit.edu/gsea), the HPRD project (http://www.hprd.org), as well as many groups collected from diverse sources at NCBI (http://www.ncbi.nlm.nih.gov), including protein-protein interactions and miRNA binding motifs26,27. Compilation of functional information from all of these sources and considering only gene groups of size 3–1,000 resulted in 23,810 partially redundant and overlapping functionally related gene groups. Enrichment of functional gene groups within various gene lists as described in the text was assessed by a standard hypergeometric test.
During the exploration of data for Fig. 2, it was observed that there is significant correlation between the age and sex variables within the first 6 months of life (r = 0.5). To ensure that this correlation was not responsible for the discoveries in Fig. 2, the entire analysis was repeated while adjusting expression measures for sex. All the findings detailed in Fig. 2 were replicated in this verification analysis.
Calculation of SNP-expression associations
SNP-expression associations referred to in Fig. 3 and Supplementary Table 6 were carried out using linear models that included surrogate variables generated as described above, age, life stage (as defined in Fig. 1b), an interaction of age and life stage, sex, race, and the SNP under investigation. The SNP was included as a continuous variable, coded as 1,2,3; that is, an additive or ‘dosage’ model rather than a categorical or ‘co-dominant’ model was used. Association methods used to generate hits for the genetic distance used in Supplementary Fig. 2, part 1, were identical to those described above except for the omission of the race and sex terms in the linear model. To confirm that this analytical framework is capable of discovering associations between genetic and transcriptional metrics as analysed here, we conducted a positive control analysis (Supplementary Fig. 2, part 2; negative control also included).
Supplementary Material
Acknowledgements
We thank the families who donated tissue to make this study possible. We also thank the Offices of the Chief Medical Examiner of the District of Columbia, and of the Commonwealth of Virginia, Northern District, and the National Institute of Child and Health Development Brain and Tissue Bank for their collaboration. We thank R. McKay, N. Schork, F. McMahon and S. Zeger for their consultations on many issues, L. Marchionni for his assistance in assembling functional gene groups, as well as A. Deep-Soboslay, L. B. Bigelow, L. Wang, R. Buerlein, H. Choxi, V. Imamovic, Y. Snitkovsky, J. D. Paltan-Ortiz, J. Sirovatka, K. Becker, E. Lehrman and R. Vakkalanka for their contributions to this work.
Footnotes
Supplementary Information is linked to the online version of the paper at www.nature.com/nature.
Author Contributions C.C., design of the study, data exploration and analysis, writing of manuscript; B.K.L., design of the study, preparation of samples, data analysis, writing of the paper; T.Y., data analysis and web tool construction; T.M.H., brain collection, diagnosis, dissection (primary); writing/editing and commentary on analysis (secondary); planning experiment (primary); R.T., genotyping; J.T.L., surrogate variable analysis methods and code, statistical consultation; E.A.C., linear model methods, statistical consultation; A.G.E., microarray experiments; M.M.H., tissue characterization and micro/macro neuropathology; D.R.W., design and planning of the study, writing of manuscript; J.E.K., experimental design, characterization of specimens, data analysis and writing/editing.
The authors declare no competing financial interests.
The entire data set has been deposited in Gene Expression Omnibus under accession number GSE30272 and dbGaP under accession number phs000417.v1.p1 and can also be interrogated at http://www.libd.org/braincloud.
References
- 1.Schadt EE, et al. Genetics of gene expression surveyed in maize, mouse and man. Nature. 2003;422:297–302. doi: 10.1038/nature01434. [DOI] [PubMed] [Google Scholar]
- 2.Morley M, et al. Genetic analysis of genome-wide variation in human gene expression. Nature. 2004;430:743–747. doi: 10.1038/nature02797. [DOI] [PMC free article] [PubMed] [Google Scholar]
- 3.Stranger BE, et al. Genome-wide associations of gene expression variation in humans. PLoS Genet. 2005;1:e78. doi: 10.1371/journal.pgen.0010078. [DOI] [PMC free article] [PubMed] [Google Scholar]
- 4.Myers AJ, et al. A survey of genetic human cortical gene expression. Nature Genet. 2007;39:1494–1499. doi: 10.1038/ng.2007.16. [DOI] [PubMed] [Google Scholar]
- 5.Heinzen EL, et al. Tissue-specific genetic control of splicing: implications for the study of complex traits. PLoS Biol. 2008;6:e1. doi: 10.1371/journal.pbio.1000001. [DOI] [PMC free article] [PubMed] [Google Scholar]
- 6.Gibbs JR, et al. Abundant quantitative trait loci exist for DNA methylation and gene expression in human brain. PLoS Genet. 2010;6:e1000952. doi: 10.1371/journal.pgen.1000952. [DOI] [PMC free article] [PubMed] [Google Scholar]
- 7.Liu C, et al. Whole-genome association mapping of gene expression in the human prefrontal cortex. Mol. Psychiatry. 2010;15:779–784. doi: 10.1038/mp.2009.128. [DOI] [PMC free article] [PubMed] [Google Scholar]
- 8.Webster JA, et al. Genetic control of human brain transcript expression in Alzheimer disease. Am. J. Hum. Genet. 2009;84:445–458. doi: 10.1016/j.ajhg.2009.03.011. [DOI] [PMC free article] [PubMed] [Google Scholar]
- 9.Johnson MB, et al. Functional and evolutionary insights into human brain development through global transcriptome analysis. Neuron. 2009;62:494–509. doi: 10.1016/j.neuron.2009.03.027. [DOI] [PMC free article] [PubMed] [Google Scholar]
- 10.Somel M, et al. MicroRNA, mRNA, and protein expression link development and aging in human and macaque brain. Genome Res. 2010;20:1207–1218. doi: 10.1101/gr.106849.110. [DOI] [PMC free article] [PubMed] [Google Scholar]
- 11.Oldham MC, et al. Functional organization of the transcriptome in human brain. Nature Neurosci. 2008;11:1271–1282. doi: 10.1038/nn.2207. [DOI] [PMC free article] [PubMed] [Google Scholar]
- 12.Torkamani A, Dean B, Schork NJ, Thomas EA. Coexpression network analysis of neural tissue reveals perturbations in developmental processes in schizophrenia. Genome Res. 2010;20:403–412. doi: 10.1101/gr.101956.109. [DOI] [PMC free article] [PubMed] [Google Scholar]
- 13.Luo L, O’Leary DD. Axon retraction and degeneration in development and disease. Annu. Rev. Neurosci. 2005;28:127–156. doi: 10.1146/annurev.neuro.28.061604.135632. [DOI] [PubMed] [Google Scholar]
- 14.Deo M, Yu JY, Chung KH, Tippens M, Turner DL. Detection of mammalian microRNA expression by in situ hybridization with RNA oligonucleotides. Dev. Dyn. 2006;235:2538–2548. doi: 10.1002/dvdy.20847. [DOI] [PubMed] [Google Scholar]
- 15.Gao FB. Context-dependent functions of specific microRNAs in neuronal development. Neural Develop. 2010;5:25. doi: 10.1186/1749-8104-5-25. [DOI] [PMC free article] [PubMed] [Google Scholar]
- 16.Coolen M, Bally-Cuif L. MicroRNAs in brain development and physiology. Curr. Opin. Neurobiol. 2009;19:461–470. doi: 10.1016/j.conb.2009.09.006. [DOI] [PubMed] [Google Scholar]
- 17.Delaloy C, et al. MicroRNA-9 coordinates proliferation and migration of human embryonic stem cell-derived neural progenitors. Cell Stem Cell. 2010;6:323–335. doi: 10.1016/j.stem.2010.02.015. [DOI] [PMC free article] [PubMed] [Google Scholar]
- 18.Loerch PM, et al. Evolution of the aging brain transcriptome and synaptic regulation. PLoS ONE. 2008;3:e3329. doi: 10.1371/journal.pone.0003329. [DOI] [PMC free article] [PubMed] [Google Scholar]
- 19.Lu T, et al. Gene regulation and DNA damage in the ageing human brain. Nature. 2004;429:883–891. doi: 10.1038/nature02661. [DOI] [PubMed] [Google Scholar]
- 20.Blalock EM, et al. Incipient Alzheimer’s disease: microarray correlation analyses reveal major transcriptional and tumor suppressor responses. Proc. Natl Acad. Sci. USA. 2004;101:2173–2178. doi: 10.1073/pnas.0308512100. [DOI] [PMC free article] [PubMed] [Google Scholar]
- 21.Colantuoni C, Henry G, Zeger S, Pevsner J. SNOMAD (Standardization and NOrmalization of MicroArray Data): web-accessible gene expression dataanalysis. Bioinformatics. 2002;18:1540–1541. doi: 10.1093/bioinformatics/18.11.1540. [DOI] [PubMed] [Google Scholar]
- 22.Leek JT, Storey JD. Capturing heterogeneity in gene expression studies by surrogate variable analysis. PLoS Genet. 2007;3:1724–1735. doi: 10.1371/journal.pgen.0030161. [DOI] [PMC free article] [PubMed] [Google Scholar]
- 23.Lipska BK, et al. Critical factors in gene expression in postmortem human brain: Focus on studies in schizophrenia. Biol. Psychiatry. 2006;60:650–658. doi: 10.1016/j.biopsych.2006.06.019. [DOI] [PubMed] [Google Scholar]
- 24.Zhang Y, et al. Systematic analysis, comparison, and integration of disease based human genetic association data and mouse genetic phenotypic information. BMC Med. Genomics. 2010;3:1. doi: 10.1186/1755-8794-3-1. [DOI] [PMC free article] [PubMed] [Google Scholar]
- 25.De S, Zhang Y, Garner JR, Wang SA, Becker KG. Disease and phenotype gene set analysis of disease based gene expression in mouse and human. Physiol. Genomics. 2010;42A:162–167. doi: 10.1152/physiolgenomics.00008.2010. [DOI] [PMC free article] [PubMed] [Google Scholar]
- 26.Daniel VC, et al. A primary xenograft model of small-cell lung cancer reveals irreversible changes in gene expression imposed by culturein vitro. Cancer Res. 2009;69:3364–3373. doi: 10.1158/0008-5472.CAN-08-4210. [DOI] [PMC free article] [PubMed] [Google Scholar]
- 27.Schaeffer EM, et al. Androgen-induced programs for prostate epithelial growth and invasion arise in embryogenesis and are reactivated in cancer. Oncogene. 2008;27:7180–7191. doi: 10.1038/onc.2008.327. [DOI] [PMC free article] [PubMed] [Google Scholar]
Associated Data
This section collects any data citations, data availability statements, or supplementary materials included in this article.