

Background: Cytokine secretion has unwanted consequences in malignant and in inflammatory disorders. The deacetylase SIRT6 has pro-inflammatory activity, but the underlying mechanisms and its biological significance remain unclear.
Results: SIRT6 enhances cytokine secretion and cell motility in pancreatic cancer cells by activating Ca2+ signaling.
Conclusion: SIRT6 promotes Ca2+-dependent responses.
Significance: SIRT6 inhibitors may help combat malignant and inflammatory disorders.
Keywords: Cancer, Inflammation, NAD, Signaling, Sirtuins, Cytokines
Abstract
Cytokine secretion by cancer cells contributes to cancer-induced symptoms and angiogenesis. Studies show that the sirtuin SIRT6 promotes inflammation by enhancing TNF expression. Here, we aimed to determine whether SIRT6 is involved in conferring an inflammatory phenotype to cancer cells and to define the mechanisms linking SIRT6 to inflammation. We show that SIRT6 enhances the expression of pro-inflammatory cyto-/chemokines, such as IL8 and TNF, and promotes cell migration in pancreatic cancer cells by enhancing Ca2+ responses. Via its enzymatic activity, SIRT6 increases the intracellular levels of ADP-ribose, an activator of the Ca2+ channel TRPM2. In turn, TRPM2 and Ca2+ are shown to be involved in SIRT6-induced TNF and IL8 expression. SIRT6 increases the nuclear levels of the Ca2+-dependent transcription factor, nuclear factor of activated T cells (NFAT), and cyclosporin A, a calcineurin inhibitor that reduces NFAT activity, reduces TNF and IL8 expression in SIRT6-overexpressing cells. These results implicate a role for SIRT6 in the synthesis of Ca2+-mobilizing second messengers, in the regulation of Ca2+-dependent transcription factors, and in the expression of pro-inflammatory, pro-angiogenic, and chemotactic cytokines. SIRT6 inhibition may help combat cancer-induced inflammation, angiogenesis, and metastasis.
Introduction
The relationship between inflammation and carcinogenesis has been known for many years (1). Chronic inflammation is a risk factor for cancer development. In addition, even in those cancers that do not develop in inflamed tissues, an inflammatory component is usually observed, and it is now known to be an essential part of the malignant microenvironment (2, 3). Inflammation contributes to tumorigenesis and cancer progression by supplying growth factors that sustain cancer cell proliferation and/or survival, proangiogenic factors, extracellular matrix-modifying enzymes that promote invasion and metastasis, and signals that lead to epithelial-mesenchymal transition (2, 4, 5). Moreover, increased circulating levels of pro-inflammatory cytokines are responsible for systemic manifestations of disease, such as cachexia, fever, and sweats (6–9). Among other forms of cancer, pancreatic ductal adenocarcinoma (PDAC)2 is well known for its propensity to secrete high levels of pro-inflammatory factors that contribute to its clinical aggressiveness and to its metastatic potential (10). The mechanisms controlling cyto-/chemokine production by inflammatory and cancer cells are only partially understood. A more detailed understanding of the molecular pathways leading to cancer-associated inflammation may lead to new therapeutic strategies with a strong impact on patient quality of life.
Previous studies showed that intracellular nicotinamide adenine dinucleotide (NAD+) levels influence the capacity of inflammatory cells to secrete cytokines, such as tumor necrosis factor α (TNF), interleukin 6 (IL6), IL1β, interferon γ (IFN-γ), IL2, and IL8 (11–15). In line with these findings, the NAD+-lowering agent FK866 (a nicotinamide phosphoribosyltransferase inhibitor) was shown to have anti-inflammatory activity in mouse models of experimental autoimmune encephalomyelitis, arthritis, polymicrobial sepsis, and heart ischemia (11–13, 15). The mechanisms through which NAD+ promotes inflammation have been partially elucidated, leading to the definition of several new targets that are suitable for therapeutic interventions. These include CD38, a multifunctional enzyme that generates Ca2+-mobilizing second messengers (such as cyclic ADP-ribose, ADP-ribose (ADPr), and nicotinic acid-adenine dinucleotide phosphate) (16–19); TRPM2 (transient receptor potential cation channel, subfamily M, member 2), an ADPr-gated channel that is responsible for Ca2+ responses, immune gene expression, and immunity to pathogens (20, 21); and poly(ADP-ribose) polymerases that contribute to inflammation by enhancing mitogen-activated protein kinase (MAPK) signaling (16). In addition, the enzyme poly(ADP-ribose) glycohydrolase can degrade poly-(ADP-ribose) (22), making available the Ca2+-mobilizing second messenger ADPr.
Recently, the involvement of a third type of NAD+-degrading enzymes, the sirtuins, in immune responses has also been suggested (23). One of the sirtuin members, sirtuin 6 (SIRT6), was shown to be involved in TNF, IFN-γ, and IL8 production by immune cells (11, 12, 15). The mechanism whereby SIRT6 promotes the synthesis of these cytokines remains unclear, although, in the case of TNF, it was proposed that SIRT6 may regulate the efficiency by which Tnf mRNA is translated (11). Initially identified as a mono-ADP-ribosyltransferase (24), SIRT6 was subsequently shown to also possess NAD+-dependent deacetylase activity, similar to other sirtuin members (25). However, purified SIRT6 produces O-acetyl-ADPr (OAADPr), the product of sirtuin-mediated deacetylations, at a much slower pace as compared with other active sirtuins, raising the questions of whether SIRT6 deacetylase activity is actually relevant in biological contexts (26). SIRT6 was shown to have a role in telomere stability, DNA repair, and metabolic homeostasis (25, 27–29), and its deficiency was shown to predispose to genomic instability and premature aging in the mouse (27). Interestingly, this phenotype was characterized, among other aspects, by a profound lymphopenia, which is consistent with a role for SIRT6 in immunity.
In this study, we investigated the role of SIRT6 in PDAC cell capability to produce pro-inflammatory cytokines. In doing so, we identified a novel role for this sirtuin in NAD+- and Ca2+-dependent signaling and, consequently, in immune gene expression and cell migration. Our results support the use of SIRT6 as a target to modify cancer cell pro-inflammatory phenotype and migratory propensity.
EXPERIMENTAL PROCEDURES
Cell Lines and Reagents
BxPC-3 and Phoenix were purchased from ATCC (LGC Standards S.r.l., Milan, Italy). Both cell lines were maintained in RPMI1640 medium supplemented with 10% FBS, penicillin (50 units/ml), and streptomycin (50 μg/ml) (Lonza Milano S.r.l., Treviglio, Italy). EGTA-AM, EDTA, Hanks' balanced salt solution (HBSS), puromycin, phorbol 12-myristate 13-acetate (PMA), protamine sulfate, nicotinic acid, pefabloc, protease inhibitor mixture, and benzonase nuclease were purchased from Sigma-Aldrich. Sirtinol was obtained from Tocris Bioscience (Bristol, UK). Recombinant IL8 was from R&D Systems (Minneapolis, MN) or from Sigma-Aldrich. FK866 was generously provided by the National Institute of Mental Health Chemical Synthesis and Drug Supply Program.
Plasmids
Empty pRETROSUPER (pRS), pNF-κB-Luc, and SV40-Renilla were from Dr. Thijn Brummelkamp (Netherlands Cancer Institute, Amsterdam, The Netherlands); pRS SIRT6 sh2, pBP SIRT6 WT, and pBP SIRT6 H133Y were a kind gift from Dr. Katrin F. Chua (Department of Medicine, Stanford University School of Medicine, Stanford, CA). Empty pBABEPURO (pBP), SIRT1-puro (pYESir2-puro), and SIRT1H363Y-puro (pYESir2HY-puro) were purchased from Addgene (Cambridge, MA).
Retroviral Transduction
For retroviral transduction, 1.5 × 10⁶ Phoenix cells were plated in 4 ml of medium in 6-cm dishes and allowed to adhere for 24 h. Thereafter, cells were transfected with 4 μg of plasmid DNA using TransIT-293 (Mirus Bio, Madison, WI) according to the manufacturer's instructions. Viral supernatants were harvested after 36, 48, and 60 h and used to infect BxPC-3 cells (5 × 10⁵) in 10-cm dishes in the presence of 5 μg/ml protamine sulfate. Successfully infected cells were selected using 1.5 μg/ml puromycin.
Immunoblotting
Nuclear proteins were extracted from 4 × 10⁶ cells as described before (30). Protein concentration was determined according to Bradford. Proteins (25 μg) were separated by SDS-PAGE, transferred to a PVDF membrane (Immobilon-P, Millipore S.p.A., Vimodrone, Italy), and visualized with the following antibodies: anti-SIRT6 (S4197), anti-acetyl-histone H3 lysine 9 (H3K9; H9286) (Sigma-Aldrich), and anti-histone H3 antibody (9715; Cell Signaling Technology, Danvers, MA).
ELISA for IL8 and TNF Detection
pBP, SIRT6 WT, SIRT6 H133Y, pRS, and sh2 SIRT6 BxPC-3 cells (3 × 10⁵ cells/well) were seeded in 6-well plates and allowed to adhere for 24 h. To induce cytokine expression, cells were stimulated for 48 h with PMA. Thereafter, supernatants were collected and assayed for IL8 and TNF using commercially available DuoSet® ELISA kits (R&D Systems, Minneapolis, MN). Cytokine concentrations in supernatants were normalized to cell density as measured with sulforhodamine B (31).
Gene Expression Array
0.4 μg of cDNA was mixed with TaqMan® Universal PCR Master Mix and loaded in duplicate on a TaqMan® human immune array microfluidic card (4370573, Applied Biosystems by Invitrogen), and qPCR was run as described. Gene expression was normalized to housekeeping gene expression (GAPDH, ACTB, or 18S).
qPCR
Total RNA was extracted from cells using the RNeasy minikit (Qiagen S.r.l., Milan, Italy) according to the manufacturer's instructions. 1 μg of RNA was reverse transcribed in a final volume of 50 μl using the High Capacity cDNA Reverse Transcription kit (Invitrogen). 5 μl of the resulting cDNA was used for qPCR with a 7900 HT Fast real-time PCR system (Applied Biosystems by Invitrogen) using TaqMan® Gene Expression Assays for human IL8 (Hs99999034_m1), TNF (Hs00174128_m1), RPLP0 (Hs99999902_m1), and GAPDH (Hs99999905_m1) and murine Cxcl1 (Mm01354329_g1), Cxcl2 (Mm00436450_ m1), Tnf (Mm00443258_m1), and Hprt1 (Mm01545399_m1) and TaqMan® Universal PCR Master Mix (Invitrogen).
qPCR for TRPM2 (forward, 5′-GTCTTCCACCTGAACATCCTCTCC-3′; reverse, 5′-CCGCATCTCCTCGCACACC-3′) and SIRT6 (forward, 5′-CCTCCTCCGCTTCCTGGTC-3′; reverse, 5′-GTCTTACACTTGGCACATTCTTCC-3′) was performed using GoTaq® qPCR Master Mix (Promega Italia S.r.l., Milan, Italy) according to the manufacturer's protocol. Gene expression was normalized to housekeeping gene expression (GAPDH or RPLP0). Comparisons in gene expression were calculated using the 2−ΔΔCt method.
Determination of Intracellular NAD+ Levels
BxPC-3 cells were plated at a density of 3 × 10⁵ cells/well in 6-well plates and cultured in the presence or absence of 100 nm FK866, with or without 1 mm nicotinic acid. Then cells were harvested and lysed in 0.1 ml of 0.6 m perchloric acid at 4 °C. Cell extracts were centrifuged for 3 min at 16,000 × g, the supernatants were collected, and an aliquot was diluted 200-fold in 100 mm sodium phosphate buffer, pH 8.0, for determination of NAD+ content, as described (32). NAD+ values were normalized to protein concentrations, determined by Bradford assay.
Ca2+ Deprivation Experiments
BxPC-3 cells were seeded at a density of 3 × 10⁵ cells/well in 12-well plates, allowed to adhere, and serum-starved overnight. Then cells were preincubated for 30 min with or without the cell-permeable intracellular Ca2+ chelator EGTA-AM (50 μm in PBS). Thereafter, EGTA-AM was removed, and cells were washed twice with PBS and then incubated for 1 h with or without 25 ng/ml PMA in HBSS. Control cells were incubated for 1 h with or without 25 ng/ml PMA in HBSS. Alternatively, cells were incubated in Ca2+-free HBSS with 0.2 mm EDTA for 1 h in the presence or absence of 25 ng/ml PMA. Afterward, cells were harvested, and RNA was extracted for qPCR analysis.
Fluorimetric Determination of Intracellular Ca2+ Levels
pBP, SIRT6 WT, SIRT6 H133Y, pRS, and sh2 SIRT6 BxPC-3 cells (1 × 10⁵ cells/well) were seeded on glass bottom cell culture dishes (Greiner Bio-One, Frickenhausen, Germany) and incubated for 48 h in the presence or absence of 25 ng/ml PMA. Cells were then incubated with Fura-2AM for 45 min and washed with HBSS. HBSS was added to Fura-2-loaded cells, and [Ca2+]i measurements and calibrations were performed with a microfluorimetric system (Cairn Research, Faversham, Kent, UK).
Production and Purification of [14C]ADPr
[14C]ADPr was produced and purified as described (14). Briefly, [14C]NAD+ was incubated with NAD+-ase (Sigma-Aldrich) and the enzyme was then removed by filtration. The incubation was subjected to an analytical phosphate HPLC analysis, performed on a C18, 150 × 4-mm, 5-μm column (Waters, Milano, Italy), using the same conditions (buffers, gradient, and flow rate) as described previously (33). Fractions were collected every minute, and the radioactive fraction (eluting at the same time as standard ADPr) was collected, dried, resuspended in water, and used as tracer in the determination of intracellular ADPr content.
Determination of the Intracellular ADPr Content
pBP, SIRT6 WT, SIRT6 H133Y, pRS, and sh2 SIRT6 BxPC-3 cells (1 × 10⁷) were recovered and centrifuged for 5 min at 300 × g. Cell pellets were lysed in 0.2 ml of 5% trichloroacetic acid at 4 °C. Cell extracts were centrifuged for 3 min at 16,000 × g; the supernatants were collected and neutralized with diethyl ether extractions. [14C]ADPr (10,000 cpm) was added to the extracts, and the intracellular ADPr content was determined as described (14). Briefly, samples were injected into a first HPLC analysis, using a PL-SAX column (solvent A was 0.02 m NH4HCO3, pH 7.5, and solvent B was 0.5 m NH4HCO3, pH 7.5). Fractions were collected every minute, and the radioactive fraction (the ADPr elution time was 14.5 min) was dried, resuspended in 0.25 ml of water, and subjected to the analytical phosphate HPLC analysis described above (the ADPr elution time was 30 min).
siRNA Transfection
Transient transfection of BxPC-3 cells was performed using the HiPerFect transfection reagent (Qiagen). The day of transfection, cells were trypsinized after reaching 60–80% confluence and were seeded at a density of 2 × 10⁵ cells/well in 12-well plates. The siRNA targeting human TRPM2 (StealthTM Select RNAi OligoID: HSS110995, Invitrogen), SIRT1, GATA4 (both from siGENOME SMARTpool, Dharmacon Inc.), or the negative control siRNA (scr) (StealthTM Negative Control) were diluted (100 nm) in 100 μl of Opti-MEM® I reduced serum medium (Invitrogen) and incubated for 10 min at room temperature with 6 μl of HiPerFect transfection reagent. The transfection mixture was added dropwise onto the cells to a final concentration of 10 nm siRNA/well. 24 h after transfection, cells were serum-starved overnight and then stimulated for 1 h with 25 ng/ml PMA. Afterward, cells were collected, and RNA was isolated for qPCR analysis of IL8 and TNF as described before.
Chemotaxis
pBP, SIRT6 WT, SIRT6 H133Y, pRS, and sh2 SIRT6 BxPC-3 cells were resuspended at a density of 6 × 10⁵ cells/ml in chemotaxis buffer (RPMI1640 medium containing 1% albumin). Chemotaxis assays were performed using 96-well ChemoTx system microplates (Neuro Probe, Inc., Gaithersburg, MD) with a fibronectin-coated 8-μm pore size polycarbonate filter. PMA (100 ng/ml, final concentration) and IL8 (10 ng/ml, final concentration) were diluted in chemotaxis buffer and added in the bottom wells. Cell suspensions (25 μl) were placed directly on top of the filter, and the plates were incubated for 4 h at 37 °C. The transmigrated cells were collected following ChemoTx system instructions, transferred into a 96-well plate, and quantified by adding 60 μl of a solution composed of 0.2% Nonidet P-40 and 1 μm SYTOX Green. After 20 min of incubation at 37 °C, fluorescence was recorded (excitation, 485 nm; emission, 520 nm) with a fluorescence plate reader (Fluostar Optima, BMG Labtechnologies GmbH, Offenburg, Germany). A standard curve was obtained by placing a serial dilution of the cell suspension in the bottom wells. The results were expressed as the chemotaxis index (number of cells migrated toward chemoattractant/number of cells migrated toward medium).
cAMP/Ca2+-dependent Transcription Factor Array
pBP, SIRT6 WT, pRS, and sh2 SIRT6 BxPC-3 cells (8 × 10⁶ cells/dish) were seeded onto 100-mm cell culture dishes and allowed to adhere for 24 h. Cells were incubated with PMA (25 ng/ml) for 45 min in complete RPMI1640 medium. Cells were then lysed, and nuclear extracts were prepared with the nuclear extraction kit, according to the manufacturer's instructions (Panomics, Vignate, Milan, Italy). Nuclear extracts were analyzed with the cAMP/Ca2+ protein/DNA array (Panomics). Membranes were treated according to the manufacturer's instructions; positive spot detection and densitometry were performed using a Chemi-Doc system (Bio-Rad).
Mice
All mouse experiments were performed in accordance with the relevant laws and institutional guidelines for animal care and use following approval by the Institutional Animal Care and Use Committee of the Advanced Biotechnology Center (Genoa, Italy). For the generation of bone marrow-derived dendritic cells (BMDCs), bone marrow was recovered from femurs and tibiae of 2-week-old wild type (WT) and Sirt6KO mice (27).
Reporter Assays for NF-κB Activity
Cells were plated in 24-well plates, allowed to adhere overnight, and subsequently transfected with 0.5 μg of NF-κB-Luc and 1 ng of SV40-Renilla vectors. 24 h after transfection, cells were stimulated with 25 ng/ml PMA. Luciferase activity was measured 39 h after transfection using the Dual-Luciferase Reporter Assay System (Promega Italia) according to the manufacturer's instructions. The luciferase signal was normalized to the Renilla signal and, subsequently, to the values obtained in unstimulated control cells and expressed as relative luciferase units.
Purification and Analysis of BMDCs
We generated BMDCs by culturing bone marrow precursors in granulocyte macrophage-colony stimulating factor (GM-CSF) (Miltenyi Biotec, Bologna, Italy)-supplemented medium as described previously (34). Dendritic cell purity was analyzed by flow cytometry (FACSCanto, BD Biosciences) using anti-mouse APC-conjugated CD11c antibody (Biolegend). Isolated BMDCs were CD11c+ (>70%). At day 7, BMDCs (106 cells/ml) were stimulated with 1 μg/ml CpG (TIB MOLBIOL, Genoa, Italy) for 2, 4, 6, or 24 h. Thereafter, cells were harvested, and total RNA was extracted for qPCR analysis.
Gene Expression Analysis from Microarray Data Sets
Data sets GSE15471, GSE16515 (Affymetrix U133 Plus 2.0 array) (35, 36), and GSE1542 (Affymetrix U133 B array) (37) were downloaded from the Gene Expression Omnibus Repository and imported into Partek Genomics Suite 6.6 (Partek Inc., St. Louis, MO). Probe sets were annotated according to human genome assembly GRCh37.p8. In the case of multiple probe sets for SIRT6 (Affymetrix U133 Plus 2.0), only the one exhibiting the widest variance was retained. Before merging data, expression values from normal and cancer samples in each data set were transformed into Z-scores, as follows: (SIRT6/1value − SIRT6/1average)/SIRT6/1S.D.. Z-Scores were then loaded into R version 2.14.1 (copyright 2011, R Foundation for Statistical Computing) for further analysis and graph generation. Levene's test was used to test the equality of variance in cancer versus normal samples, whereas comparison of means was performed using Welch's test. All tests were two-tailed.
Statistical Analysis
All data are represented as mean ± S.D. of at least three independent duplicate experiments. Statistical analyses were performed with GraphPad Prism software version 5 (GraphPad Software) using one-way ANOVA for multiple-group comparison or unpaired t test for two-group comparison. p values below 0.05 were considered significant.
RESULTS
SIRT6, but Not SIRT1, Promotes the Expression of Inflammatory Cytokines in Pancreatic Cancer Cells
We and others have previously reported a role for SIRT6 in the regulation of TNF, IFN-γ, and IL8 expression in immune cells (11, 12, 15). In order to investigate a possible role of SIRT6 in the production of pro-inflammatory cytokines by PDAC cells, we engineered the PDAC cell line BxPC-3 to stably overexpress WT SIRT6 or the empty vector pBP (Fig. 1A) (38). In addition, we generated BxPC-3 cells where SIRT6 expression was reduced with a validated RNA interference construct (sh2 SIRT6) (Fig. 1B) (25). We stimulated these cell lines with PMA and monitored the induction of a panel of 93 immune genes using commercially available low density arrays. With this approach, we were able to identify a pool of genes whose expression was likely to be promoted by SIRT6 because it was higher in SIRT6-overexpressing cells and lower in SIRT6-silenced cells as compared with the respective controls (Fig. 1C). Among these genes were those encoding for the cytokines TNF, IL1α, IL6, IL8, and colony-stimulating factor 1 (CSF1) but also for the co-stimulation molecule CD40. In the subsequent experiments, we decided to focus on the role of SIRT6 in TNF and IL8 production by PDAC cells because these were influenced by SIRT6 level modifications to the highest extent. In addition, TNF and IL8 are frequently highly expressed by primary PDACs and are thought to play a role in PDAC pathogenesis and clinical manifestations (4, 39–43).
FIGURE 1.
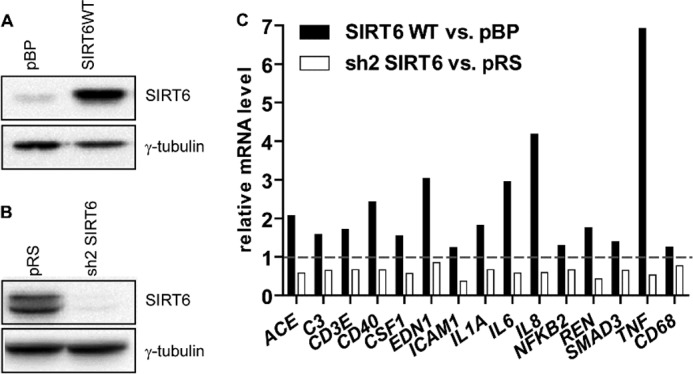
SIRT6 regulates cytokine expression in pancreatic cancer cells. BxPC-3 cells were engineered by retroviral transduction to express SIRT6 WT (A) or sh2 SIRT6 (B) or the respective empty vector pBP or pRS, and protein extracts were analyzed by immunoblotting for SIRT6 levels (one representative experiment of three is shown). C, these cell lines were stimulated for 48 h with 25 ng/ml PMA and analyzed for the induction of a panel of 93 immune genes using commercially available gene expression arrays. 15 of 93 genes were identified to be differently regulated in SIRT6-expressing or -silenced cells. mRNA levels were measured by qPCR and quantified versus the GAPDH housekeeping gene. Indicated is the -fold increase/decrease versus vector cells calculated by the 2−ΔΔCt method.
In follow-up experiments, we confirmed that SIRT6 overexpression increased TNF and IL8 production at the mRNA and at the protein level (Fig. 2, B and C). In agreement with these findings, SIRT6 silencing blunted TNF and IL8 production at both messenger and protein level (Fig. 3). To assess whether SIRT6 enzymatic activity was required for its capacity to promote TNF and IL8 expression, we engineered BxPC-3 cells with a catalytically inactive SIRT6 isoform (SIRT6 H133Y) (24) and monitored TNF and IL8 mRNA and protein expression in basal conditions and in response to PMA, which was previously shown to potently stimulate the synthesis of these two cytokines (44, 45). Overexpression of WT SIRT6, but not of SIRT6 H133Y, reduced the acetylation level of H3K9, a substrate of SIRT6 deacetylase activity (Fig. 2A). As compared with SIRT6 H133Y, WT SIRT6 increased TNF and IL8 expression to a much greater extent both in unstimulated and in PMA-stimulated cells, thus showing that SIRT6 enzymatic activity is crucial for its capacity to promote cytokine production (Fig. 2, B and C). The increased levels of TNF and IL8 mRNA that we detected in SIRT6-overexpressing cells could reflect increased gene expression or enhanced mRNA stability. To rule out one of these possibilities, we treated control and SIRT6-overexpressing BXPC-3 cells with actinomycin D to inhibit transcription. In both cell types, IL8 and TNF mRNA induction by PMA was virtually abolished by this inhibitor (data not shown), suggesting that enhanced gene transcription was responsible for the increased levels of cytokines produced in response to SIRT6 activity.
FIGURE 2.

SIRT6 overexpression leads to increased cytokine expression in pancreatic cancer cells. BxPC-3 cells were engineered by retroviral transduction to express SIRT6 WT, SIRT6 H133Y, or pBP. A, thereafter, nuclear protein extracts were analyzed by immunoblotting for SIRT6, acetyl-H3K9, and histone H3 levels (one representative experiment of three is shown). B, BxPC-3 cells were incubated for 48 h in the presence or absence of 25 ng/ml PMA. IL8 and TNF concentrations in supernatants were detected by ELISA. Data are expressed as mean ± S.D. (error bars) (n = 3). p values were calculated using one-way ANOVA for SIRT6 WT or SIRT6 H133Y versus vector control cells pBP (with or without PMA) (***, p < 0.0005; **, p < 0.005; *, p < 0.05; ns, p > 0.05) or for SIRT6 WT versus SIRT6 H133Y (with or without PMA) (###, p < 0.0005; #, p < 0.05). C, IL8 and TNF mRNA levels were measured by qPCR and quantified versus the RPLP0 housekeeping gene. Indicated is the -fold increase versus untreated pBP cells calculated by the 2−ΔΔCt method. Data are represented as mean ± S.D. (n = 3). p values were calculated using one-way ANOVA for SIRT6 WT or SIRT6 H133Y versus pBP (with or without PMA) (***, p < 0.0005; **, p < 0.005; ns, p > 0.05) or for SIRT6 WT versus SIRT6 H133Y (with or without PMA) (###, p < 0.0005).
FIGURE 3.

SIRT6 silencing reduces cytokine expression in PDAC cells. BxPC-3 cells were engineered by retroviral transduction to express SIRT6 shRNA sh2 or the empty vector pRS. A, nuclear protein extracts were analyzed by immunoblotting for SIRT6, acetyl-H3K9, and histone H3 levels (one representative experiment of three is shown). B, BxPC-3 cells were incubated for 48 h with 25 ng/ml PMA. IL8 and TNF concentrations in supernatants were detected by ELISA. Data are expressed as mean ± S.D. (error bars) (n = 4). p values were calculated using an unpaired t test for sh2 SIRT6 versus vector control cell pRS (***, p < 0.0005). C, IL8 and TNF mRNA levels were measured by qPCR and quantified versus the RPLP0 housekeeping gene. Indicated is the -fold increase versus untreated pBP cells calculated by the 2−ΔΔCt method. Data are represented as mean ± S.D. (n = 3). p values were calculated using an unpaired t test for sh2 SIRT6 versus vector control cell pRS (***, p < 0.0005).
In subsequent experiments, we sought to confirm the role of SIRT6 in cytokine expression in a different mammalian model. To this end, we generated BMDCs from wild type and Sirt6KO mice, stimulated them with CpG, and monitored the expression of Tnf and of Cxcl1 and Cxcl2 (mouse functional homologs of human IL8). Consistent with what was observed in human cells, Sirt6 deficiency was associated with impaired Tnf, Cxcl1, and Cxcl2 mRNA induction upon stimulation (Fig. 4).
FIGURE 4.

Sirt6KO mouse dendritic cells exhibit defective cytokine expression. 6 × 10⁶ WT or Sirt6KO BMDCs/well were plated in 6-well plates and stimulated with or without 1 μg/ml CpG for the indicated time period. Thereafter, cells were harvested, washed, and used for RNA isolation. Cxcl1 (A), Cxcl2 (B), Tnf (C), and Hprt1 (housekeeping) expression were determined by qPCR. One representative experiment of three is presented. Error bars, S.D.
Finally, we aimed at assessing whether the propensity of SIRT6 to enhance cytokine expression would also extend to other sirtuins. To this aim, WT and catalytically inactive (H363Y) SIRT1 were expressed in BXPC-3 cells (Fig. 5A). Cells overexpressing WT SIRT1 but not SIRT1 H363Y showed reduced TNF mRNA levels in base-line conditions and in response to PMA stimulation (Fig. 5B). In line with these findings, SIRT1 silencing, as obtained with specific siRNAs, resulted in increased TNF mRNA induction in response to PMA (Fig. 5, C and D). These findings are consistent with previous evidence of an anti-inflammatory function for SIRT1 (46, 47) and indicate that SIRT6 pro-inflammatory activity is not shared by all sirtuins.
FIGURE 5.
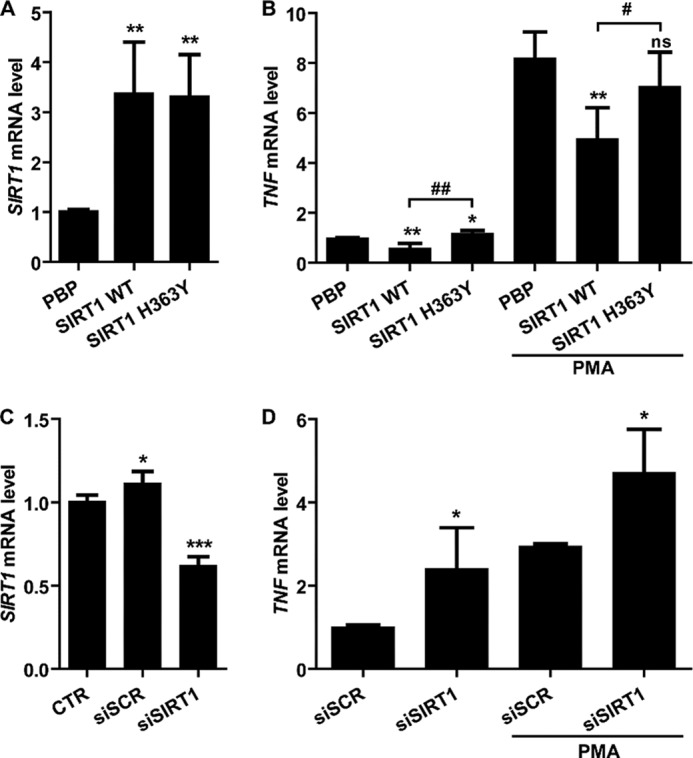
SIRT1 reduces TNF expression in PDAC cells. A and B, BxPC-3 cells were engineered by retroviral transduction to express SIRT1 WT, SIRT1 H363Y, or pBP. Cells were stimulated with or without 25 ng/ml PMA for 48 h and subsequently used for RNA extraction. SIRT1 (A) and TNF levels (B) were determined by qPCR. C and D, BxPC-3 cells were transfected with or without (CTR) SIRT1-specific siRNAs (siSIRT1) or with scrambled siRNAs (siSCR) as a control. Thereafter, cells were stimulated with or without PMA for 48 h and subsequently used for RNA extraction. SIRT1 (C) and TNF levels (D) were determined by qPCR. p values were calculated by unpaired t test versus control cells (A and B, pBP; C, CTR; D, siSCR) (***, p < 0.0005; **, p < 0.005; *, p < 0.05; ns, p > 0.05) or versus SIRT1 H363Y for SIRT1 WT cells (B) (##, p < 0.005; #, p < 0.05). Error bars, S.D.
Sirtuin Inhibition and the NAD+-lowering Drug FK866 Reduce Cytokine Secretion in PDAC Cells
Because SIRT6 relies on NAD+ availability for its enzymatic activity, we assessed whether depleting intracellular NAD+ would affect IL8 and TNF synthesis in BxPC-3 cells. To this end, FK866 was used to block nicotinamide phosphoribosyltransferase, the enzyme that, together with NMNAT, is responsible for NAD+ synthesis from nicotinamide (48). In addition, the effect of the pan-sirtuin inhibitor sirtinol on cytokine secretion was evaluated. Intracellular NAD+ content was strongly reduced in BxPC-3 cells after a 48-h incubation with FK866, whereas the addition of nicotinic acid rescued NAD+ depletion through an alternative biosynthesis pathway (49) (Fig. 6A). BxPC-3 cell treatment with FK866 significantly reduced PMA-induced IL8 and TNF expression and secretion (Fig. 6, B and C). However, concomitant nicotinic acid administration restored cytokine expression at control levels (Fig. 6, B and C). Treatment with sirtinol also lowered IL8 and TNF synthesis, both at the mRNA and protein level (Fig. 6, B and C). These results suggest that pharmacological approaches targeting the nicotinamide phosphoribosyltransferase-SIRT6 axis may be useful for reducing cytokine secretion by PDACs.
FIGURE 6.

NAD+ depletion and sirtuin inhibition reduce cytokine expression in PDAC cells. A, BxPC-3 cells were treated for 48 h with or without 100 nm FK866 in the presence or absence of 1 mm nicotinic acid (Na). Cells were harvested and lysed in 0.6 m perchloric acid, and NAD+ content was measured in neutralized extracts. NAD+ values were normalized to protein content. Data are expressed as mean ± S.D. (error bars) (n = 3). p values were calculated versus untreated control cells (NT) using one-way ANOVA (***, p < 0.0005; ns, p > 0.05). B, BxPC-3 cells were preincubated for 24 h with 100 nm FK866 with or without 1 mm nicotinic acid, and then 50 μm sirtinol and 25 ng/ml PMA were added where indicated and incubated for a further 48 h. IL8 and TNF concentrations in supernatants were detected by ELISA. Data are expressed as mean ± S.D. (n = 4). p values were calculated versus PMA-treated control cells using one-way ANOVA (***, p < 0.0005; **, p < 0.005; ns, p > 0.05). C, IL8 and TNF mRNA levels were measured by qPCR and quantified versus the RPLP0 housekeeping gene. Indicated is the -fold increase versus untreated cells calculated by the 2−ΔΔCt method. Data are represented as mean ± S.D. (n = 3). p values were calculated versus PMA-treated cells using one-way ANOVA (***, p < 0.0005; ns, p > 0.05).
Cytokine Induction by SIRT6 Relies on a Ca2+-dependent Mechanism
Cytokine expression in response to mitogenic stimulation depends, at least in part, on increases in intracellular Ca2+ concentration (20). To assess the relevance of Ca2+ signaling in IL8 and TNF production by PDAC cells, we incubated BxPC-3 cells with the Ca2+ chelator EGTA-AM, which sequesters intracellular Ca2+, or with EDTA to remove extracellular Ca2+ and subsequently stimulated the cells with PMA. Both Ca2+-chelating agents completely blocked PMA-induced IL8 and TNF mRNA induction (Fig. 7A).
FIGURE 7.

SIRT6 regulates Ca2+ responses and cell migration in PDAC cells. A, serum-starved BxPC-3 cells were preincubated for 30 min with 50 μm EGTA-AM, and then cells were washed twice with PBS and treated for 1 h with 25 ng/ml PMA in HBSS; alternatively, cells were incubated in the presence or absence of 25 ng/ml PMA in Ca2+-free HBSS with 0.2 mm EDTA. Data are expressed as mean ± S.D. (n = 3). p values were calculated versus untreated control cells (NT) using one-way ANOVA (***, p < 0.0005). B and C, pBP, SIRT6 WT, SIRT6 H133Y, pRS, and sh2 SIRT6 BxPC-3 cells were seeded on glass bottom cell culture dishes and incubated for 48 h in the presence or absence of 25 ng/ml PMA. Cells were then loaded with Fura-2AM, and [Ca2+]i measurements and calibrations were performed with a microfluorimetric system. Data are shown as mean ± S.D. (error bars) (n = 3). p values were calculated using one-way ANOVA (B) or unpaired t test (C) versus corresponding untreated cells (NT) (***, p < 0.0005; **, p < 0.005; *, p < 0.05; ns, p > 0.05) or for PMA-treated SIRT6 WT versus pBP or versus SIRT6 H133Y (###, p < 0.0005). D and E, pBP, SIRT6 WT, SIRT6 H133Y, pRS, and sh2 SIRT6 BxPC-3 cells were resuspended in chemotaxis buffer, and chemotaxis assays were performed with PMA (100 ng/ml) or IL8 (10 ng/ml) as chemoattractants as described under “Experimental Procedures.” Transmigrated cells were collected and quantified by a fluorimetric assay, and the chemotaxis index (CI) was determined. Data are expressed as mean ± S.D. (n = 3). p values were calculated using one-way ANOVA (D) or unpaired t test (E) versus vector control cells (D, pBP; E, pRS) (**, p < 0.005; *, p < 0.05; ns, p > 0.05) or for SIRT6 WT versus SIRT6 H133Y cells (##, p < 0.005; #, p < 0.05).
Given the importance of Ca2+ signaling in IL8 and TNF production, we assessed whether SIRT6 expression would affect the intracellular Ca2+ concentration ([Ca2+]i) in cells stimulated for 48 h with PMA. PMA increased [Ca2+]i in pBP, SIRT6 WT, and SIRT6 H133Y BxPC-3. However, the PMA-induced [Ca2+]i increase observed in cells overexpressing WT SIRT6 was higher than those in vector-bearing cells and in cells expressing catalytically inactive SIRT6 (Fig. 7B). In addition, PMA increased [Ca2+]i in pRS cells but not in cells where SIRT6 had been knocked down by RNAi (Fig. 7C). These results indicated that SIRT6, through its enzymatic activity, enhances Ca2+ responses in PDAC cells and thus suggested a suitable mechanism for the capability of this sirtuin member to promote cytokine secretion.
In addition to favoring the expression of inflammatory cytokines, Ca2+ is a critical regulator of cell migration in different cell types, including cancer cells (50). To further explore if the increased Ca2+ responses observed in PMA-stimulated SIRT6-overexpressing cells would also confer increased propensity to migrate, we performed chemotaxis assays using PMA or IL8 as a chemoattractant. Indeed, BxPC-3 cells expressing WT SIRT6 showed increased capacity to migrate toward these stimuli as compared with vector and SIRT6 H133Y cells (Fig. 7D). Vice versa, SIRT6 silencing completely abrogated BxPC-3 cell migration toward PMA and IL8 (Fig. 7E).
SIRT6 Regulates the Intracellular Levels of the Second Messenger ADPr
By virtue of its deacetylase activity, sirtuins convert NAD+ to nicotinamide and OAADPr (51–53). OAADPr, either as such or upon conversion to ADPr, is a ligand of the cation channel TRPM2 (54–56), which, in turn, was shown to promote Ca2+ influx and chemokine production in human and murine leukocytes (20). Thus, we hypothesized that SIRT6 enzymatic activity could promote Ca2+ responses and cytokine secretion by increasing the intracellular concentration of ADPr. By using an HPLC-based method, we measured the intracellular concentration of ADPr in BxPC-3 cells engineered to express different amounts of SIRT6 or SIRT6 H133Y. WT SIRT6-overexpressing BxPC-3 cells contained higher amounts of ADPr as compared with the vector control cells and compared with the SIRT6 H133Y-expressing cells (Fig. 8A). In line with these findings, SIRT6-silenced cells contained lower ADPr concentrations than their control cells (Fig. 8B). Therefore, these experiments confirmed that SIRT6 regulates the intracellular ADPr concentration through its catalytic activity.
FIGURE 8.

SIRT6 regulates intracellular levels of ADPr, an activator of TRPM2. A and B, pBP, SIRT6 WT, SIRT6 H133Y, pRS, and sh2 SIRT6 BxPC-3 cell extracts were supplemented with [14C]ADPr and then injected into a first HPLC analysis. Fractions were collected, and the radioactive fraction was dried, resuspended in water, and subjected to an analytical phosphate HPLC analysis. Data are expressed as mean ± S.D. (error bars) (n = 3). p values were calculated using one-way ANOVA (A) or unpaired t test (B) versus vector control cells (A, pBP; B, pRS) (**, p < 0.005; *, p < 0.05; ns, p > 0.05) or for SIRT6 WT versus SIRT6 H133Y cells (#, p < 0.05). C, SIRT6 WT BxPC-3 cells were transfected with siRNAs targeting human TRPM2. 48 h post-transfection, the TRPM2 mRNA expression level was detected in qPCR and quantified versus the GAPDH housekeeping gene. Data are shown as mean ± S.D. (n = 3). p values were calculated versus control cells transfected with scrambled siRNAs (siSCR) using unpaired t test. ***, p < 0.0005. D, SIRT6 WT BxPC-3 transfected with siTRPM2 were starved overnight and then treated with or without 25 ng/ml PMA for 1 h. IL8 and TNF mRNA levels were measured by qPCR and quantified versus the GAPDH housekeeping gene. Indicated is the -fold increase versus untreated cells calculated by the 2−ΔΔCt method. Data are represented as mean ± S.D. (n = 3). p values were calculated versus control cells transfected with scrambled siRNAs (siSCR) using an unpaired t test (***, p < 0.0005).
To define the role of the ADPr-gated Ca2+ channel TRPM2 in IL8 and TNF synthesis by PDAC cells, we knocked down its expression with siRNAs in BxPC-3 cells that expressed either pBP or WT SIRT6 (Fig. 8C) (data not shown). In both cell types, TRPM2 silencing strongly reduced both IL8 and TNF induction by PMA (Fig. 8D) (data not shown), thus confirming a key role for this cation channel in promoting cytokine expression.
TNF and IL8 Expression in Response to SIRT6 Partially Relies on NFAT but Is Independent from NF-κB
In order to identify transcription factors that could be involved in mediating cytokine gene expression in response to SIRT6-derived Ca2+-mobilizing metabolites, we investigated the nuclear translocation of 20 cAMP/Ca2+-dependent transcription factors using a transcription factor array. As shown in Fig. 9A, GATA4 and NFAT levels were significantly increased in nuclear extracts from SIRT6 WT cells (2.14 ± 0.30- and 2.24 ± 0.26-fold, respectively), as compared with pBP cells. Accordingly, GATA4 and NFAT levels were slightly decreased in cells with silenced SIRT6 expression (0.65 ± 0.07- and 0.81 ± 0.07-fold, respectively), as compared with pRS cells. In addition, the transcription factor AP-1 was increased in nuclear extracts from SIRT6 WT cells compared with control cells (2.55 ± 0.16-fold), but its levels did not differ between sh2 SIRT6 cells and their control. Conversely, the transcription factor SP1 showed a reduced nuclear expression in sh2 SIRT6 cells (0.43 ± 0.13-fold) but was not increased in SIRT6 WT cells. In subsequent experiments, we focused on NFAT and GATA4 because their nuclear translocation appeared to be consistently regulated by SIRT6 and because both have previously been shown to be dependent on Ca2+ signaling for their activation (57, 58). To determine a potential relevance of the calcineurin-NFAT pathway in the control of cytokine expression downstream of SIRT6, we made use of the calcineurin inhibitor cyclosporin A (57). Indeed, this inhibitor reduced TNF and IL8 induction in response to PMA in SIRT6-overexpressing as well as in pBP (not shown) BxPC-3 cells (Fig. 9B). To assess whether GATA4 would also play a role in SIRT6-induced cytokine production, we silenced this transcription factor with siRNAs (Fig. 9C). However, GATA4 silencing failed to blunt TNF and IL8 induction in SIRT6-overexpressing as well as in pBP (not shown) BxPC-3 (Fig. 9D).
FIGURE 9.

The calcineurin-NFAT pathway promotes TNF and IL8 induction downstream of SIRT6. A, pBP, SIRT6 WT, pRS, and sh2 SIRT6 BxPC-3 cells were incubated with 25 ng/ml PMA for 45 min. Nuclear extracts were analyzed with a cAMP/Ca2+ protein/DNA array. A semiquantitative analysis of the positive spots detected on the membranes was performed. Results are expressed as mean ± S.D. of three separate experiments and indicate the protein level in SIRT6 WT cells (white bars) or in sh2 SIRT6 cells (black bars), relative to the respective vector cells. B, SIRT6-overexpressing BxPC-3 cells were incubated with or without 1 μm cyclosporin A (CyA) for 1 h. Thereafter, cells were stimulated with 25 ng/ml PMA. 48 h later, cells were used for RNA isolation, and TNF and IL8 levels were detected by qPCR. C and D, SIRT6-overexpressing BxPC-3 cells were transfected with or without scrambled siRNAs or with anti-GATA4 siRNAs. 24 h later, cells were used for RNA isolation, and GATA4 mRNA was quantified by qPCR (C). Alternatively, cells were stimulated with PMA for an additional 48 h before RNA was isolated, and TNF and IL8 levels were determined by qPCR (D). Data are shown as mean ± S.D. (error bars) (n = 3). p values were calculated versus unstimulated control cells (B, CTR; C and D, siSCR) using an unpaired t test (***, p < 0.0005; *, p < 0.05; ns, p > 0.05).
The transcription factor NF-κB is also well known for promoting the expression of pro-inflammatory cytokines, and SIRT6 was reported to reduce its activity by deacetylating histone H3 at NF-κB promoter sites (59). In view of this evidence, we sought to assess the role of NF-κB in cytokine expression in BxPC-3 PDAC cells and to determine the impact of SIRT6 on the activity of this transcription factor. In our hands, the IKK inhibitor BAY 11-7082 reduced NF-κB activity, as detected with a NF-κB luciferase reporter assay, and blunted TNF and IL8 induction in response to PMA (Fig. 10, A and B), thus confirming a role for NF-κB signaling in the expression of these cytokines. In transcription factor arrays, NF-κB p65 levels were slightly increased in the nuclei of SIRT6 WT cells as compared with pBP cells (1.30 ± 0.03-fold), whereas nuclei from BxPC-3 cells with silenced SIRT6 exhibited reduced NF-κB p65 amounts as compared with pRS cells (0.44 ± 0.18-fold). However, interestingly, these changes failed to translate into consistent modifications in NF-κB transcriptional activity because this was affected neither by SIRT6 overexpression nor by its silencing (Fig. 10, C and D). Therefore, SIRT6 seems not to affect global NF-κB-dependent transcription in BxPC-3 cells, and SIRT6-induced cytokine secretion appears to occur independently of NF-κB activation.
FIGURE 10.

SIRT6 does not affect NF-κB transcriptional activity in BxPC-3 cells. A, NF-κB-dependent transcription was measured with an NF-κB reporter gene system in BxPC-3 cells stimulated or not with 25 ng/ml PMA for 15 h. Before PMA addition, cells were preincubated for 1 h with or without 20 μm BAY 11-7082. One representative experiment of two is shown. B, BxPC-3 cells were preincubated for 1 h with or without 20 μm BAY 11-7082. Subsequently, cells were stimulated with or without 25 ng/ml PMA for 2 h. Thereafter, cells were used for RNA extraction, and IL8 and TNF mRNA levels were quantified by qPCR. Data are expressed as mean ± S.D. (error bars) (n = 3). p values were calculated using an unpaired t test (***, p < 0.0005). C and D, NF-κB-dependent transcription was measured with an NF-κB reporter gene system in pBP, SIRT6 WT (C), pRS, and sh2 SIRT6 (D) BxPC-3 cells stimulated or not with 25 ng/ml PMA for 15 h. Data are expressed as mean ± S.D. (n = 3). p values were calculated using an unpaired t test (ns, p > 0.05). RLU, relative luciferase units.
SIRT6 Expression in PDACs
Given the role of SIRT6 in cytokine secretion and in the promotion of cell motility in PDAC cells, we assessed its expression in primary pancreatic cancers as compared with healthy pancreatic tissue. To this end, we analyzed three independent, well annotated gene expression microarray data sets (35–37). In order to compare the available data, gene expression values were transformed into Z-scores (for details, see “Experimental Procedures”). SIRT6 values from 179 samples were therefore pooled together, including 99 cancers and 80 healthy tissues. Overall, normal tissues exhibited greater variability in SIRT6 expression compared with pancreatic cancers (p value < 0.01), possibly reflecting some heterogeneity in specimen isolation from healthy pancreas. SIRT6 expression was significantly lower in pancreatic cancer samples than in their normal counterparts (p value < 0.0001). (Fig. 11A). Conversely, no difference in SIRT1 expression between healthy pancreatic tissue and pancreatic cancers was detected using the same approach (Fig. 11B).
FIGURE 11.

SIRT6 and SIRT1 expression in primary PDACs and SIRT6 expression in PDAC cell lines. A and B, SIRT6 and SIRT1 expression in pancreatic cancers (pc) and in healthy pancreatic tissue (n) was determined using three independent, well annotated gene expression microarray data sets. Available data were transformed into Z-scores (see “Experimental Procedures”). C, total RNA was isolated from PDAC cell lines and HPNE cells and used to detect SIRT6 expression by qPCR. Results were normalized to SIRT6 expression in HPNE cells. Data are shown as mean ± S.D. (error bars) (n = 3) (***, p < 0.0005; **, p < 0.005; *, p < 0.05; ns, p > 0.05).
In addition, we determined by qPCR SIRT6 mRNA levels in several PDAC cell lines and compared them with those in non-tumorigenic human pancreatic nestin-expressing (HPNE) cells (60). Here, we found that eight of 12 PDAC cell lines had higher SIRT6 levels as compared with HPNE cells, whereas only one cell line (E3LZ10.7) had lower SIRT6 expression (Fig. 11C).
DISCUSSION
In our study, we show that SIRT6 promotes the expression of inflammatory cytokines by PDAC cells and enhances their migratory capacity by a mechanism that includes ADPr production and ADPr-triggered Ca2+ responses (via TRPM2). Together with TNF, we found that several other cytokines are regulated by SIRT6 activity, including IL1α, IL6, IL8, and CSF1. Among these, IL8 is frequently detected in high concentrations in the plasma of PDAC patients and plays a key role in the pathogenesis of this neoplasia by promoting local inflammation, by enhancing angiogenesis, and by supporting PDAC growth via autocrine stimulation (40–43). In addition, IL8 has recently been shown to promote epithelial-mesenchymal transition (4).
With respect to the mechanism by which SIRT6 regulates cytokine synthesis, we found that this effect relies, at least in part, on the capacity of SIRT6 to modulate intracellular ADPr levels and, consequently, to promote Ca2+ responses inside the cell. Particularly, TRPM2 gating by SIRT6-derived ADPr appears to be key for this outcome. Previous studies focusing on SIRT2 and SIRT3 had established a link between sirtuin-derived OAADPr and TRPM2-dependent Ca2+ signaling (54). However, SIRT6 activity as a deacetylase had recently been questioned, and its capacity to synthesize OAADPr was found to be very slow as compared with other active sirtuins (26). In our hands, modulating intracellular SIRT6 levels affected H3K9 acetylation levels and, importantly, determined significant changes in intracellular ADPr concentration. These effects appeared to be related to SIRT6 enzymatic activity because a catalytically inactive isoform (SIRT6 H133Y) failed to recreate them. As a downstream effector of SIRT6-promoted Ca2+ responses, we identified the transcription factor NFAT, as suggested by the findings that NFAT representation in the nucleus is increased by SIRT6 overexpression and reduced by SIRT6 silencing and that pharmacological inhibition of calcineurin (the phosphatase that promotes NFAT nuclear translocation in response to Ca2+ (57)) reduces TNF and IL8 induction in SIRT6-overexpressing pancreatic cancer cells.
With respect to the impact of SIRT6 on NF-κB signaling, we found that, in BxPC-3 cells, SIRT6 promoted NF-κB nuclear relocalization (in particular, nuclear NF-κB p65 amounts were strongly reduced in SIRT6-silenced cells). However, despite this effect, modulating SIRT6 levels did not have a major influence on NF-κB-dependent transcription. It could be hypothesized that, although SIRT6-mediated Ca2+ responses favor NF-κB translocation to the nucleus (61), here, its activity would be held back by SIRT6-dependent histone deacetylation at NF-κB target gene promoters (59). Thus, the lack of efficacy of SIRT6 at modulating NF-κB activity in this system could be explained by the coexistence of opposing and mutually neutralizing forms of regulation.
Overall, our findings (i) indicate that SIRT6 deacetylase activity in vivo is relevant, (ii) identify SIRT6 as an important source of Ca2+-mobilizing second messengers, and (iii) place this sirtuin, together with SIRT2 and SIRT3 (54), upstream of TRPM2 in a signaling pathway that culminates in Ca2+ fluxes and consequent gene expression regulation (Fig. 12). Interestingly, contrary to SIRT6, SIRT1 appears to reduce, instead of increasing, TNF production by pancreatic cancer cells. These findings are consistent with previous literature indicating that SIRT1 down-modulates immune cell reactivity by deacetylating c-Jun and consequently yielding an inactive AP-1 factor and by reducing NF-κB activity (23, 46). Finally, it should be noticed that, although to a much lesser extent as compared with WT SIRT6, also SIRT6 H133Y promoted TNF and IL8 production in BxPC-3 cells. This effect seems unrelated to ADPr level modifications because ADPr amounts and Ca2+ responses in SIRT6 H133Y cells were comparable with those observed in control cells. Therefore, SIRT6 may also enhance cytokine secretion via mechanisms that are unrelated to its enzymatic activity and to ADPr synthesis.
FIGURE 12.
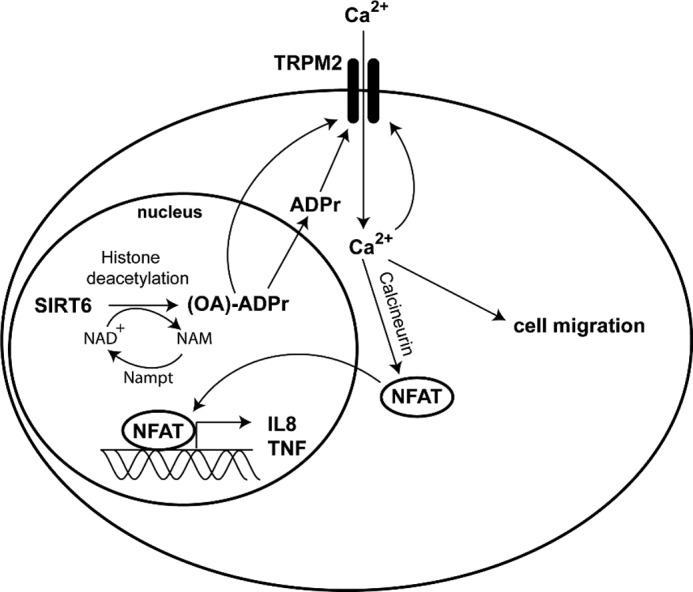
Putative mechanism for SIRT6-induced, TRPM2-mediated IL8 and TNF release and migration in pancreatic cancer cells. SIRT6 catalyzes the NAD+-dependent deacetylation of target histones, thereby generating nicotinamide (NAM) and OAADPr, which can be subsequently hydrolyzed to ADPr that in turn activates the Ca2+ channel TRPM2. Ca2+ enters the cell, induces the expression of IL8 and TNF via NFAT signaling, and enhances cell migration.
The fact that in our cell models SIRT6 promoted cytokine production by enhancing gene expression is in partial contrast with a previous study showing that NAD+ availability and SIRT6 activity do not enhance Tnf gene expression but rather the efficiency with which Tnf mRNA is translated (11). A possible explanation for this discrepancy is that Van Gool et al. (11), unlike us, drew their conclusions largely based on data obtained with chemical inhibitors, such as nicotinamide, sirtinol, cambinol, and FK866, which can affect numerous cellular processes. Moreover, a different cell model was used by these authors (mouse RAW 264.7 macrophages). Nonetheless, although highlighting a clear role for SIRT6 in the regulation of cytokine mRNA, our experiments do not exclude the possibility that a mechanism for cytokine synthesis regulation by SIRT6 such as that proposed by Van Gool et al. (11) (cytokine mRNA translation regulation) also takes place and contributes to the phenotypes that we observed.
In line with its capacity to enhance Ca2+ responses inside the cell, we found that SIRT6 also promoted cell migration, which is another cellular function that strongly depends on Ca2+ entry (50). Thus, these results link SIRT6 to another key function of cancer cells that is involved in metastatic dissemination and local invasion (2).
Interestingly, despite the fact that SIRT6 clearly promotes a pro-inflammatory phenotype in PDAC cells, its levels in pancreatic cancer appear to be lower than those in normal pancreatic tissue (at least at the mRNA level). This counterintuitive finding could be explained by the fact that SIRT6, in addition to its role in genome stability and inflammation, is involved in glucose metabolism (11, 27, 62). Namely, SIRT6 deficiency results in increased glucose uptake by the cell and in increased glycolysis (62). Thus, it is conceivable that cancer cells could use low SIRT6 levels to support their glycolytic metabolism (Warburg effect). It is, however, noteworthy that, contrary to what was observed in primary tumors, the majority of PDAC cell lines examined were found to have increased SIRT6 levels as compared with the non-tumorigenic pancreatic epithelial HPNE cells. Although this observation refers to cell lines and could be explained, for instance, by forms of adaptations to defined culture conditions, it is appealing to speculate that SIRT6 up-regulation could actually occur at certain stages of pancreatic carcinogenesis and possibly be associated with advanced or highly aggressive forms of cancer such as those from which cancer cell lines are typically generated.
Overall, our study shows that SIRT6 enzymatic activity is linked to the production of Ca2+-mobilizing nucleotides, such as ADPr. This results in increased Ca2+ signaling, inflammatory gene expression, and cell motility. Future studies will have to address the real benefit of SIRT6 inhibition in cancer, possibly addressing the issue of SIRT6 contribution to different stages of cancer progression.
Acknowledgments
We thank Dr. Kathrin F. Chua (Department of Medicine, Stanford University, Stanford, CA) for providing valuable reagents for this study and Dr. Filippo Ansaldi and Dr. Giancarlo Icardi (Department of Health Sciences, University of Genoa, Genoa, Italy) for the use of the BSL2+ Facility.
This work was supported in part by the Associazione Italiana per la Ricerca sul Cancro (AIRC, Code 6108) (to A. N.), by the European Seventh Framework Program (Project 256986, PANACREAS) (to A. N.), by Ministero della Salute Grant GR-2008-1135635 (to A. N.), by the Fondazione CARIGE, by the Compagnia di San Paolo, and by the University of Genoa.
- PDAC
- pancreatic ductal adenocarcinoma
- ADPr
- ADP-ribose
- NFAT
- nuclear factor of activated T cells
- pBP
- pBABEpuro
- pRS
- pRETROSUPER
- qPCR
- quantitative real-time PCR
- HBSS
- Hanks' balanced salt solution
- PMA
- phorbol 12-myristate 13-acetate
- H3K9
- histone H3 lysine 9
- BMDC
- bone marrow-derived dendritic cell
- ANOVA
- analysis of variance
- HPNE
- human pancreatic nestin-expressing.
REFERENCES
- 1. Coussens L. M., Werb Z. (2002) Inflammation and cancer. Nature 420, 860–867 [DOI] [PMC free article] [PubMed] [Google Scholar]
- 2. Hanahan D., Weinberg R. A. (2011) Hallmarks of cancer. The next generation. Cell 144, 646–674 [DOI] [PubMed] [Google Scholar]
- 3. Balkwill F. R., Mantovani A. (2012) Cancer-related inflammation. Common themes and therapeutic opportunities. Semin. Cancer Biol. 22, 33–40 [DOI] [PubMed] [Google Scholar]
- 4. Fernando R. I., Castillo M. D., Litzinger M., Hamilton D. H., Palena C. (2011) IL-8 signaling plays a critical role in the epithelial-mesenchymal transition of human carcinoma cells. Cancer Res. 71, 5296–5306 [DOI] [PMC free article] [PubMed] [Google Scholar]
- 5. Mantovani A. (2010) Molecular pathways linking inflammation and cancer. Curr. Mol. Med. 10, 369–373 [DOI] [PubMed] [Google Scholar]
- 6. Kiefer F., Siekmann A. F. (2011) The role of chemokines and their receptors in angiogenesis. Cell Mol. Life Sci. 68, 2811–2830 [DOI] [PMC free article] [PubMed] [Google Scholar]
- 7. Argilés J. M., Busquets S., Toledo M., López-Soriano F. J. (2009) The role of cytokines in cancer cachexia. Curr. Opin. Support Palliat. Care 3, 263–268 [DOI] [PubMed] [Google Scholar]
- 8. Kurzrock R. (2001) The role of cytokines in cancer-related fatigue. Cancer 92, 1684–1688 [DOI] [PubMed] [Google Scholar]
- 9. Robert F., Mills J. R., Agenor A., Wang D., DiMarco S., Cencic R., Tremblay M. L., Gallouzi I. E., Hekimi S., Wing S. S., Pelletier J. (2012) Targeting protein synthesis in a Myc/mTOR-driven model of anorexia-cachexia syndrome delays its onset and prolongs survival. Cancer Res. 72, 747–756 [DOI] [PubMed] [Google Scholar]
- 10. Hidalgo M. (2010) Pancreatic cancer. N. Engl. J. Med. 362, 1605–1617 [DOI] [PubMed] [Google Scholar]
- 11. Van Gool F., Gallí M., Gueydan C., Kruys V., Prevot P. P., Bedalov A., Mostoslavsky R., Alt F. W., De Smedt T., Leo O. (2009) Intracellular NAD levels regulate tumor necrosis factor protein synthesis in a sirtuin-dependent manner. Nat. Med. 15, 206–210 [DOI] [PMC free article] [PubMed] [Google Scholar]
- 12. Bruzzone S., Fruscione F., Morando S., Ferrando T., Poggi A., Garuti A., D'Urso A., Selmo M., Benvenuto F., Cea M., Zoppoli G., Moran E., Soncini D., Ballestrero A., Sordat B., Patrone F., Mostoslavsky R., Uccelli A., Nencioni A. (2009) Catastrophic NAD+ depletion in activated T lymphocytes through Nampt inhibition reduces demyelination and disability in EAE. PLoS One 4, e7897. [DOI] [PMC free article] [PubMed] [Google Scholar]
- 13. Busso N., Karababa M., Nobile M., Rolaz A., Van Gool F., Galli M., Leo O., So A., De Smedt T. (2008) Pharmacological inhibition of nicotinamide phosphoribosyltransferase/visfatin enzymatic activity identifies a new inflammatory pathway linked to NAD. PLoS One 3, e2267. [DOI] [PMC free article] [PubMed] [Google Scholar]
- 14. Magnone M., Bauer I., Poggi A., Mannino E., Sturla L., Brini M., Zocchi E., De Flora A., Nencioni A., Bruzzone S. (2012) NAD+ levels control Ca2+ store replenishment and mitogen-induced increase of cytosolic Ca2+ by Cyclic ADP-ribose-dependent TRPM2 channel gating in human T lymphocytes. J. Biol. Chem. 287, 21067–21081 [DOI] [PMC free article] [PubMed] [Google Scholar]
- 15. Montecucco F., Bauer I., Braunersreuther V., Bruzzone S., Akhmedov A., Luscher T. F., Speer T., Poggi A., Mannino E., Pelli G., Galan K., Bertolotto M., Lenglet S., Garuti A., Montessuit C., Lerch R., Pellieux C., Vuilleumier N., Dallegri F., Mage J., Sebastian C., Mostoslavsky R., Gayet-Ageron A., Patrone F., Mach F., Nencioni A. (2012) Inhibition of nicotinamide phosphoribosyltransferase reduces neutrophil-mediated injury in myocardial infarction. Antioxid. Redox. Signal., in press [DOI] [PMC free article] [PubMed] [Google Scholar]
- 16. Grahnert A., Grahnert A., Klein C., Schilling E., Wehrhahn J., Hauschildt S. (2011) Review. NAD+. A modulator of immune functions. Innate Immun. 17, 212–233 [DOI] [PubMed] [Google Scholar]
- 17. Fliegert R., Gasser A., Guse A. H. (2007) Regulation of calcium signalling by adenine-based second messengers. Biochem. Soc. Trans. 35, 109–114 [DOI] [PubMed] [Google Scholar]
- 18. Lund F. E. (2006) Signaling properties of CD38 in the mouse immune system. Enzyme-dependent and -independent roles in immunity. Mol. Med. 12, 328–333 [DOI] [PMC free article] [PubMed] [Google Scholar]
- 19. Lee H. C. (2011) Cyclic ADP-ribose and NAADP. Fraternal twin messengers for calcium signaling. Sci. China Life Sci. 54, 699–711 [DOI] [PubMed] [Google Scholar]
- 20. Yamamoto S., Shimizu S., Kiyonaka S., Takahashi N., Wajima T., Hara Y., Negoro T., Hiroi T., Kiuchi Y., Okada T., Kaneko S., Lange I., Fleig A., Penner R., Nishi M., Takeshima H., Mori Y. (2008) TRPM2-mediated Ca2+ influx induces chemokine production in monocytes that aggravates inflammatory neutrophil infiltration. Nat. Med. 14, 738–747 [DOI] [PMC free article] [PubMed] [Google Scholar]
- 21. Knowles H., Heizer J. W., Li Y., Chapman K., Ogden C. A., Andreasen K., Shapland E., Kucera G., Mogan J., Humann J., Lenz L. L., Morrison A. D., Perraud A. L. (2011) Transient receptor potential melastatin 2 (TRPM2) ion channel is required for innate immunity against Listeria monocytogenes. Proc. Natl. Acad. Sci. U.S.A. 108, 11578–11583 [DOI] [PMC free article] [PubMed] [Google Scholar]
- 22. Slade D., Dunstan M. S., Barkauskaite E., Weston R., Lafite P., Dixon N., Ahel M., Leys D., Ahel I. (2011) The structure and catalytic mechanism of a poly(ADP-ribose) glycohydrolase. Nature 477, 616–620 [DOI] [PMC free article] [PubMed] [Google Scholar]
- 23. Finkel T., Deng C. X., Mostoslavsky R. (2009) Recent progress in the biology and physiology of sirtuins. Nature 460, 587–591 [DOI] [PMC free article] [PubMed] [Google Scholar]
- 24. Liszt G., Ford E., Kurtev M., Guarente L. (2005) Mouse Sir2 homolog SIRT6 is a nuclear ADP-ribosyltransferase. J. Biol. Chem. 280, 21313–21320 [DOI] [PubMed] [Google Scholar]
- 25. Michishita E., McCord R. A., Berber E., Kioi M., Padilla-Nash H., Damian M., Cheung P., Kusumoto R., Kawahara T. L., Barrett J. C., Chang H. Y., Bohr V. A., Ried T., Gozani O., Chua K. F. (2008) SIRT6 is a histone H3 lysine 9 deacetylase that modulates telomeric chromatin. Nature 452, 492–496 [DOI] [PMC free article] [PubMed] [Google Scholar]
- 26. Pan P. W., Feldman J. L., Devries M. K., Dong A., Edwards A. M., Denu J. M. (2011) Structure and biochemical functions of SIRT6. J. Biol. Chem. 286, 14575–14587 [DOI] [PMC free article] [PubMed] [Google Scholar]
- 27. Mostoslavsky R., Chua K. F., Lombard D. B., Pang W. W., Fischer M. R., Gellon L., Liu P., Mostoslavsky G., Franco S., Murphy M. M., Mills K. D., Patel P., Hsu J. T., Hong A. L., Ford E., Cheng H. L., Kennedy C., Nunez N., Bronson R., Frendewey D., Auerbach W., Valenzuela D., Karow M., Hottiger M. O., Hursting S., Barrett J. C., Guarente L., Mulligan R., Demple B., Yancopoulos G. D., Alt F. W. (2006) Genomic instability and aging-like phenotype in the absence of mammalian SIRT6. Cell 124, 315–329 [DOI] [PubMed] [Google Scholar]
- 28. Kaidi A., Weinert B. T., Choudhary C., Jackson S. P. (2010) Human SIRT6 promotes DNA end resection through CtIP deacetylation. Science 329, 1348–1353 [DOI] [PMC free article] [PubMed] [Google Scholar] [Retracted]
- 29. Mao Z., Hine C., Tian X., Van Meter M., Au M., Vaidya A., Seluanov A., Gorbunova V. (2011) SIRT6 promotes DNA repair under stress by activating PARP1. Science 332, 1443–1446 [DOI] [PMC free article] [PubMed] [Google Scholar]
- 30. Andrews N. C., Faller D. V. (1991) A rapid micropreparation technique for extraction of DNA-binding proteins from limiting numbers of mammalian cells. Nucleic Acids Res. 19, 2499. [DOI] [PMC free article] [PubMed] [Google Scholar]
- 31. Skehan P., Storeng R., Scudiero D., Monks A., McMahon J., Vistica D., Warren J. T., Bokesch H., Kenney S., Boyd M. R. (1990) New colorimetric cytotoxicity assay for anticancer-drug screening. J. Natl. Cancer Inst. 82, 1107–1112 [DOI] [PubMed] [Google Scholar]
- 32. Bruzzone S., De Flora A., Usai C., Graeff R., Lee H. C. (2003) Cyclic ADP-ribose is a second messenger in the lipopolysaccharide-stimulated proliferation of human peripheral blood mononuclear cells. Biochem. J. 375, 395–403 [DOI] [PMC free article] [PubMed] [Google Scholar]
- 33. Basile G., Taglialatela-Scafati O., Damonte G., Armirotti A., Bruzzone S., Guida L., Franco L., Usai C., Fattorusso E., De Flora A., Zocchi E. (2005) ADP-ribosyl cyclases generate two unusual adenine homodinucleotides with cytotoxic activity on mammalian cells. Proc. Natl. Acad. Sci. U.S.A. 102, 14509–14514 [DOI] [PMC free article] [PubMed] [Google Scholar]
- 34. Inaba K., Inaba M., Romani N., Aya H., Deguchi M., Ikehara S., Muramatsu S., Steinman R. M. (1992) Generation of large numbers of dendritic cells from mouse bone marrow cultures supplemented with granulocyte/macrophage colony-stimulating factor. J. Exp. Med. 176, 1693–1702 [DOI] [PMC free article] [PubMed] [Google Scholar]
- 35. Badea L., Herlea V., Dima S. O., Dumitrascu T., Popescu I. (2008) Combined gene expression analysis of whole-tissue and microdissected pancreatic ductal adenocarcinoma identifies genes specifically overexpressed in tumor epithelia. Hepatogastroenterology 55, 2016–2027 [PubMed] [Google Scholar]
- 36. Pei H., Li L., Fridley B. L., Jenkins G. D., Kalari K. R., Lingle W., Petersen G., Lou Z., Wang L. (2009) FKBP51 affects cancer cell response to chemotherapy by negatively regulating Akt. Cancer Cell 16, 259–266 [DOI] [PMC free article] [PubMed] [Google Scholar]
- 37. Ishikawa M., Yoshida K., Yamashita Y., Ota J., Takada S., Kisanuki H., Koinuma K., Choi Y. L., Kaneda R., Iwao T., Tamada K., Sugano K., Mano H. (2005) Experimental trial for diagnosis of pancreatic ductal carcinoma based on gene expression profiles of pancreatic ductal cells. Cancer Sci. 96, 387–393 [DOI] [PMC free article] [PubMed] [Google Scholar]
- 38. Tennen R. I., Berber E., Chua K. F. (2010) Functional dissection of SIRT6. Identification of domains that regulate histone deacetylase activity and chromatin localization. Mech. Ageing Dev. 131, 185–192 [DOI] [PMC free article] [PubMed] [Google Scholar]
- 39. Egberts J. H., Cloosters V., Noack A., Schniewind B., Thon L., Klose S., Kettler B., von Forstner C., Kneitz C., Tepel J., Adam D., Wajant H., Kalthoff H., Trauzold A. (2008) Anti-tumor necrosis factor therapy inhibits pancreatic tumor growth and metastasis. Cancer Res. 68, 1443–1450 [DOI] [PubMed] [Google Scholar]
- 40. Chan D. A., Kawahara T. L., Sutphin P. D., Chang H. Y., Chi J. T., Giaccia A. J. (2009) Tumor vasculature is regulated by PHD2-mediated angiogenesis and bone marrow-derived cell recruitment. Cancer cell 15, 527–538 [DOI] [PMC free article] [PubMed] [Google Scholar]
- 41. Shi Q., Abbruzzese J. L., Huang S., Fidler I. J., Xiong Q., Xie K. (1999) Constitutive and inducible interleukin 8 expression by hypoxia and acidosis renders human pancreatic cancer cells more tumorigenic and metastatic. Clin. Cancer Res. 5, 3711–3721 [PubMed] [Google Scholar]
- 42. Ebrahimi B., Tucker S. L., Li D., Abbruzzese J. L., Kurzrock R. (2004) Cytokines in pancreatic carcinoma. Correlation with phenotypic characteristics and prognosis. Cancer 101, 2727–2736 [DOI] [PubMed] [Google Scholar]
- 43. Matsuo Y., Ochi N., Sawai H., Yasuda A., Takahashi H., Funahashi H., Takeyama H., Tong Z., Guha S. (2009) CXCL8/IL-8 and CXCL12/SDF-1α co-operatively promote invasiveness and angiogenesis in pancreatic cancer. Int. J. Cancer 124, 853–861 [DOI] [PMC free article] [PubMed] [Google Scholar]
- 44. Mukaida N., Shiroo M., Matsushima K. (1989) Genomic structure of the human monocyte-derived neutrophil chemotactic factor IL-8. J. Immunol. 143, 1366–1371 [PubMed] [Google Scholar]
- 45. Sung S. J., Walters J. A., Hudson J., Gimble J. M. (1991) Tumor necrosis factor-α mRNA accumulation in human myelomonocytic cell lines. Role of transcriptional regulation by DNA sequence motifs and mRNA stabilization. J. Immunol. 147, 2047–2054 [PubMed] [Google Scholar]
- 46. Zhang J., Lee S. M., Shannon S., Gao B., Chen W., Chen A., Divekar R., McBurney M. W., Braley-Mullen H., Zaghouani H., Fang D. (2009) The type III histone deacetylase Sirt1 is essential for maintenance of T cell tolerance in mice. J. Clin. Invest. 119, 3048–3058 [DOI] [PMC free article] [PubMed] [Google Scholar]
- 47. Zhu X., Liu Q., Wang M., Liang M., Yang X., Xu X., Zou H., Qiu J. (2011) Activation of Sirt1 by resveratrol inhibits TNF-α-induced inflammation in fibroblasts. PLoS One 6, e27081. [DOI] [PMC free article] [PubMed] [Google Scholar]
- 48. Hasmann M., Schemainda I. (2003) FK866, a highly specific noncompetitive inhibitor of nicotinamide phosphoribosyltransferase, represents a novel mechanism for induction of tumor cell apoptosis. Cancer Res. 63, 7436–7442 [PubMed] [Google Scholar]
- 49. Preiss J., Handler P. (1958) Biosynthesis of diphosphopyridine nucleotide. II. Enzymatic aspects. J. Biol. Chem. 233, 493–500 [PubMed] [Google Scholar]
- 50. Prevarskaya N., Skryma R., Shuba Y. (2011) Calcium in tumour metastasis. New roles for known actors. Nat. Rev. Cancer 11, 609–618 [DOI] [PubMed] [Google Scholar]
- 51. Jackson M. D., Denu J. M. (2002) Structural identification of 2′- and 3′-O-acetyl-ADP-ribose as novel metabolites derived from the Sir2 family of β-NAD+-dependent histone/protein deacetylases. J. Biol. Chem. 277, 18535–18544 [DOI] [PubMed] [Google Scholar]
- 52. Sauve A. A., Celic I., Avalos J., Deng H., Boeke J. D., Schramm V. L. (2001) Chemistry of gene silencing. The mechanism of NAD+-dependent deacetylation reactions. Biochemistry 40, 15456–15463 [DOI] [PubMed] [Google Scholar]
- 53. Tong L., Denu J. M. (2010) Function and metabolism of sirtuin metabolite O-acetyl-ADP-ribose. Biochim. Biophys. Acta 1804, 1617–1625 [DOI] [PMC free article] [PubMed] [Google Scholar]
- 54. Grubisha O., Rafty L. A., Takanishi C. L., Xu X., Tong L., Perraud A. L., Scharenberg A. M., Denu J. M. (2006) Metabolite of SIR2 reaction modulates TRPM2 ion channel. J. Biol. Chem. 281, 14057–14065 [DOI] [PubMed] [Google Scholar]
- 55. Peterson F. C., Chen D., Lytle B. L., Rossi M. N., Ahel I., Denu J. M., Volkman B. F. (2011) Orphan macrodomain protein (human C6orf130) is an O-acyl-ADP-ribose deacylase. Solution structure and catalytic properties. J. Biol. Chem. 286, 35955–35965 [DOI] [PMC free article] [PubMed] [Google Scholar]
- 56. Perraud A. L., Fleig A., Dunn C. A., Bagley L. A., Launay P., Schmitz C., Stokes A. J., Zhu Q., Bessman M. J., Penner R., Kinet J. P., Scharenberg A. M. (2001) ADP-ribose gating of the calcium-permeable LTRPC2 channel revealed by Nudix motif homology. Nature 411, 595–599 [DOI] [PubMed] [Google Scholar]
- 57. Müller M. R., Rao A. (2010) NFAT, immunity and cancer. A transcription factor comes of age. Nat. Rev. Immunol. 10, 645–656 [DOI] [PubMed] [Google Scholar]
- 58. Suzuki Y. J. (2011) Cell signaling pathways for the regulation of GATA4 transcription factor. Implications for cell growth and apoptosis. Cell. Signal. 23, 1094–1099 [DOI] [PMC free article] [PubMed] [Google Scholar]
- 59. Kawahara T. L., Michishita E., Adler A. S., Damian M., Berber E., Lin M., McCord R. A., Ongaigui K. C., Boxer L. D., Chang H. Y., Chua K. F. (2009) SIRT6 links histone H3 lysine 9 deacetylation to NF-κB-dependent gene expression and organismal life span. Cell 136, 62–74 [DOI] [PMC free article] [PubMed] [Google Scholar]
- 60. Lee K. M., Nguyen C., Ulrich A. B., Pour P. M., Ouellette M. M. (2003) Immortalization with telomerase of the Nestin-positive cells of the human pancreas. Biochem. Biophys. Res. Commun. 301, 1038–1044 [DOI] [PubMed] [Google Scholar]
- 61. Steffan N. M., Bren G. D., Frantz B., Tocci M. J., O'Neill E. A., Paya C. V. (1995) Regulation of IκBα phosphorylation by PKC- and Ca2+-dependent signal transduction pathways. J. Immunol. 155, 4685–4691 [PubMed] [Google Scholar]
- 62. Zhong L., D'Urso A., Toiber D., Sebastian C., Henry R. E., Vadysirisack D. D., Guimaraes A., Marinelli B., Wikstrom J. D., Nir T., Clish C. B., Vaitheesvaran B., Iliopoulos O., Kurland I., Dor Y., Weissleder R., Shirihai O. S., Ellisen L. W., Espinosa J. M., Mostoslavsky R. (2010) The histone deacetylase Sirt6 regulates glucose homeostasis via Hif1α. Cell 140, 280–293 [DOI] [PMC free article] [PubMed] [Google Scholar]