

Background: Cones show lower light-sensitivity and briefer light responses than rods.
Results: The rate of transducin activation is lower, and its inactivation is much faster in cones than in rods.
Conclusion: Lower light-sensitivity and briefer light responses in carp cones are, at least in part, determined at the level of transducin.
Significance: Two of the molecular bases of the functional differences between carp rods and cones are explained.
Keywords: G proteins, Photoreceptors, Phototransduction, Physiology, Signal Transduction, Cones, Rods, Signal Amplification
Abstract
Cone photoreceptors show lower light sensitivity and briefer light responses than rod photoreceptors. The light detection signal in these cells is amplified through a phototransduction cascade. The first step of amplification in the cascade is the activation of a GTP-binding protein, transducin (Tr), by light-activated visual pigment (R*). We quantified transducin activation by measuring the binding of GTPγS in purified carp rod and cone membrane preparations with the use of a rapid quench apparatus and found that transducin activation by an R* molecule is ∼5 times less efficient in cones than in rods. Transducin activation terminated in less than 1 s in cones, more quickly than in rods. The rate of GTP hydrolysis in Tr*, and thus the rate of Tr* inactivation, was ∼25 times higher in cones than in rods. This faster inactivation of Tr* ensures briefer light responses in cones. The expression level of RGS9 was found to be ∼20 times higher in cones than in rods, which explains higher GTP hydrolytic activity and, thus, faster Tr* inactivation in cones than in rods. Although carp rods and cones express rod- or cone-versions of visual pigment and transducin, these molecules themselves do not seem to induce the differences significantly in the transducin activation and Tr* inactivation in rods and cones. Instead, the differences seem to be brought about in a rod or cone cell-type specific manner.
Introduction
In the vertebrate retina, there are two types of visual photoreceptors, rods and cones. They are different in many aspects. For example, the light sensitivity of a cone is lower than that of a rod, and the duration of a light response to a brief light flash is shorter in cones than in rods (for reviews, see Refs. 1–3). Because of the difference in light sensitivity, rods mediate night vision, whereas cones mediate daylight vision. Briefer light responses in cones enable them to detect light signals with higher time resolution than rods. These differences are thought to arise from the differences in the molecular mechanisms that are responsible for generation and termination of a light response. These mechanisms are well studied in rods. The generation mechanism, the phototransduction cascade, consists of visual pigment (R),2 photoreceptor-specific trimeric G-protein (transducin, Tr), and cGMP phosphodiesterase (PDE). A light-activated visual pigment molecule (R*) activates many molecules of Tr to amplify a photon capture signal by catalyzing the GTP-GDP exchange in the α subunit of Tr, and activated transducin (Tr*) then activates PDE. Activated PDE (PDE*) hydrolyzes cGMP to close a cGMP-gated cation channel to result in a hyperpolarizing light response. To terminate a light response, both inactivation of activated molecules (R*, Tr*, PDE*) and restoration of cGMP concentration are required. R* is inactivated by phosphorylation and subsequent binding of arrestin. Tr* is inactivated by hydrolysis of bound GTP to GDP with its intrinsic GTPase activity. It is known that RGS9, a photoreceptor-specific GTPase-accelerating protein (GAP), accelerates this hydrolysis (4).
In cones, homologous mechanisms are known to be present (1–3). In our previous studies, by using purified rods and cones from carp (Cyprinus carpio), we showed that PDE activation measured at its peak in the light is ∼260 times less sensitive to light in cones than in rods (5), and R* inactivation by phosphorylation (6) together with restoration of cGMP concentration (7) is much more efficient in cones than in rods. These results seem to explain lower light sensitivity and briefer light responses in cones (3).
In this study, we focused on activation and inactivation of transducin in carp cones. Previously, we showed that transducin activation is less efficient in cones than in rods in carp (5). However, in that study, transducin activation by R* measured by binding of GTPγS, a nonhydrolyzable GTP analog, was completed in a few seconds in cones and was too rapid to measure with a conventional biochemical method. In this study, therefore, we used a rapid-quench apparatus to measure this time course and found that the rate of transducin activation is clearly lower in cones than in rods. We further measured the inactivation of transducin, i.e. the hydrolysis GTP, and found that it is much faster in cones. It is very likely that this faster inactivation is due to an ∼20 times higher expression level of RGS9 in the outer segment (OS) in cones.
EXPERIMENTAL PROCEDURES
Preparation of Rod and Cone Membranes
Animals were cared for according to the institutional guidelines. Carp (C. carpio) rods and cones were isolated by using a stepwise Percoll density gradient as described previously (5). Our cone preparation is a mixture of mainly red (∼60%), green (∼20%), and blue (∼20%) cones (5). Isolated cells were washed with a potassium gluconate buffer (K-gluc buffer) (115 mm potassium gluconate, 2.5 mm KCl, 2 mm MgCl2, 10 mm HEPES, 1 mm DTT (pH 7.5)) and were stored at −80 °C until use. When used, stored cells were thawed and washed twice by centrifugation with the K-gluc buffer to obtain rod or cone membranes, and then the membranes were suspended in the same buffer (5). We assumed that the access of small molecules like GTPγS, GTP, and ATP to membranes was not rate-limiting in our measurement. When necessary, we prepared membrane preparations containing intact visual pigments but lacking activities of peripheral proteins such as transducin and pigment kinase (6). Cone outer segment (COS)-rich and cone inner segment (CIS)-rich membranes were prepared as described previously (8). In each type of the sample, an aliquot of a suspension was used to quantify spectrophotometrically the amount of visual pigment in the membranes (5). All of these manipulations were performed in complete darkness with the aid of an infrared image converter (NVR 2015, NEC, Tokyo, Japan).
Purification of Rod Transducin
Rod transducin was prepared from purified rod membranes on the basis of a method reported in a previous report (9), with some modifications. Rod membranes were illuminated with a 100-W halogen lamp at a 20-cm distance to form a complex of R* and transducin. The membranes were washed once with a hypotonic buffer (5 mm Tris, 0.5 mm MgCl2, 1 mm DTT (pH 7.2)) supplemented with 0.2 mm EDTA and subsequently washed twice with the hypotonic buffer without EDTA to remove soluble and peripheral proteins, except transducin in the complex. Then, transducin bound to R* was extracted from rod membranes by using the hypotonic buffer supplemented with 1 mm GTP. The extract was concentrated in the K-gluc buffer with ultrafiltration (Vivaspin 20, Sartorius). Purified rod transducin was dissolved in an SDS-PAGE sample buffer (62.5 mm Tris, 10% (w/v) glycerol, 5% (w/v) β-mercaptoethanol, 2.3% (w/v) SDS, 0.1% (w/v) bromphenol blue) and was quantified with Coomassie Brilliant Blue (CBB)-staining after SDS-PAGE using BSA as a molar standard.
GTPγS Binding Assay
To measure time courses of transducin activation, a filter binding assay was carried out on the basis of a previous method using [35S]GTPγS (5). Rod or cone membranes (9 μl) were mixed with 6 μl of the K-gluc buffer containing various chemicals. The ingredients in the mixture were 0.6 μm rod or 0.3 μm cone pigments, 100 μm [35S]GTPγS, 100 μm GDP, 0.8 mm EGTA, and, when necessary, 1 mm ATP or 0.6 μm purified rod transducin. The concentration of GTPγS (100 μm) was saturating because 200 μm GTPγS gave results indistinguishable from those obtained at 100 μm GTPγS. After preincubation for 20 s, the sample was illuminated with a light flash at an attenuated intensity with use of a cutoff filter passing the light longer than 420 nm. In the experiments to measure time courses of transducin activation, light flashes bleaching 0.0085% and 0.25% of visual pigment in the rod and cone membranes, respectively, were used. These flash intensities were estimated on the basis of the neutral density filters we used for attenuation of a light flash of which intensity was calibrated separately. The measurement was carried out at 20 °C throughout. The binding of [35S]GTPγS was terminated at various time intervals after a light flash by adding 200 μl of an ice-chilled K-gluc buffer containing 50 mm NH2OH to inactivate R* plus 25 mm non-radioactive GTP to dilute radioactive [35S]GTPγS by > 3000-fold. The timing of addition was strictly controlled by using a rapid-quench apparatus that could terminate a reaction in less than 0.1 s (6). In this study, we repeated measurements of a reaction at least three times independently, and all of the data points were pooled to determine the rate. In the measurement of GTPγS binding time course, the reaction started to become saturated at a few early time points, especially in the case of cone membranes (Fig. 2B). For this reason, we assumed a saturating exponential increase of GTPγS binding after a light flash and determined the initial rate of the binding of GTPγS with curve fitting.
FIGURE 2.

Early time courses of transducin activation in rod and cone membranes. A, light-dependent GTPγS binding in rod membranes in the absence (black ●, n = 5) and presence (red ●, n = 4–5) of ATP. The vertical axis shows the number of GTPγS molecules bound per visual pigment bleached. B, light-dependent GTPγS binding in cone membranes in the absence (black ▴, n = 3–5) and presence (red ▴, n = 3–5) of ATP. C and D, time courses of GTPγS binding to exogenous rod transducin in urea-washed, endogenous transducin-free rod (C, n = 4–5) and cone membranes (D, n = 5–9). Rod transducin was added at the molar ratio of 0.1 to visual pigment in both C and D. Black dotted lines in A and B and red dotted lines in C and D show the fitting results of GTPγS binding with use of saturating exponential functions (see text). Black dotted lines in C and D show the redrawn fitting results shown in A and B, respectively. Each data point in A–D indicates mean ± S.E. in n independent measurements.
Quantification of Transducin
The amount of transducin in rod and cone membranes were quantified using the GTPγS binding assay method described above, with some modifications. To activate all of the transducin molecules, a light flash bleaching 0.19 and 75% of visual pigments in rod and cone membranes, respectively, was given in the presence of 100 μm [35S]GTPγS. The reaction was terminated at 160 s and 5 s after the light flash in rod and cone membranes, respectively. To quantify the amount of transducin activated in the light, GTPγS binding in the dark was subtracted. The shorter incubation time in cone membranes was necessary to minimize light-independent thermal activation of transducin specifically observed in cones membranes.
Measurement of GTP Hydrolysis by Tr*
In a single-turnover assay, GTP hydrolysis was measured as reported previously (10), with some modifications. A rod or a cone membrane suspension (10 μl) containing 3.34 mm adenosine 5′-(β, γ-imido)triphosphate (AMP-PNP) and 18.7 mm MgCl2 was illuminated with a light flash bleaching 75% (rod) and 95% (cone) pigment. After incubation for 40 s, the sample was mixed with 6.7 μl of the K-gluc buffer containing various chemicals. The ingredients in the mixture were 3 μm rod or cone visual pigment, 130 nm [γ-32P]GTP, 2 mm AMP-PNP, 0.8 mm EGTA, 12 mm MgCl2. The measurement was carried out at 20 °C, and the reaction was terminated at various time intervals by addition of 50 μl of 6% (w/v) perchloric acid. Then, 350 μl of a phosphate buffer (5 mm NaH2PO4 (pH 7.4)) containing 10% (w/v) activated charcoal was added and mixed vigorously for 1 min three times every 10 min. The sample was centrifuged at 12,000 × g for 15 min at 4 °C, and 20 μl of the supernatant was used to measure the radioactivity of the liberated inorganic phosphate (Pi). GTP hydrolysis in Tr* was determined by subtracting the activity measured in the dark. When the measurement was done at a high concentration of rod pigment (50 μm), 0.5 μm [γ-32P] GTP (final concentration) was used.
GTP hydrolysis was also measured under steady conditions. In this measurement, rod or cone membranes (9 μl) containing AMP-PNP and MgCl2 were mixed with 6 μl of the K-gluc buffer containing [γ-32P]GTP and EGTA. The ingredients in the mixture were 5 μm rod visual pigment or 1 μm cone visual pigment, 0.2 mm [γ-32P] GTP, 2 mm AMP-PNP, 0.8 mm EGTA, 12 mm MgCl2. After pre-incubation for 20 s, the sample was illuminated with a light flash bleaching 75% (rod) and 95% (cone) pigment. GTP hydrolysis was measured similarly as shown above except that the reaction was initiated by illumination, not by addition of GTP, and terminated by adding a larger volume (200 μl) of 6% (w/v) perchloric acid, and a larger volume (800 μl) of the phosphate buffer containing activated charcoal was used.
Cloning and Expression of Carp RGS9
To obtain a molar standard of RGS9, carp RGS9 was cloned by using a carp retinal cDNA library (11). The coding region of carp RGS9 (AB180757) was inserted into the NcoI/XhoI sites in pET-16b (Novagen, Darmstadt, Germany). The recombinant plasmid was introduced into Escherichia coli BL21DE3 (Novagen). Expression of RGS9 was carried out according to the instructions of the manufacturer. After the expression, cells were suspended in a Tris-buffered saline (100 mm Tris, 0.9% (w/v) NaCl (pH 7.4)), sonicated, and centrifuged (20,000 × g for 10 min). RGS9 was collected in the insoluble fraction and was dissolved in an SDS-PAGE sample buffer. The amount of expressed RGS9 was quantified with Coomassie Brilliant Blue using BSA as a molar standard.
Preparation of Polyclonal Antisera against RGS9 and Quantification of RGS9 by Immunoblot Analysis
Whole coding region of carp RGS9 was inserted into the BamHI/XhoI sites of pGEX-5X-1(GE Healthcare) and a GST-RGS9 fusion protein was expressed in E. coli BL21DE3. The fusion protein was purified according to the instructions of the manufacturer and was used to raise anti-RGS9 antiserum in mice. The antiserum was preadsorbed by a supernatant of lysed E. coli expressing GST to reduce nonspecific signals. The amount of RGS9 in rod or cone membranes was quantified by immunoblot analysis using a calibrated amount of RGS9.
RESULTS
Time Courses of Transducin Activation in Rod and Cone Membranes
In the measurement of transducin activation, we gave a light flash of a fixed intensity within a range where GTPγS binding is a linear function of the flash intensity (0.0085% bleach in rod and 0.25% bleach in cone membranes, Fig. 1). Fig. 2, A and B, shows the time courses of transducin activation measured with binding of GTPγS in the membrane preparations of carp rods (A) and cones (B). Activation was measured in the absence (black symbols) and presence (red symbols) of ATP. Note the large differences in the scales of x axes and y axes between Fig. 2, A and B. In these measurements, we used a rapid quench apparatus to terminate the reaction in a subsecond range (see “Experimental Procedures”). The binding is shown as the number of GTPγS molecules bound per visual pigment activated (R*). In this measurement, we gave a light flash to bleach only a small portion of visual pigment (0.0085% in rod and 0.25% in cone membranes) so that Tr molecules were present in excess over R* molecules. On the basis of the finding that the molar ratio of Tr to R is 0.094 in rods and 0.055 in cones (see Fig. 4A), Tr/R* ratios were > 1000 in rod and >20 in cone membranes. In cone membranes, a higher intensity of light was necessary to obtain reliable binding signals of GTPγS.
FIGURE 1.
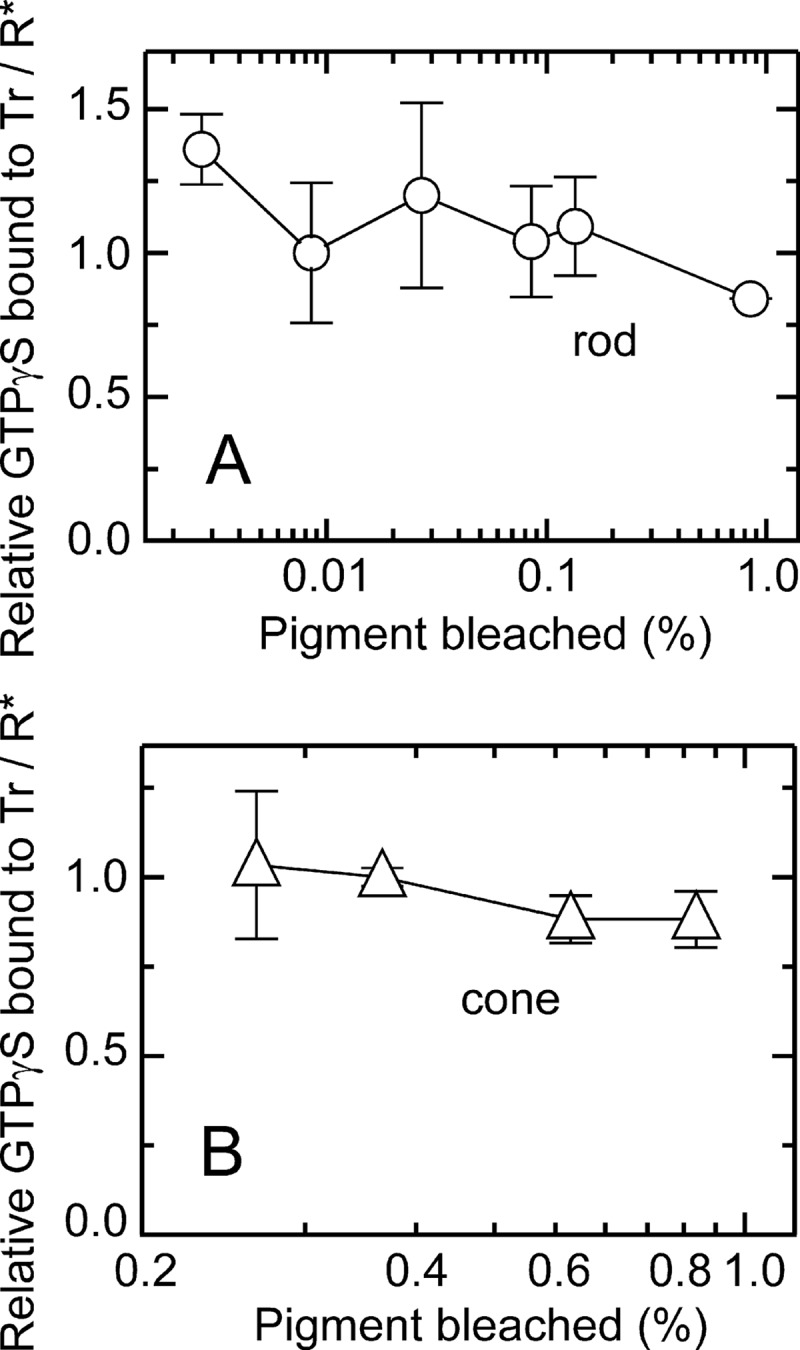
Transducin activation at various flash intensities. Light-dependent GTPγS binding was measured in rod (A, n = 2–3) and cone (B, n = 2–5) membranes at various flash intensities. The vertical axis shows relative value of GTPγS molecules bound per visual pigment bleached (R*) at 0.5 s (rod) or 0.25 s (cone) after a light flash. Data points were normalized to the average of data points obtained at the flash intensity used in this study (0.0085% bleach in rod membranes and 0.25% bleach in cone membranes). The averaged GTPγS binding at 0.0085% bleach in rod membranes was 54 ± 13 GTPγS bound/R* (A, n = 3), and that at 0.25% bleach in cone membranes was 6.8 ± 0.18 GTPγS bound/R* (B, n = 4). In A and B, each data point indicates mean ± S.E. in n independent measurements.
FIGURE 4.

Quantification of transducin and time courses of GTP hydrolysis in rod and cone membranes. A, maximum GTPγS binding in rod (n = 3) and cone (n = 3) membranes. The binding is expressed as the number of GTPγS molecules bound per visual pigment present. B, light-dependent GTP hydrolysis in rod (●, n = 3) and cone (▴, n = 7) membranes. The vertical axis shows the number of Pi released per transducin present. Initial slopes (straight lines) were determined from data points from 0 to 40 s in rod membranes and 0 to 10 s in cone membranes after a light flash. C, GTP hydrolysis per Tr* in rod membranes in the presence of both exogenous and endogenous rod transducin at a molar ratio of 2:1 (red ●, n = 3). The initial slope (red line) was determined from the data points from 0 to 40 s. The black straight line, redrawn from B, represents the initial slope of GTP hydrolysis in native rod membranes measured in the absence of exogenous rod transducin. D, GTP hydrolysis per Tr* in cone membranes in the presence of both exogenous rod and endogenous cone transducin at a molar ratio of 3.6:1 (red ▴, n = 3). The initial slope (red line) was determined from data points from 0 to 10 s. The black straight line, redrawn from B, shows the initial slope of GTP hydrolysis in native cone membranes measured in the absence of exogenous rod transducin. In B–D, each point indicates mean ± S.E. in n independent measurements.
In the absence of ATP and, therefore, in the absence of pigment phosphorylation, GTPγS binding time course was fitted with a simple exponential function (see “Experimental Procedures”) of:
where Y is the amount of GTPγS bound to transducin per R* (GTPγS/R*), A is the maximum amount of GTPγS bound to the transducin per R*, k is a rate constant, and t is the time after a light flash. Curve fitting of the results in rod membranes (Fig. 2A, black ● and dotted black line) gave the results of A = 497 GTPγS/R* and k = 0.29 s−1. The initial rate of the binding obtained by the fitting, i.e. Ak, was 143 transducin activated per R* per sec (143 Tr*/R*-sec). A similar determination was made for the results in cone membranes (Fig. 2B, black ▴ and dotted black line). In cone membranes, A = 8.5 GTPγS/R*, k = 3.5 s−1 and Ak = 30 Tr*/R*-sec. The time constants (1/k), 3.4 s in rod membranes (1/0.29), and 0.29 s in cone membranes (1/3.5), did not seem to be consistent with the decay time constant of meta II intermediate that has been believed to be a molecular species responsible for activation of transducin. They are more than 10 times higher and are generally several minutes in rods and several seconds in cones in intact cells (12, 13). No matter what k represents realistically in the GTPγS binding reaction, the above consideration gave us the estimation of the initial rate of GTPγS binding, 143 Tr*/R*-sec in rod membranes and 30 Tr*/R*-sec in cone membranes. The results showed that transducin activation was about 5 times (143/30) less efficient in cones. It was evident from this measurement that a significant portion of the difference in the amplification of a light detection signal in rods and cones is present at the level of transducin activation.
We further analyzed the GTPγS binding time course under the condition that the concentration of GTPγS is saturating (see “Experimental Procedures”). The reaction could be assumed to be
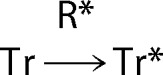 |
With k1 as the rate constant of the binding of T to R*, k2 as the decay rate constant of R*, [R*]0 and [Tr]0 as the initial concentrations of R* and Tr, respectively, and t as the time after a light flash, we obtained a following equation that expresses a time course of GTPγS binding per R*:
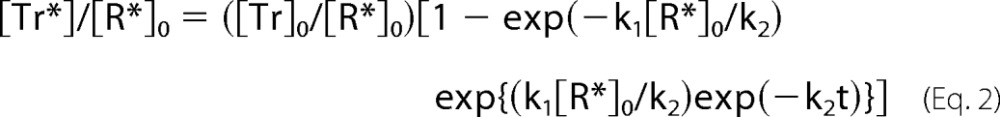 |
Curve fitting with Equation 2 gave results very similar to those obtained with Equation 1. The initial rates obtained with use of Equation 2 were 150 Tr*/R*-sec in rod membranes and 33 Tr*/R*-sec in cone membranes. In rod and cone membranes, respectively, the rate constants were k1, 2.7 × 10⁹ m−1sec−1 and 2.0 × 10⁹ m−1sec−1 and k2, 0.29 s−1 and 3.5 s−1.
In the presence of ATP (red ● and ▴ in Fig. 2, A and B), the steady level of transducin activation was suppressed in both rod and cone membranes (compare black and red ● and ▴ in Fig. 2, A, and B). In cone membranes, the suppression was remarkably fast and already completed at our earliest time point (0.125 s). Although we could not determine the initial rate in the presence of ATP in cone membranes accurately, from the early data points in both rod and cone membranes it seems that ATP, and thus pigment phosphorylation, does not affect the initial rate of transducin activation. Instead, ATP or pigment phosphorylation facilitated termination of transducin activation in both rod and cone membranes. If R* activates transducin without significant delays, termination of transducin activation in the presence of ATP reflects inactivation of R* by phosphorylation. The result, therefore, suggests that R* inactivation is very rapid in cone cells.
Rod Transducin Activation by Rod or Cone Visual Pigment
In carp rods, rod versions of visual pigment and transducin, and in cones, their cone versions, are expressed (3). As shown in Fig. 2A and B, transducin activation was less efficient in cones than in rods. This difference is due to the difference between the activation of rod transducin by rod pigment in rods and the activation of cone transducin by cone pigment in cones. It was of interest whether rod transducin is activated in cone membranes at the efficiency similar to that in rod membranes or to that in cone membranes. To examine this, we measured GTPγS binding with addition of purified rod transducin to urea-washed (and thus endogenous transducin-free) rod and cone membranes in the absence of ATP (Fig. 2, C and D).
First, as a control, we added exogenous purified rod transducin to urea-washed rod membranes in an amount similar to that of endogenous rod transducin (added exogenous rod Tr/R ratio was 0.1, whereas endogenous rod Tr/R is 0.094, see Fig. 4A). The intensity of light flash was similar to that used in the measurement in Fig. 2A so that the ratio of Tr/R* was > 1000 in rod membranes. The red ○ in Fig. 2C show GTPγS binding to this exogenously added rod transducin in urea-washed rod membranes. The initial rate of activation of exogenous rod transducin obtained by the fitting (108 Tr*/R*-sec, red dotted line) was lower (0.72 times) than but similar to that of endogenous rod transducin (143 Tr*/R*-sec, black dotted line, redrawn from Fig. 2A). The result indicated that exogenous rod transducin was activated at a similar rate as endogenous rod transducin. We then measured GTPγS binding in urea-washed and cone transducin-free cone membranes in the presence of exogenous rod transducin. In this measurement, rod transducin was added at the Tr/R ratio of 0.1 as in the control rod membranes. Because the endogenous cone Tr/R ratio is 0.055 (see Fig. 4A), the concentration of exogenous rod transducin was slightly higher (0.1/0.055 = 1.7) than that of endogenous cone transducin. The intensity of the light flash was similar to that used in Fig. 2B so that the total Tr/R* ratio was > 35. The added rod transducin was activated by cone R* (Fig. 2D, red △), and the initial rate of GTPγS binding obtained by the fitting with a saturating exponential function (red dotted line) was 5.3 Tr*/R*-sec, which was 20 times (108/5.3) lower than the rate measured in the control rod membranes shown in Fig. 2C. It was evident that rod transducin is activated in cone membranes less efficiently than in rod membranes. Because of the difficulty in preparing large amount of cone transducin, measurement of activation using purified cone transducin was not possible.
Time Courses of Transducin Inactivation in Rod and Cone Membranes
So far, it has been speculated that inactivation of Tr* is more rapid in cones than in rods on the basis of the fact that the light response is much briefer in cones. To examine how rapidly Tr* is inactivated, we measured light-dependent GTP hydrolysis in cone membranes and compared it with that in rod membranes.
We first tried to measure the GTP hydrolysis with a single-turnover assay method (10). At a pigment concentration of 3 μm, the half-lives of Tr* in rod and cone membranes were 47 s and 3.0 s, respectively (Fig. 3A). Although the hydrolysis of GTP was faster in cone membranes than in rod membranes, the hydrolysis was too slow to explain the recovery time of a light response in both rods and cones. A typical subsaturated carp rod response terminates in 1 s, and a carp red cone response in 0.2 s (3). In a single-turnover assay, the GTP concentration should be lower than the transducin concentration. At 3 μm pigment concentration, Tr concentration was expected to be 0.3 μm or so. For this reason, GTP concentration we used was 0.13 μm, and it probably was too low for immediate diffusional binding of GTP to the GTP-free form of transducin (10). In fact, we observed more rapid GTP hydrolysis (half-life, 9.4 s, Fig. 3B) in rod membranes at a higher concentration of pigment (50 μm) and GTP concentration (0.5 μm). However, preparation of cone membranes of high pigment concentration was practically very difficult because of limited availability of cone photoreceptors. For this reason, instead of use of single-turnover assay methods, we measured hydrolysis of GTP under a steady condition. We gave an intense light flash to activate all of transducin molecules in the presence of saturating concentrations of GTP to measure the maximal rate of GTP hydrolysis.
FIGURE 3.

Time courses of transducin inactivation in rod and cone membranes measured with a single-turnover assay method. A, light-dependent GTP hydrolysis was measured in rod (○, n = 3) and cone (△, n = 3) membranes containing 3 μm pigment. The amount of released Pi was normalized to its maximum, and the data points were fitted by a single exponential function. Half-lives determined by the fitting were 47 and 3.0 s in rods and cone membranes, respectively. B, light-dependent GTP hydrolysis was measured in rod membranes (○, n = 3) containing 50 μm pigment. The results are shown as in A. The rate of GTP hydrolysis was 0.074 Pi/Tr*-sec, and the half-life was 9.4 s. In A and B, each data point indicates mean ± S.E. in three independent measurements.
To measure how many GTP molecules are hydrolyzed per Tr* molecule, we needed to quantify the amount of transducin in the OS of rods and cones. By giving an intense light flash to activate all of the transducin molecules, the maximum amount of the binding of GTPγS in the rod and cone membranes was determined. Because our purified rods and cones were obtained under complete darkness, rod transducin should have been localized only to the OS. The maximum binding was 0.094 ± 0.003 (mean ± S.E., n = 3) molecules of GTPγS bound per visual pigment present in rod membranes and 0.055 ± 0.004 in cone membranes (n = 3) (Fig. 4A). The result indicated that cone transducin is 0.6 times more abundant in the cone OS than rod transducin in the rod OS. On the assumption that the pigment concentration is 3 mm in both rods and cones (14), transducin concentration in the OS was calculated to be 0.28 mm in rods and 0.17 mm in cones.
Fig. 4B shows the amounts of released Pi per transducin present in rod (●) and cone (▴) membranes. From these measurements, initial rates of GTP hydrolysis were determined in rod and cone membranes (straight lines). Because all of the transducin molecules should have been activated at the initial phase of the reaction, the initial rate of hydrolysis per Tr* could be calculated. The rate in cone membranes was 2.1 Pi released per Tr* per sec (2.1 Pi/Tr*-sec) and was ∼25 times higher than that in rod membranes (0.082 Pi/Tr*-sec). The half-lives of Tr* calculated from the rates of hydrolysis are 8.5 s in rod membranes and 0.33 s in cone membranes. Our results clearly indicated faster Tr* inactivation in cones than in rods.
Inactivation of Exogenous rod Tr* in Rod and Cone Membranes
As shown in Fig. 2, rod transducin was activated 20 times less efficiently in cones than in rods. Then, it was of interest whether activated rod transducin is inactivated in cones at a similar rate as that of cone transducin in cones or as that of rod transducin in rods. To examine it, firstly as a control, GTP hydrolysis was measured in rod membranes in the presence of both endogenous rod transducin and exogenously added rod transducin (the ratio of exogenous rod transducin to endogenous rod transducin was ∼2:1). We did not use urea-washed membranes in this study because activities of many of outer segment proteins, including a GAP protein, RGS9, would be affected by this wash (15). The intensity of a light flash was similar to that used in Fig. 4B so that all of the transducin molecules should have been activated. The initial rate of GTP hydrolysis per transducin present (and thus per Tr*) was 0.057 Pi/Tr*-sec (red ● and red straight line in Fig. 4C). Note that the rate was calculated in a unit of per Tr* so that the hydrolysis by both endogenous and exogenous rod transducin was averaged. The rate was 70% of that measured in the presence of only endogenous rod transducin in native membranes (0.082 Pi/Tr*-sec, black straight line in Fig. 4C, redrawn from B). This less efficient GTP hydrolysis (Fig. 4C) could be explained by reduced population of a complex of Tr* and RGS9 relative to the total number of transducin molecules (see “Discussion”).
In cone membranes, a similar measurement was made in the presence of 3.6 times the excess amount of exogenous rod transducin over endogenous cone transducin. The averaged rate in the presence of exogenous rod transducin was 0.96 Pi/Tr*-sec (Fig. 4D, red ▴ and red straight line). This rate was about a half (46%) of the rate of endogenous cone Tr* (2.1 Pi/Tr*-sec, black straight line in Fig. 4D) but 12 times higher (0.96/0.082) than the rate measured in the presence of endogenous rod Tr* in rod membranes. Assuming that exogenous rod transducin does not affect the GTP hydrolysis by endogenous cone transducin and that exogenous rod transducin hydrolyzes GTP at the same rate as that in native rod membranes (i.e. 0.082 Pi/Tr*-sec), our simple calculation showed that the averaged hydrolysis of GTP in the measurement in Fig. 4D should be lower than the measured activity (0.96 Pi/Tr*-sec) and was expected to be 0.52 Pi/Tr*-sec. In other words, to account for the measured activity, exogenous rod transducin should have hydrolyzed GTP at an ∼8 times higher rate (0.64 Pi/Tr*-sec) than the rate of rod transducin in native rod membranes. In reality, some of RGS9 molecules in cone membranes would have bound to the exogenous rod Tr* instead of endogenous cone Tr* so that the GTP hydrolytic activity of exogenous rod transducin in cone membranes could have been increased more than 8 times. In summary, in the studies in both Fig. 2 and 4, it became evident that, to some extent, rod transducin is activated and inactivated like cone transducin in cone membranes. In cone membranes, transducin activation was 5 times less efficient, and its inactivation was 25 times more effective than in rod membranes, whereas rod transducin was activated 20 times less efficiently and inactivated at least 8 more less efficiently in cone membranes than in rod membranes.
Quantification of RGS9 in Rods and Cones
As shown in Fig. 4, exogenous rod transducin hydrolyzed GTP in cone membranes at a rate much higher than that in rod membranes. One of the possible mechanisms of this effect is the difference in the expression levels of RGS9 between rods and cones. Although the expression level of RGS9 has been reported to be higher in cones than in rods (15, 16), quantitative comparison between rods and cones in the same animal species has not been made. We compared it in our purified carp rods and cones.
So far, no cell-type specific RGR9 subtype has been reported, and in accordance with this notion, we isolated only one type of RGS9 mRNA in our carp retinal cDNA library (11). We therefore raised an antibody against recombinant carp RGS9 expressed in E. coli and performed an immunoblot analysis on the membrane fraction and the soluble fraction of purified rod and cones (Fig. 5A). In accordance with a previous study, RGS9 was found exclusively in the membrane fraction in rods (17) as well as in cones (Fig. 5A). An immunopositive signal was found at the same position on the SDS-PAGE in the rod and the cone sample (arrows), which supports the notion that rods and cones in carp express the same subtype of RGS9.
FIGURE 5.

Quantification of RGS9. A, localization of RGS9 in rod and cone membranes. Membrane (ppt) and soluble (sup) fractions obtained from homogenates of purified rods containing 500 pmol of rod pigment and purified cones containing 10 pmol of cone pigments were subjected to SDS-PAGE and were stained with Coomassie Brilliant Blue (CBB) (left panel). A membrane fraction of E. coli expressing RGS9 (RGS9) and that of E. coli expressing S-modulin (S-mod) as a control of the E. coli membrane fraction were also subjected to SDS-PAGE. All of these samples together with a mixture of a rod membrane fraction plus an E. coli RGS9 membrane fraction (rod + RGS9) were subjected to immunoblot analysis (right panel). Although two immunopositive bands were detected in the E. coli RGS9 lane, the band of higher molecular mass (arrowhead) was found to be a nonspecific band derived from the E. coli membrane itself, and the band at ∼56 kDa (arrow) was found to be the signal of expressed RGS9 (compare the bands in the lanes of RGS9 and S-mod). In accordance with this notion, a mixture of a rod ppt fraction and the E. coli RGS9 membrane fraction (rod + RGS9) gave a single band at ∼56 kDa. (The amounts of fractions applied in this mixture were both 1/4 of the original rod ppt and E. coli RGS9 fraction shown in other lanes.) B, immunoblot quantification of RGS9 in rod membranes (left panel) and in cone membranes (right panel). Two independent rod membrane samples containing 1 nmol of rod pigment and known amounts of recombinant RGS9 were probed with anti-RGS9 antiserum (upper left panel). A similar study was made for cone membranes containing 10 pmol of cone pigment (upper right panel). The content of RGS9 in rod (lower left panel) and that in cone (lower right panel) membranes were determined from each calibration curve. ○ and △ represent the signals obtained from known amounts of expressed RGS9, and ● and ▴ together with the arrows indicate the signals from rod (left panel) and cone (right panel) membranes. C, localization of RGS9 to the outer segment portion in cones. RGS9 was quantified with an immunoblot analysis in a portion of a purified cone sample, and the molar ratio of RGS9 to visual pigment was determined. This quantified result was used as the RGS9 content in the starting material. In other portions, we prepared cone samples having a different outer segment (COS) versus inner segment (CIS) ratio. The amount of the RGS9/pigment ratio was quantified in each sample, normalized to the content in the starting material, and plotted against the COS/CIS ratio.
We then quantified the amount of RGS9 molecules expressed in rods and cones with use of recombinant RGS9 as a molar standard (Fig. 5B). The result showed that the molar ratio of RGS9 to visual pigment was 0.0011 ± 0.0004 (mean ± S.E., n = 5) in rods. This level was consistent with the RGS9/rhodopsin ratio of 0.006–0.0016 in mouse and bovine reported previously (4, 16). In cones, the ratio was 0.025 ± 0.0024 (n = 8), which is 1.6 times higher than the ratio estimated in cone-dominant chipmunk retina (16).
Distribution of RGS9 in Cones
It has been shown immunohistochemically that RGS9 is mostly localized in the OS both in rods and cones (15, 16). However, their immunopositive signals were found in the cone inner segment (CIS) (15). Because our purified cones retain a portion of inner segment (IS) (for example, see Fig. 1A in Ref. 3), we tried to know the concentration of RGS9 in the OS. For this purpose, we prepared cone membrane samples having different OS/IS ratios (COS/CIS). The amounts of RGS9 were quantified in these samples and are expressed as the molar ratio to visual pigment present in the sample. The RGS9/pigment ratio thus determined was plotted as a function of the COS/CIS ratio (Fig. 5C). The result showed that the RGS9/pigment ratio did not depend on the COS/CIS ratio. Because visual pigment is present only in the OS, the constant RGS9/pigment ratio irrespective of the COS/CIS ratio in Fig. 5C indicated that RGS9 in our isolated cones is almost exclusively distributed in the OS. This conclusion is consistent with a previous report (15) that RGS9 in the cone IS is distributed at the basal part of ellipsoid and at the synaptic terminal, both of which our purified cones are devoid of. Assuming that the pigment concentration is 3 mm (14), from our quantification in Fig. 5B, RGS9 concentration in the cone OS was calculated to be ∼75 μm, which is > 20 times higher than the RGS9 concentration in the rod OS (3.3 μm). On the basis of the quantified amount of transducin in the OS in rods and cones (Fig. 4A), the molar ratio of transducin to RGS9 is 85:1 (0.28 mm/3.3 μm) in rods and 2.3:1 (0.17 mm/75 μm) in cones.
DISCUSSION
In this study, we showed that in cone membranes the rate of transducin activation was 5 times lower (Fig. 2, A and B); that transducin activation terminated very quickly (Fig. 4B); that GTP hydrolysis, and thus the inactivation of Tr*, was 25 times faster when all of the transducin molecules were activated (Fig. 4B); and that rod transducin behaves like cone transducin to some extent in cone membranes (Fig. 2, C and D, and Fig. 4, C and D). It was suggested that the faster GTP hydrolysis in cones is due to a > 20 times higher expression level of RGS9 in the cone OS (Fig. 5).
Lower Efficiency of Transducin Activation in Cones
In this study, the rate of transducin activation in cones was 30 Tr*/R*-sec (Fig. 2B) and was 5 times lower than that in rods (143 Tr*/R*-sec). In a recent study, it was found that the concentration of transducin is linearly related to the activation efficiency of transducin by R* (18). As shown in Fig. 4A, cone transducin is about 2 times less abundant in cones than in rods. When this difference in the expression level of transducin is taken into account, about a half of the 5 times lower rate of transducin activation in cones is due to the decreased level of transducin in cones.
In the presence of ATP, termination of transducin activation was greatly facilitated in both rods and cones (Fig. 2, A and B). The effect of ATP could be mainly attributed to visual pigment phosphorylation, a quench mechanism of R*. Generally, the rate of phosphorylation per R* decreases when more pigment is bleached (5). The bleach level was 30 times higher in the study in cone membranes than in rod membranes in this study (0.25% bleach in cones versus 0.0085% bleach in rods). Nonetheless, in the presence of ATP, termination of transducin activation was much faster in cones (< 0.125 s, Fig. 2B) than in rods (∼10 s, A) after a light flash. This result shows that visual pigment phosphorylation is much more effective in cone membranes. This higher effect of ATP and, thus, very effective visual pigment phosphorylation in cone membranes is probably due to 100 times higher activity of visual pigment kinase in cones than in rods (6). This is the first biochemical demonstration of the effect of visual pigment phosphorylation on the termination of transducin activation in cones.
Determinant of Less Efficient Transducin Activation in Carp Cones
With mathematical analysis, Pugh and Lamb (19) formulated the amplification constant as an index of the degree of amplification in the activation step of phototransduction cascade. Their conclusion was that mammalian rods and cones do not differ greatly in their amplification constant, whereas in amphibian photoreceptors, the constant seems to be lower in cones when a volume effect is taken into account. Our present study did show that the activation efficiency of transducin is lower in carp cones than in carp rods. One possible mechanism that accounts for this difference in carp could be the difference in the lipid composition between rods and cones (20) because lipid composition is known to affect the reactions in the phototransduction cascade (21, 22). Further study is required on this issue.
Higher Efficiency of Transducin Inactivation in Cones
Under the condition that all of the transducin molecules are activated, the rate of GTP hydrolysis in cone membranes was 2.1 Pi/Tr*-sec and was ∼25 times higher than that in rod membranes (0.082 Pi/Tr*-sec). GTP hydrolysis is known to be accelerated by a GAP protein, RGS9. A higher expression level of RGS9 in cones has been shown immunohistochemically (15), and in cone-dominant chipmunk retina, its expression level has been reported to be 10 times higher than that in other rod-dominant retinas (16). We quantified RGS9 in the rod and the cone OS, and the results showed that the concentration of RGS9 was ∼20 times higher in the cone OS than in the rod OS. The higher GTP hydrolytic activity in cones (Fig. 4B) is probably due to this higher expression level of RGS9.
When exogenous rod Tr* was added to rod and cone membranes, initial rates of GTP hydrolysis per transducin present was lower than the rate observed in endogenous rod or cone Tr* (70% in rod membranes and 46% in cone membranes (Fig. 4, C and D, respectively)). It is not known whether exogenously added rod transducin hydrolyzes GTP at the same rate as that of endogenous rod transducin, even in rod membranes. However, because the decrease in the averaged rate of GTP hydrolysis was only reduced to 70%, probably we are allowed to assume that exogenous rod Tr* behaves like endogenous rod Tr in rod membranes. Under this assumption we could estimate the hydrolytic activity of RGS9-free form of rod Tr* and that of RGS9-bound form of rod Tr*. In native rod membranes, the Tr/RGS9 ratio was 85:1 (Fig. 5), and the hydrolytic activity of Tr* was 0.082 Pi/Tr*-sec (Fig. 4B). When exogenous rod Tr was added at the molar ratio of 2:1 to the endogenous rod Tr (Tr/RGS9 = 255/1 in Fig. 4C), the activity was 0.057 Pi/Tr*-sec. Under the assumption that all of the RGS9 molecules bind to Tr*, a simple calculation gave the activity of 0.045 Pi/Tr*-sec for RGS9-free form of Tr* and 3.2 Pi/Tr*-sec for RGS9-bound form of Tr*. These rates are broadly similar to those measured in recombinant RGS9 (0.022 Pi/Tr*-sec and 1.04 Pi/Tr*-sec, respectively, in Ref. 4). Because the rate of GTP hydrolysis varies from 0.045 to 3.2 Pi/Tr*-sec, depending on the population of the RGS9-bound form of Tr* and, thus, the light-intensity, the time constant of GTP hydrolysis varies from 0.31 s (1/3.2) to 22 s (1/0.045). This range of variation may explain the light-intensity dependent increase in the dominant time constant, an index of the recovery phase of a light response (approximately, 0.5–10 s of the constant was observed under the conditions where rod light responses could be reversibly measured, Refs.18, 23).
We tried to estimate the GTP hydrolytic activity of RGS9-free and RGS9-bound form of cone Tr*. However, the activity of RGS9-free form of rod Tr* estimated above was too low to explain the rate (0.96 Pi/Tr*-sec) measured in cone membranes in the presence of exogenous rod transducin. It seemed that in cone membranes, the RGS9-free form of rod Tr* shows a GTP hydrolytic activity higher than that in rod membranes. Because there were many unknown factors, such as the difference in the binding affinity of RGS9 between rod and cone transducin, further analysis was not made.
In this study, we showed that termination of transducin activation by visual pigment phosphorylation (Fig. 2B) and inactivation of transducin (Fig. 4B) are much faster in cones. In addition, we showed previously that cGMP synthesis is much more efficient in cones than in rods (7). All these very effective inactivation mechanisms contribute not only to shorten a light response but also to reduce the dark noise in cones even though visual pigment is spontaneously activated in these cells (24). These effective inactivation mechanisms, together with lower efficiency of transducin activation, seem to explain low light-sensitivity and a brief light response in cones.
Acknowledgment
We thank Dr. Y. Wada for helpful discussions.
This work was supported by Japan Society for the Promotion of Science Grants 20370060 and 23227002 (to S. K.) and 222770150 and 24570085 (to S. T.), by a Human Frontier Science Program grant (to S. K.), and by the Naito Foundation (to S. T.).
- R
- visual pigment
- AMP-PNP
- adenosine 5′-(β, γ-imido)triphosphate
- GAP
- GTPase accelerating protein
- Pi
- inorganic phosphate
- Tr
- transducin
- Tr*
- activated transducin
- R*
- activated visual pigment
- PDE
- cGMP phosphodiesterase
- GTPγS
- guanosine-5′-(γ-thio)triphosphate
- OS
- outer segment
- IS
- inner segment
- COS
- cone outer segment
- CIS
- cone inner segment.
REFERENCES
- 1. Burns M. E., Arshavsky V. Y. (2005) Beyond counting photons. Trials and trends in vertebrate visual transduction. Neuron 48, 387–401 [DOI] [PubMed] [Google Scholar]
- 2. Fu Y., Yau K. W. (2007) Phototransduction in mouse rods and cones. Pflugers Arch. 454, 805–819 [DOI] [PMC free article] [PubMed] [Google Scholar]
- 3. Kawamura S., Tachibanaki S. (2008) Rod and cone photoreceptors. Molecular basis of the difference in their physiology. Comp. Biochem. Physiol. A Mol. Integr. Physiol. 150, 369–377 [DOI] [PubMed] [Google Scholar]
- 4. He W., Cowan C. W., Wensel T. G. (1998) RGS9, a GTPase accelerator for phototransduction. Neuron 20, 95–102 [DOI] [PubMed] [Google Scholar]
- 5. Tachibanaki S., Tsushima S., Kawamura S. (2001) Low amplification and fast visual pigment phosphorylation as mechanisms characterizing cone photoresponses. Proc. Natl. Acad. Sci. U.S.A. 98, 14044–14049 [DOI] [PMC free article] [PubMed] [Google Scholar]
- 6. Tachibanaki S., Arinobu D., Shimauchi-Matsukawa Y., Tsushima S., Kawamura S. (2005) Highly effective phosphorylation by G protein-coupled receptor kinase 7 of light-activated visual pigment in cones. Proc. Natl. Acad. Sci. U.S.A. 102, 9329–9334 [DOI] [PMC free article] [PubMed] [Google Scholar]
- 7. Takemoto N., Tachibanaki S., Kawamura S. (2009) High cGMP synthetic activity in carp cones. Proc. Natl. Acad. Sci. U.S.A. 106, 11788–11793 [DOI] [PMC free article] [PubMed] [Google Scholar]
- 8. Miyazono S., Shimauchi-Matsukawa Y., Tachibanaki S., Kawamura S. (2008) Highly efficient retinal metabolism in cones. Proc. Natl. Acad. Sci. U.S.A. 105, 16051–16056 [DOI] [PMC free article] [PubMed] [Google Scholar]
- 9. Tachibanaki S., Imai H., Mizukami T., Okada T., Imamoto Y., Matsuda T., Fukada Y., Terakita A., Shichida Y. (1997) Presence of two rhodopsin intermediates responsible for transducin activation. Biochemistry 36, 14173–14180 [DOI] [PubMed] [Google Scholar]
- 10. Cowan C. W., Wensel T. G., Arshavsky V. Y. (2000) Enzymology of GTPase acceleration in phototransduction. Methods Enzymol. 315, 524–538 [DOI] [PubMed] [Google Scholar]
- 11. Shimauchi-Matsukawa Y., Aman Y., Tachibanaki S., Kawamura S. (2008) Identification of differentially expressed genes in carp rods and cones. Mol. Vis. 14, 358–369 [PMC free article] [PubMed] [Google Scholar]
- 12. Ala-Laurila P., Kolesnikov A. V., Crouch R. K., Tsina E., Shukolyukov S. A., Govardovskii V. I., Koutalos Y., Wiggert B., Estevez M. E., Cornwall M. C. (2006) Visual cycle. Dependence of retinol production and removal on photoproduct decay and cell morphology. J. Gen. Physiol. 128, 153–169 [DOI] [PMC free article] [PubMed] [Google Scholar]
- 13. Golobokova E. Y., Govardovskii V. I. (2006) Late stages of visual pigment photolysis in situ. Cones vs. rods. Vision Res. 46, 2287–2297 [DOI] [PubMed] [Google Scholar]
- 14. Hárosi F. I. (1975) Absorption spectra and linear dichroism of some amphibian photoreceptors. J. Gen. Physiol. 66, 357–382 [DOI] [PMC free article] [PubMed] [Google Scholar]
- 15. Cowan C. W., Fariss R. N., Sokal I., Palczewski K., Wensel T. G. (1998) High expression levels in cones of RGS9, the predominant GTPase accelerating protein of rods. Proc. Natl. Acad. Sci. U.S.A. 95, 5351–5356 [DOI] [PMC free article] [PubMed] [Google Scholar]
- 16. Zhang X., Wensel T. G., Kraft T. W. (2003) GTPase regulators and photoresponses in cones of the Eastern chipmunk. J. Neurosci. 23, 1287–1297 [DOI] [PMC free article] [PubMed] [Google Scholar]
- 17. Hu G., Wensel T. G. (2002) R9AP, a membrane anchor for the photoreceptor GTPase accelerating protein, RGS9-1. Proc. Natl. Acad. Sci. U.S.A. 99, 9755–9760 [DOI] [PMC free article] [PubMed] [Google Scholar]
- 18. Vogalis F., Shiraki T., Kojima D., Wada Y., Nishiwaki Y., Jarvinen J. L., Sugiyama J., Kawakami K., Masai I., Kawamura S., Fukada Y., Lamb T. D. (2011) Ectopic expression of cone-specific G-protein-coupled receptor kinase GRK7 in zebrafish rods leads to lower photosensitivity and altered responses. J. Physiol. 589, 2321–2348 [DOI] [PMC free article] [PubMed] [Google Scholar]
- 19. Pugh E. N., Jr., Lamb T. D. (1993) Amplification and kinetics of the activation steps in phototransduction. Biochim. Biophys. Acta 1141, 111–149 [DOI] [PubMed] [Google Scholar]
- 20. Rodriguez de Turco E. B., Gordon W. C., Bazan N. G. (1991) Rapid and selective uptake, metabolism, and cellular distribution of docosahexaenoic acid among rod and cone photoreceptor cells in the frog retina. J. Neurosci. 11, 3667–3678 [DOI] [PMC free article] [PubMed] [Google Scholar]
- 21. Niu S. L., Mitchell D. C., Lim S. Y., Wen Z. M., Kim H. Y., Salem N., Jr., Litman B. J. (2004) Reduced G protein-coupled signaling efficiency in retinal rod outer segments in response to n-3 fatty acid deficiency. J. Biol. Chem. 279, 31098–31104 [DOI] [PubMed] [Google Scholar]
- 22. Alves I. D., Salgado G. F., Salamon Z., Brown M. F., Tollin G., Hruby V. J. (2005) Phosphatidylethanolamine enhances rhodopsin photoactivation and transducin binding in a solid supported lipid bilayer as determined using plasmon-waveguide resonance spectroscopy. Biophys. J. 88, 198–210 [DOI] [PMC free article] [PubMed] [Google Scholar]
- 23. Pepperberg D. R., Cornwall M. C., Kahlert M., Hofmann K. P., Jin J., Jones G. J., Ripps H. (1992) Light-dependent delay in the falling phase of the retinal rod photoresponse. Vis. Neurosci. 8, 9–18 [DOI] [PubMed] [Google Scholar]
- 24. Rieke F., Baylor D. A. (2000) Origin and functional impact of dark noise in retinal cones. Neuron 26, 181–186 [DOI] [PubMed] [Google Scholar]