Abstract
Background & objectives:
Income inequality is associated with poor health. Inequities exist in service utilization and financing for health care. Health care costs push high number of households into poverty in India. We undertook this study to ascertain inequities in health status, service utilization and out-of-pocket (OOP) health expenditures in two States in north India namely, Haryana and Punjab, and Union Territory of Chandigarh.
Methods:
Data from National Sample Survey 60th Round on Morbidity and Health Care were analyzed by mean consumption expenditure quintiles. Indicators were devised to document inequities in the dimensions of horizontal and vertical inequity; and redistribution of public subsidy. Concentration index (CI), and equity ratio in conjunction with concentration curve were computed to measure inequity.
Results:
Reporting of morbidity and hospitalization rate had a pro-rich distribution in all three States indicating poor utilization of health services by low income households. Nearly 57 and 60 per cent households from poorest income quintile in Haryana and Punjab, respectively faced catastrophic OOP hospitalization expenditure at 10 per cent threshold. Lower prevalence of catastrophic expenditure was recorded in higher income groups. Public sector also incurred high costs for hospitalization in selected three States. Medicines constituted 19 to 47 per cent of hospitalization expenditure and 59 to 86 per cent OPD expenditure borne OOP by households in public sector. Public sector hospitalizations had a pro-poor distribution in Haryana, Punjab and Chandigarh.
Interpretation & conclusions:
Our analysis indicates that public sector health service utilization needs to be improved. OOP health care expenditures at public sector institutions should to be curtailed to improve utilization of poorer segments of population. Greater availability of medicines in public sector and regulation of their prices provide a unique opportunity to reduce public sector OOP expenditure.
Keywords: Equity, hospitalization expenditure, India, service utilization, user charges
Socio-economic inequalities in health status have been defined as “Differences in the prevalence or incidence of health problems between individual people of higher or lower socioeconomic status”1. Inequalities which are socially unjust are considered to be inequitable2. International Society for Equity in Health (ISEqH) defines equity as “the absence of systematic and potentially remediable differences in one or more aspect of health across populations of population subgroups defined socially, economically, demographically, or geographically”3.
Two dimensions of health inequities have been quoted in literature i.e. horizontal and vertical. The former emphasizes treating equals equally, and focuses on equal access for those in equal need. It ensures that provision of health service should be based on the principle of ‘need’ and not on the ‘ability to pay’. Vertical equity highlights the need to treat unequals differently, i.e. richer should pay a higher proportion of their income for accessing health care services compared to poor4. Another dimension of ‘redistribution’ is added to this two-fold typology, which ascertains who gets the benefits of public subsidy and to what extent.
Differences in health status based on income, gender, educational status, geographic region and occupation have been documented in India which show association of poor health with poverty, female gender, poor educational status and rural residence5–7. Besides inequalities in health status, there are differences in access and utilization of health care services between different population groups with lowest income quintile of population utilizing 10 per cent of public subsidy as against 33 per cent by the richest quintile8. Nearly 72 per cent of total health expenditure (THE) is borne out-of-pocket (OOP) by the households9. OOP health care costs led to impoverishment of about 32.5 million people in 1999-2000 amounting to 3.2 per cent increase in overall poverty head-count10.
The objective of the present study was to ascertain inequities in self-reported health status, service utilization, and OOP health care expenditure in two States of Haryana and Punjab, and Union Territory of Chandigarh in north India. Henceforth, for convenience the term ‘State’ is used for all three regions. Inequities are ascertained in three dimensions i.e. horizontal, vertical and redistribution.
Global evidence favours the Kuznets hypothesis which states that the inequality follows an inverted ‘U’ shaped curve in relation to country's gross domestic product (GDP)11. This assumes greater significance in Indian context, which is in a phase of rapid economic growth. The States of Haryana, Punjab and Union Territory of Chandigarh stand among the richest Indian States with highest per capita GDP. So we considered analyzing health service utilization data from these three States with high overall income levels, in order to explore health service utilization and health payments from an equity lens. Past studies have focused on particular aspects of either health status, or service delivery or OOP expenditure12–14. However, we have included all three dimensions of health equity.
Material & Methods
Data sources: The data collected by the National Sample Survey Organization (NSSO) in its 60th Round (2004) on “Morbidity and Health Care”7 were used for analysis. OOP expenditure for both hospitalization and out patient department consultation (OPD; consultation in a clinic/hospital setting without admission/hospitalization) was recorded. Detailed expenditure was available for drugs (both available from institution and purchased from pharmacy); diagnostic tests (including ECG, X-ray, pathological tests, etc.); professional fee for doctor; payments to hospital/institution; and other expenditures. Detailed household consumption expenditure was elicited, besides other socio-demographic correlates including caste, occupation, gender and education. Data were also collected on type of facility accessed for medical care. Reasons for those who did not seek care were also elicited.
NSS data were collected over two sub-rounds, wherein the recall period for inpatient expenditure and for outpatient use was 365 and 15 days, respectively. Consumption expenditure was collected for a recall period of 1 month. There could be biases in the aggregation of consumption expenditure and outpatient expenditure to the annual level, which has been done for the purpose of computing catastrophic expenditure.
The 60th NSS round covered 10,072 villages and sampled 47302 and 26566 households in rural and urban areas, respectively. The present analysis was restricted to the States of Haryana and Punjab and Union Territory of Chandigarh, in which 1400, 1492 and 413 households were sampled, respectively7.
Study indicators for equity: Indicators used for assessing inequities in health status, health service utilization and OOP health expenditure are shown in Table I. OOP expenditure amounting to 10 per cent of annual consumption expenditure was termed as ‘catastrophic’15. Unmet need was ascertained as the number of persons who did not access medical care for an episode of illness in past 15 days, due to inadequate access, or financial reasons or any other reason. Those who did not consider it necessary to seek care i.e. those with poor health care seeking behaviour were excluded.
Table I.
Dimensions of equity and indicators used for analysis
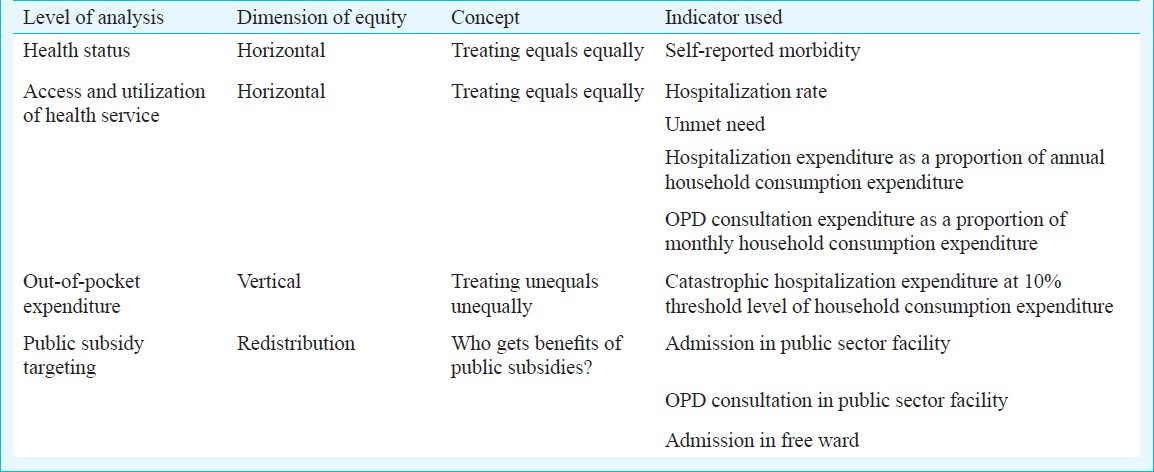
Data analysis: Study population in these States was divided into quintile groups based on monthly per capita consumption expenditure (MPCE). Household consumption expenditure was adjusted for age and composition using the OECD (Organization for Economic Co-operation and Development) equivalence scale, according to which W=H/(1+0.7 (Na-1)+0.5Nc), where W and H are the monthly per capita consumption expenditure and total household consumption expenditure, respectively; and Na and Nc are the number of adults and children, respectively16. Mean values for all indicators were estimated across each of the five MPCE quintiles. Mean hospitalization expenditure was estimated for those who reported hospitalization in each quintile.
Benefit incidence analysis was done for health service utilization. Concentration indices were computed for each indicator to provide a composite measure of inequities. Concentration index ranges from +1 to -1; with positive (negative) value suggesting pro-rich (poor) distribution. Certain simple measures such as equity ratio (ratio of poorest and richest quintile) are also presented. Concentration index, which summarizes inequities across all quintiles, can be misleading as it may add positive and negative values17. Hence we used concentration index in conjunction with concentration curves. The t-test was used to evaluate the difference of means between the richest and poorest quintile; while Chi-square test for trend was used to test statistical significance in per cent data between quintiles. Data analysis was done in SPSS 13.0 while concentration indices and curves were computed in Microsoft EXCEL. The study protocol was approved by the Ethics Review Committee of the London School of Hygiene and Tropical Medicine, London, UK.
Results
Overall nearly 10 per cent population in Haryana and Chandigarh reported any morbidity in the last 15 days, while the morbidity rate was 13.1 per cent in Punjab (Table II). Self reported morbidity has a pro-rich distribution in all the study States, with higher proportion of richer quintiles of population reporting illness in past 15 days of interview. Equity ratio was found to be 0.53 in Haryana and Chandigarh while 0.43 in Punjab.
Table II.
Self-reported morbidity, hospitalizations and unmet need for health-care by income quintile in States in north India
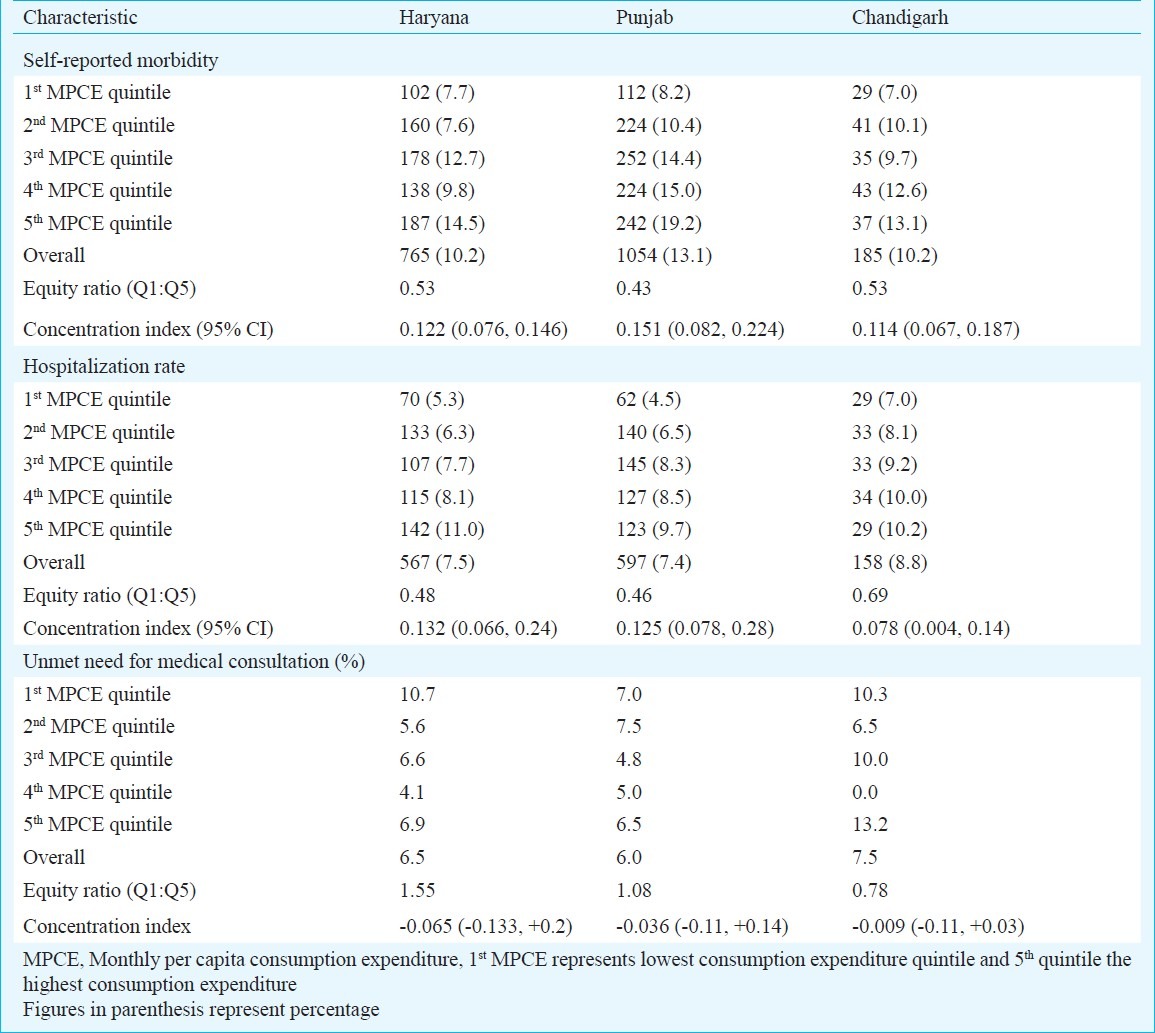
The hospitalization rate varied between 7.4 and 8.8 per cent in the three States. It was higher in richer quintiles with an equity ratio (Q1:Q5) of 0.48 in Haryana and 0.46 Punjab, and 0.69 in Chandigarh. Statistically significant positive concentration index suggested a pro-rich distribution. Concentration curves for hospitalizations and self-reported morbidity showed dominance over line of equality in all three States (Fig. 1a–c and Fig. 2a–c). Our analysis showed that unmet need had a pro-poor distribution in all three States with negative concentration indices, which was however, statistically not signifcant (Table II).
Fig. 1.
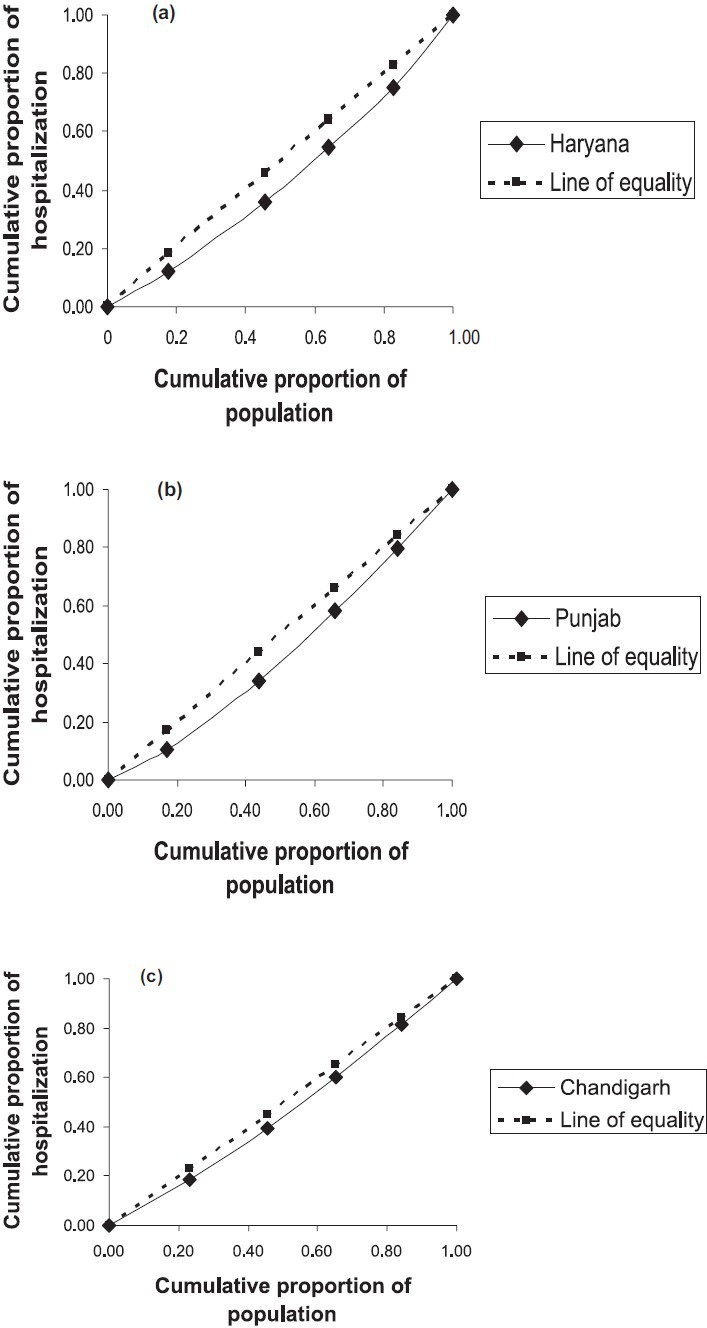
Concentration curves for hospitalization service utilization in the States in north India.
Fig. 2.
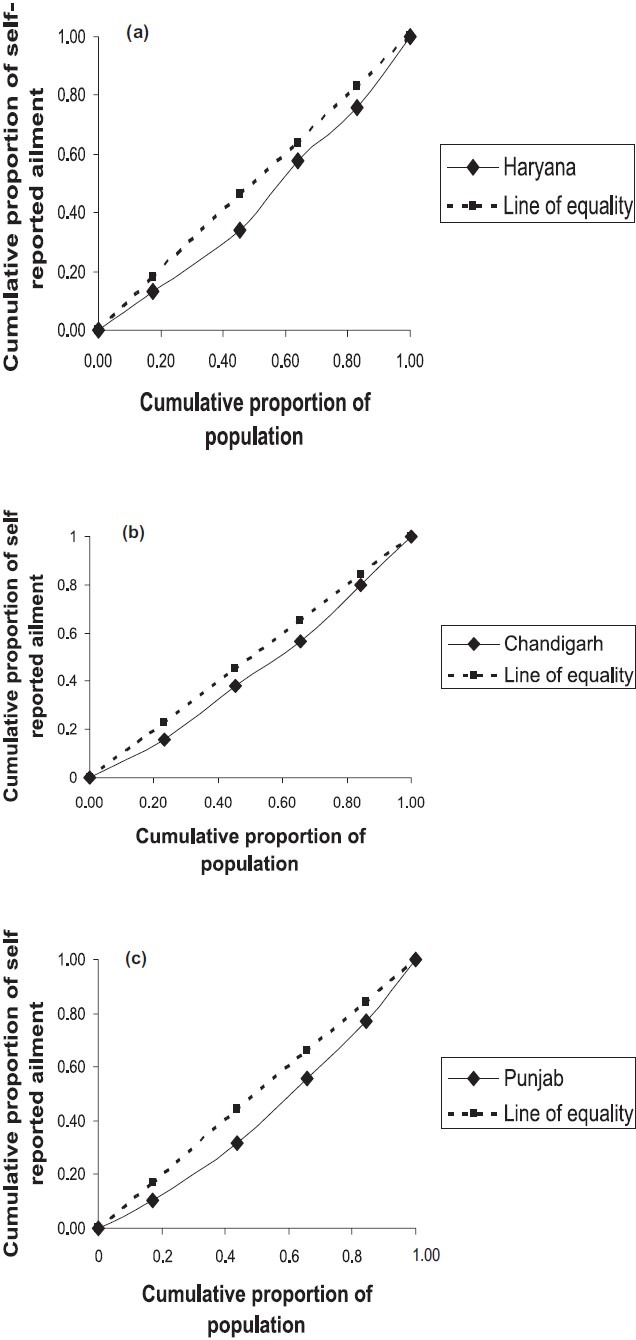
Concentration curves for self reported ailments in last 15-days in States in the north India.
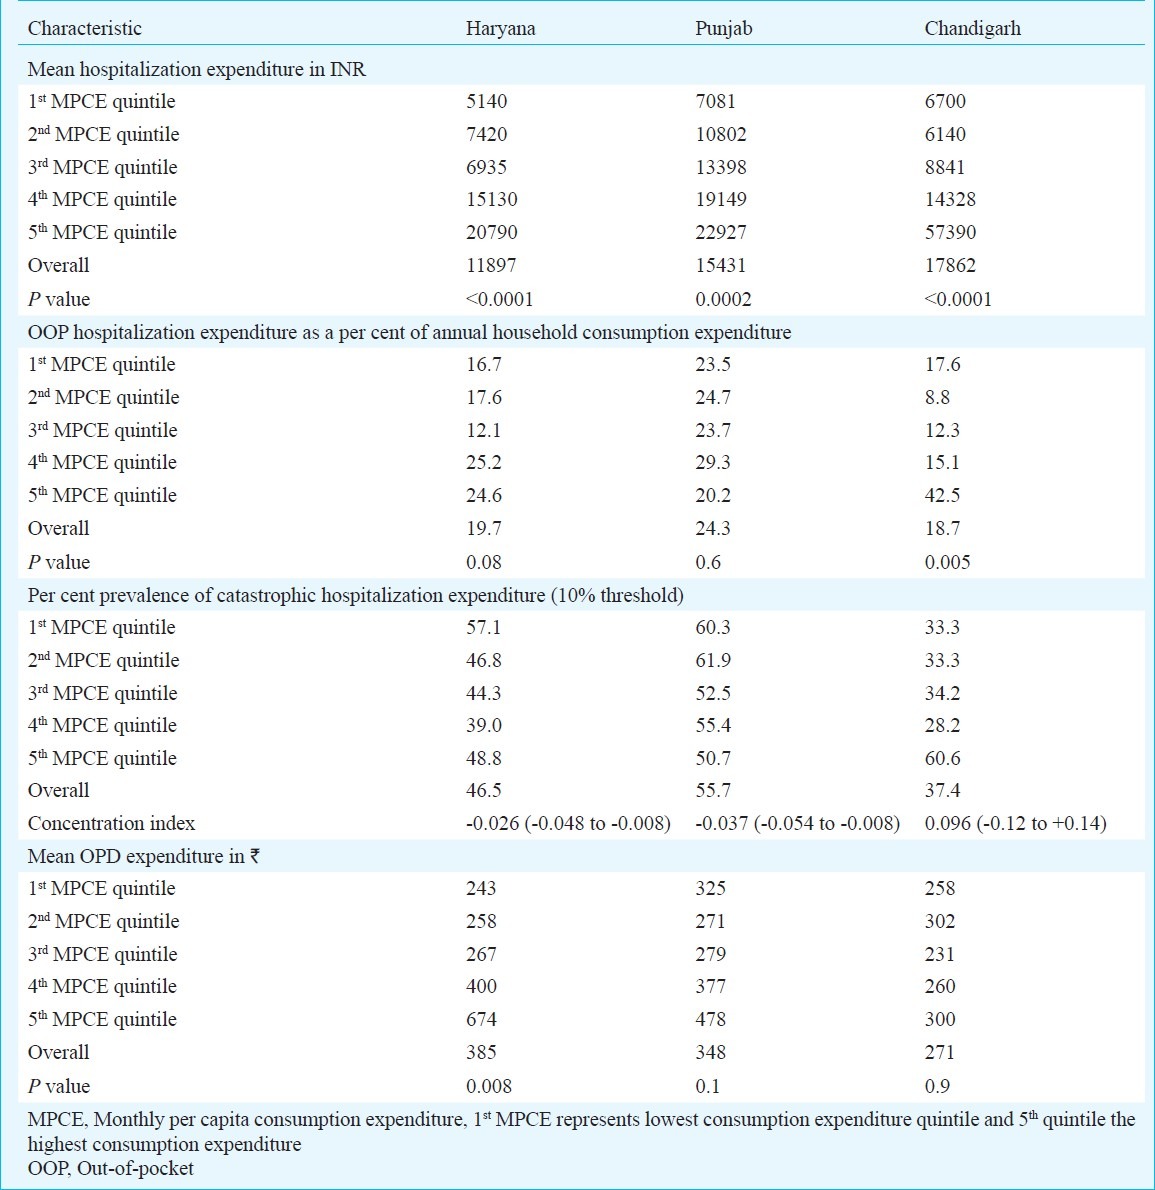
Mean hospitalization expenditure among the richest quintile was 4.0, 3.2 and 8.6 times higher than the poorest quintile in Haryana, Punjab and Chandigarh, respectively which was statistically significant (Table III). OOP expenditure in three States reflected a progressive pattern with the rich spending more as a proportion of income than the poor. However, this result needs further discussion and cautious interpretation. Overall, Chandigarh had lower prevalence of catastrophic expenditure, which did not vary significantly with wealth status. Punjab and Haryana, on the contrary, had a higher prevalence of catastrophic expenditure among the poorer quintiles with a pro-poor distribution of concentration index, which was statistically significant (P<0.05). Mean out-of-pocket OPD expenditure in Haryana was lowest among the poorest quintile with a statistically significant rising trend towards the richer income quintiles (P=0.008). Punjab and Chandigarh had a non-uniform trend of OPD expenditure (Table III).
Table III.
Vertical equity in out-of-pocket hospitalization expenditures in States in north India
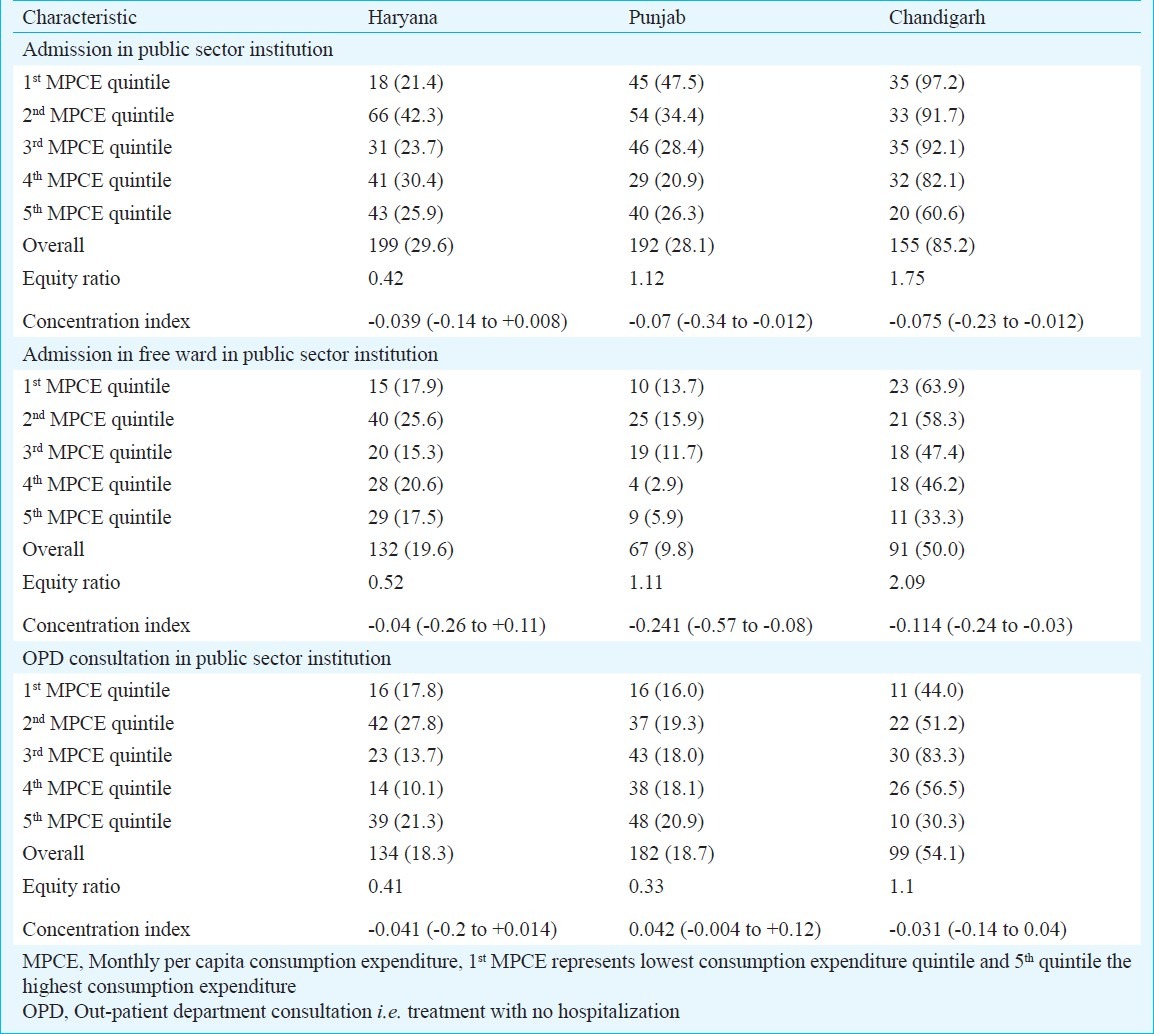
Among the three indicators of public subsidy i.e. admission in public sector hospital and admission in free ward of public sector hospital had a statistically significant pro-poor utilization in Punjab and Chandigarh (Table IV). Hospitalizations in public sector facilities in Haryana did not show a significant association with wealth status. Although the out-patient consultations in public sector facilities of Haryana and Chandigarh were utilized more by the poor, there was a statistically insignificant relationship with wealth status. Similarly OPD consultation in public sector facilities was not significantly related with wealth status in Punjab.
Table IV.
Targeting of public subsidy for health care in States in north India
Mean private sector OOP hospitalization expenditure in Haryana, Punjab and Chandigarh was 1.6, 1.2 and 4.2 times respectively higher than the public sector (Table V). Medicines accounted for 32.6, 19 and 46.8 per cent of public sector OOP hospitalization expenditure in Haryana, Punjab and Chandigarh, respectively. Medicine expenditure constituted 59, 64 and 86 per cent of total OPD expenditure in Haryana, Punjab and Chandigarh respectively (data not tabulated). Overall, medicine expenditure constituted higher proportion of OOP expenditure in public sector in all three States.
Table V.
Out-of-pocket hospitalization expenditure characteristics in public and private sector in States in north India
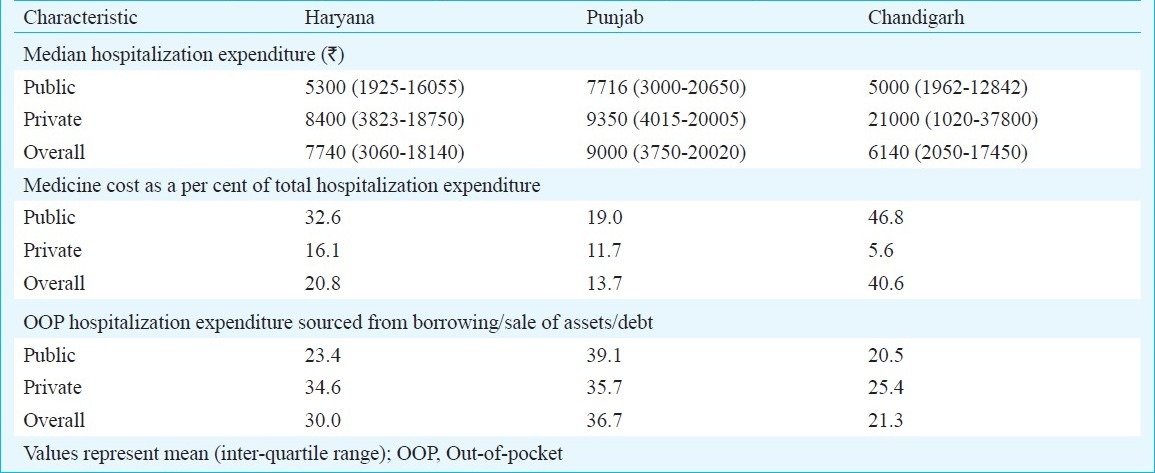
More than one fifth hospitalization expenditure in all three States was sourced by households through either borrowing, selling of assets or sources other than their regular income or savings (Table V). This proportion was lesser among public than the private sector in Haryana and Chandigarh. Punjab, however, reported higher prevalence of OOP hospitalization expenditure being sourced from borrowing/debt/sale of assets.
Discussion
In the present study the National Sample Survey (NSS) 60th Round data collected from Haryana, Punjab and Chandigarh conducted in 2004, were analysed which ascertained inequities in self-reported morbidity, health service utilization, health care OOP expenditures and public subsidy utilization. Overall the results showed that the hospitalizations were utilized more by the rich in all three States. Besides having lower hospitalization rate, the poor had higher unmet need. High OOP expenditure serves as a deterrent to poor households. This high OOP expenditure persisted even in the public sector. Contrary to a previous study8, our results suggest that utilization of public sector has started to show a pro-poor distribution. However, the possibility that higher utilization of public sector can be as a result of inability of the poor to access costly private services cannot be denied. The change in utilization patterns of public sector facilities is an important shift which can be used for advocating greater allocation of resources in public sector. Possible reasons for higher use of public sector cannot be attributed from this study as the NSS survey does not elicit reasons for utilization of a particular health facility.
A major mechanism for reducing OOP expenditures in public sector institutions could be improving availability of drugs at public sector institutions. Theoretically, provision of medicines appears to be the most tangible solution as the evidences from present and past studies show that medicines constitute a major burden of OOP expenditure, especially in public sector hospitals. However, practically this is difficult to implement considering the global evidence in the field of regulation of pharmaceutical sector, attributable to its economic influence18. Haryana State experimented with improved provision of medicines at all hospitals and health centres through its policy on prescription of generic drugs. This policy resulted in a sharp increase in the utilization of public sector facilities19. We have earlier reported that the cost of provision of health care using generic drugs was 40 per cent less than utilizing branded drugs20. Using the example of Tamil Nadu Health systems Corporation and Chittorgarh and Nagaur district models, Srinivasan21 estimated the cost of provision of free medicines at all public sector facilities and suggested this as an achievable target.
The present study takes a holistic view of the inequities ranging from inequities in health status; access and service utilization; OOP expenditures and finally public sector subsidy utilization. The concentration index was used as a composite measure of inequity. However, considering the limitations of index in interpretation, we used it as an adjunct with concentration curve and equity ratio. Haryana, Punjab and Union Territory of Chandigarh have highest per-capita income in the country, ranking among the top five States in India22. These States also rank among the highest per-capita health expenditures in the country with total health expenditures (THE) of  1570, 1530 and 2496 in Haryana, Punjab and Chandigarh, respectively9. Despite high THE, public sector contribution continues to be less than the national average in Haryana and Punjab; with public share being 10, 16 and 33 per cent in Haryana, Punjab and Chandigarh, respectively9. Thus, these States offer an opportunity to study inequities in a situation of high OOP health expenditure in an otherwise relatively wealthy population.
The present study had some methodological and data limitations. Firstly, adjustment to actual utilization rates based on need indicators is often done to determine inequities in health service utilization. However, this was not done in the present study since the self-reported illness rate is biased and there is overwhelming evidence that the illness rate is pro-poor5–7,23–25. The latter has also been endorsed by a larger body of researchers and has also been presented as the explanation in the NSS reports7,26. Data from developed countries show that the wealthier people have better health, which may be measured using objective measures such as life expectancy or rates of morbidity; or through perceived health status as reported by the population27,28. However, situation in relatively poor countries, not only India, shows that the health status when measured through objective measures is found to be worse in poorer households29,30. On the contrary, self reported health status is associated with higher incidence of disease in richer households31. This could be confounded by their understanding of disease and also factors such as tolerance and ability to get treatment. Dror et al29 reported self perceived health status, and found a rather “partial” relationship. This was also evident in other large scale self reported health status surveys7. Moreover, since many illnesses are treated on an OPD basis, self reported illness cannot be used as a proxy for need of hospitalization.
Secondly, consumption expenditure in NSS survey is not differentiated between food and non-food expenditure. Undifferentiated consumption expenditure does not pose much challenge to stratification of population into quintiles of socio-economic status. However, it underestimates prevalence of catastrophic expenditure at the WHO recommended 40 per cent cut-off level for non-food expenditure32. As an alternative, we used a 10 per cent threshold to project more realistic estimates. Even this does not provide accurate estimate of catastrophic expenditure since the expenditure on food as a proportion of total consumption expenditure is higher for poorer households. At the national level in urban India, spending on food is 63 and 35 per cent of total consumption expenditure for poorest and richest quintiles, respectively33. In rural areas, poorest and richest quintiles spend 65 and 48 per cent expenditure on food. Hence the results of the present study for catastrophic expenditure may be an underestimate for the poorer income quintiles and vice versa. Thirdly, due to data limitations, we could not compare benefits arising out of public sector resource use versus the financial burden resulting from a tax-financed public sector on different quintiles. Lastly, NSS data have been collected during two rounds in a year. Thus the morbidity data may have some seasonal determinants.
High OOP expenditure poses financial barriers for the poor people to access health services, especially the high cost hospitalizations. This was reflected in a high unmet need in the present study which had a pro-poor distribution. Access to care has also been shown to be associated with socio-economic status in other studies from developing countries34,35. Both Haryana and Punjab had a pro-poor distribution of catastrophic expenditure at 10 per cent threshold level with an equity ratio (Q1:Q5) of 1.2 each in the two States. This was in contrast to a study from urban Tamil Nadu, which reported a pro-rich distribution of catastrophic expenditure prevalence14. There is an urgent need to remove this financial barrier to access by providing service free of cost at point of delivery. This can be done either through some pre-payment risk-pooling mechanism or by universalizing provision of free service at public sector facilities.
Overall, public sector utilization continued to be low in Haryana and Punjab. Hospitalization and OPD services at public sector facilities were used by less than 30 and 20 per cent population, respectively. This was similar to findings of other studies which have shown low overall public sector utilization13,14. Previous studies from India have cited reasons such as high absenteeism, poor quality of services, rampant corruption and long travel distances as prominent reasons for poor access of public sector facilities36–38. Our study provides an encouraging finding that the utilization of public sector subsidy. This finding is in contrast to a previous study which suggested leakage of public sector subsidy8. A more recent study from urban Tamil Nadu14, in conformity to present study results of a pro-poor distribution of public sector hospitalization and OPD consultations. The present study provides strong justification that further strengthening of public sector would lead to greater benefits being meted out to poor and is likely to reduce inequities in utilization.
The next challenge is to identify how to improve utilization of public sector services? A major hurdle to access for poor households is financial barrier. A major determinant of public sector OOP expenditure is costs incurred for purchase of medicines. Medicines constituted 19 to 47 per cent of hospitalization expenditure and 59 to 86 per cent of OPD expenditure borne by households in public sector institutions in the three States. These findings suggest for an improvement in free drug availability at public sector institutions to reduce OOP expenditure and thereby improve utilization. Going by findings of this study, this policy will reduce OOP expenditure, increase utilization especially for poor and thus reduce inequities. This is not to understate that effort to improve quality and responsiveness in public sector, as argued by others, would also be required36–38.
A systematic deregulation of drugs which has occurred alongside economic liberalization since the 1990s, has greatly contributed to escalating drug costs, and thereby health care expenditures39. Government of India introduced draft Pharmaceutical Policy in 2005, which places high importance on regulation of drug prices for essential drugs and its availability especially for the poorest. However, the categorization of essential drugs still needs to be undertaken by the Government of India14.
The present study presents a progressive OOP financing pattern in health care in three States in north India. Rich spend more as a proportion of their consumption expenditure on health care. This result requires discussion in light of higher unmet need and high catastrophic expenditure among poor. The study results suggest possibility of discouragement of necessary medical care utilization by poor owing to high OOP expenditure. Moreover, as a proportion of income, poor spend more on basic subsistence such as food leaving little for meeting other needs33. Since the NSS data on consumption expenditure do not differentiate between food and non-food expenditure, the study underestimates (overestimates) the values for OOP expenditure as a proportion of consumption expenditure for the poorer (richer) quintiles. Moreover, analysis of NSSO data also shows that length of stay for patients of different income quintiles is positively associated with socio-economic status in Haryana and Chandigarh (data not tabulated). Pattern in Punjab was not uniform.
Considering strong predominance of private sector in service delivery in India, it may not be realistic to expect a turnaround towards public sector in the short-term. In such a situation, as an immediate short-term measure, it is necessary to institutionalize a pre-payment mechanism for the poorer quintiles to protect households from financial catastrophe of private sector hospitalization. Recent innovations of Government of India such as Universal Health Insurance Scheme (Rashtriya Swasthya Bima Yojana) need to be re-vitalized. State specific innovations, such as Surgery Package Programme of Haryana to provide subsidized, fixed-cost and affordable surgeries need to be reviewed for their equity impact40.
In conclusion, the present analysis indicates strengthening of public sector health facilities. Escalating medicine costs need to be regulated and availability of medicines at public sector should be improved to reduce OOP expenditure in public sector facilities. Bearing in mind evidence of pro-poor distribution of public sector subsidy utilization, initiatives to improve utilization of public sector services are likely to reduce inequities in health service utilization and financing. User charges are regressive and would require careful implementation to protecting the interests of poor against catastrophic illness expenditure.
Acknowledgment
The authors acknowledge financial assistance from LSE Health, London School of Economics in obtaining NSSO data.
References
- 1.Kunst AE, Mackenbach JP. Copenhagen: World Health Organization Regional Office for Europe; 1995. Measuring socio-economic inequalities in health. [Google Scholar]
- 2.Kawachi I, Subramanian SV, Almeida-Filho N. A glossary for health inequalities. J Epidemiol Community Health. 2002;56:647–52. doi: 10.1136/jech.56.9.647. [DOI] [PMC free article] [PubMed] [Google Scholar]
- 3.ISEH. Working definitions: International Society for Equity in Health. 2001 [Google Scholar]
- 4.Wagstaff A, van Doorslaer E, van der Burg H, Calonge S, Christiansen T, Citoni G, et al. Equity in the finance of health care: some further international comparisons. J Health Econ. 1999;18:263–90. doi: 10.1016/s0167-6296(98)00044-7. [DOI] [PubMed] [Google Scholar]
- 5.New Delhi: Registrar General of India; 2006. SRS. Sample Registration Survey Bulletin. [Google Scholar]
- 6.Mumbai: International Institute of Population Sciences and ORG Macro; 2006. IIPS. National Family Health Survey 3. [Google Scholar]
- 7.New Delhi: Ministry of Statistics and Program Implementation, Government of India; 2006. NSSO. Morbidity, health care and condition of the aged. [Google Scholar]
- 8.Mahal A, Yazbeck AS, Peters DH, Ramana GNV. Washington, DC: The World Bank; 2001. The poor and health service use in India. [Google Scholar]
- 9.New Delhi: National Health Accounts Cell, Ministry of Health and Family Welfare, Government of India; 2005. National Health Accounts India. [Google Scholar]
- 10.van Doorslaer E, O’Donnell O, Rannan-Eliya RP, Somanathan A, Adhikari SR, Garg CC, et al. Effect of payments for health care on poverty estimates in 11 countries in Asia: an analysis of household survey data. Lancet. 2006;368:1357–64. doi: 10.1016/S0140-6736(06)69560-3. [DOI] [PubMed] [Google Scholar]
- 11.Nielson F, Alderson A. The Kuznets Curve and the Great U-Turn: Income Inequality in U.S. Counties, 1970 to 1990. Am Sociol Rev. 1997;62:12–33. [Google Scholar]
- 12.Dror M, Putten-Rudermacher O, Koren R. Incidence of illness among resource-poor households: Evidence from five locations in India. Indian J Med Res. 2009;130:146–54. [PubMed] [Google Scholar]
- 13.Levesque J-F, Haddad S, Narayana D, Fournier P. Outpatient care utilization in urban Kerala, India. Health Policy Planning. 2006;21:289–301. doi: 10.1093/heapol/czl013. [DOI] [PubMed] [Google Scholar]
- 14.Vaishnavi SD, Dash U. Castastrophic payments for care among households in urban Tamil Nadu, India. J Int Dev. 2009;21:169–84. [Google Scholar]
- 15.van Doorslaer E, O’Donnell O. Rotterdam: Erasmus University; 2005. Paying out-of-pocket for health care in Asia: catastrophic and poverty impact. [Google Scholar]
- 16.Paris: Organization for Economic Cooperation and Development; 1982. OECD. The OECD list of social indicators. [Google Scholar]
- 17.O’Donnell O, Van Doorslaer E, Wagstaff A, Lindelow M. Washington, DC: The World Bank; 2008. Analyzing Health Equity Using Household Survey Data - A Guide to Techniques and Their Implementation. [Google Scholar]
- 18.Prinja S, Kumar R. Reducing health inequalities in a generation: a dream or reality? Bull World Health Organization. 2009;87:84. doi: 10.2471/BLT.08.062695. [DOI] [PMC free article] [PubMed] [Google Scholar]
- 19.Prinja S, Aggarwal A, Kumar R. Chandigarh: PGIMER School of Public Health; 2008. Impact of decentralization and user charges on health systems and health services utilization in North India. [Google Scholar]
- 20.Prinja S, Bahuguna P, Pinto AD, Sharma A, Bharaj G, Kumar V, et al. The cost of universal health care in India: a model-based estimate. PLoS One. 2012;7:e30362. doi: 10.1371/journal.pone.0030362. [DOI] [PMC free article] [PubMed] [Google Scholar]
- 21.Srinivasan S. ‘Medicines for All’, the Pharma Industry and the Indian State. Eco Political Wkly. 2011;46:43–50. [Google Scholar]
- 22.State-wise Per Capita Income in India. [accessed on August 15, 2009]. Available from: http://sampark.chd.nic.in/images/statistics/SDP2005R6.pdf .
- 23.Gupta M, Thakur JS, Kumar R. Reproductive and child health inequities in Chandigarh Union Territory of India. J Urban Health. 2007;85:291–9. doi: 10.1007/s11524-007-9250-y. [DOI] [PMC free article] [PubMed] [Google Scholar]
- 24.Duggal R, Amin S. Mumbai: Foundation for Research in Community Health; 1989. Cost of health care: A household survey in an Indian district. [Google Scholar]
- 25.George A, Shah I, Nandraj S. Mumbai: Foundation for Research in Community Health; 1997. Morbidity, Health Care Utilization and Expenditure. [Google Scholar]
- 26.Chatterjee M. New Delhi: Manohar Publications; 1988. Access to Health. [Google Scholar]
- 27.Mackenbach JP, Stirbu I, Roskam AJ, Schaap MM, Menvielle G, Leinsalu M, et al. Socioeconomic inequalities in health in 22 European countries. N Engl J Med. 2008;358:2468–81. doi: 10.1056/NEJMsa0707519. [DOI] [PubMed] [Google Scholar]
- 28.Adler N, Ostrove J. Socioeconomic status and health: What we know and what we don’t. Ann N Y Acad Sci. 1999;896:3–15. doi: 10.1111/j.1749-6632.1999.tb08101.x. [DOI] [PubMed] [Google Scholar]
- 29.Gilberts EC, Arnold MJ, Grobbee DE. Hypertension and determinants of blood pressure with special reference to socioeconomic status in a rural south Indian community. J Epidemiol Community Health. 1994;48:258–61. doi: 10.1136/jech.48.3.258. [DOI] [PMC free article] [PubMed] [Google Scholar]
- 30.Fernald L, Adler N. Blood pressure and socioeconomic status in low-income women in Mexico: a reverse gradient? J Epidemiol Community Health. 2008;62:e8. doi: 10.1136/jech.2007.065219. [DOI] [PubMed] [Google Scholar]
- 31.Mensah O, Kumaranayake L. Malaria incidence in rural Benin: does economics matter in endemic area? Health Policy. 2004;68:93–102. doi: 10.1016/j.healthpol.2003.08.005. [DOI] [PubMed] [Google Scholar]
- 32.Health Systems: Improving Performance. Geneva: The World Health Organization; 2000. The World Health Report. [Google Scholar]
- 33.New Delhi: National Sample Survey Organization, Ministry of Statistics and Program Implementation; 2004. NSSO. Household Consumer Expenditure in India NSS 60th Round (January - June 2004) [Google Scholar]
- 34.Pannarunothai S, Mills A. The poor pay more: health-related inequality in Thailand. Soc Sci Med. 1997;44:1781–90. doi: 10.1016/s0277-9536(96)00287-0. [DOI] [PubMed] [Google Scholar]
- 35.Pillai RK, Williams SV, Glick HA, Polsky D, Berlin JA, Lowe RA. Factors affecting decisions to seek treatment for sick children in Kerala, India. Soc Sci Med. 2003;57:783–90. doi: 10.1016/s0277-9536(02)00448-3. [DOI] [PubMed] [Google Scholar]
- 36.Hammer J, Aiyar Y, Samji S. Understanding government failure in public health services. Econ Political Weekly. 2007;42:4049–59. [Google Scholar]
- 37.Gupta I, Dasgupta P. Health-seeking behaviour in urban Delhi: an exploratory study. World Health Population. 2000;3(2) [Google Scholar]
- 38.Sengupta A, Nundy S. The private sector in India. BMJ. 2005;331:1157–8. doi: 10.1136/bmj.331.7526.1157. [DOI] [PMC free article] [PubMed] [Google Scholar]
- 39.Rane W. Analysis of drug prices, 1980-1995. Econ Political Weekly. 1996;24:2331–980. [Google Scholar]
- 40.Panchkula: Department of Health, Haryana Government; 2009. Department of Health. Surgery Package Programme Concepts and Implementation Guidelines. [Google Scholar]


