Abstract
Vesicles of dioleoylphosphatidylcholine (DOPC) formed by extrusion (liposomes) with hydrophobic alkanethiol-capped gold (Au) nanocrystals were studied. Dodecanethiol-capped 1.8 nm diameter Au nanocrystals accumulate in the lipid bilayer, but only when dried lipid/nanocrystal films were annealed with chloroform prior to hydration. Without chloroform annealing, the Au nanocrystals phase separate from DOPC and do not load into the liposomes. Gold nanocrystals with slightly longer capping ligands of hexadecanethiol, or with larger diameter of 4.1 nm, disrupted vesicle formation and created lipid assemblies with many internal lamellar attachments.
Keywords: Gold nanocrystal, dioleoylphosphatidylcholine, DOPC, chloroform, solvent vapor anneal, vesicle, liposome, lipid bilayer, cryo TEM
Introduction
Vesicles are attractive vehicles for dispersing hydrophobic ligand-stabilized nanocrystals for biological applications.1 The vesicle membrane is a self-assembled bilayer of lipid or amphiphilic polymer 2-6 that can host hydrophobic species, including nanocrystals,7-12 while water-soluble molecules can be encapsulated in the hydrophiliA silver behenate standard c cavity of the vesicle, for therapeutic applications like drug delivery.1,7,8,13-16 Vesicles scaffolds could support multiple components with different functionality as needed for combined diagnosis and therapy in medicine.
There has been interest in combining vesicles with inorganic nanocrystals for a long time now.1,17-19 Many recent reports have focused on assembling hydrophobic nanocrystals with amphiphilic polymer vesicles,20-25 even though lipids tend to form bilayers with more fluidity than amphiphilic polymers, which is important for incorporating active transmembrane proteins,5,26-29 not to mention that naturally-occurring lipids are readily metabolized and accurately mimic the mechanical properties of cell membranes.3,13,16 We recently observed that dodecanethiol-coated 1.8 nm diameter Au nanocrystals30 can accumulate as dense rafts or closely packed monolayers in lipid bilayers of hen egg-derived phosphatidylcholine vesicles.31 However, we also observed a significant amount of clustered nanocrystals in lipid micelles and a significant fraction of vesicles without nanocrystals. We have now found that chloroform vapor annealing of dioleoylphosphatidylcholine (DOPC) lipid/dodecanethiol-capped Au nanocrystal films prior to hydration and vesicle formation significantly increases nanocrystal loading of the lipid bilayer of vesicles. Furthermore, we show that nanocrystal-free vesicles can be readily separated from the nanocrystal-loaded vesicles by centrifugation.
We also examined Au nanocrystals of slightly larger size and the influence of chloroform vapor annealing on vesicle loading of these particles. Even with chloroform vapor annealing, larger 4.1 nm diameter dodecanethiol-capped Au nanocrystals and 1.8 nm diameter nanocrystals with longer hexadecanethiol capping ligands would not accumulate in the vesicle bilayer. Nanocrystals in this size range were observed to disrupt the integrity of the vesicles and induced vesicle aggregation and lipid membrane fusion. These results indicate that the 1.8 nm diameter dodecanethiol-capped Au nanocrystals are near the size limit for incorporation into the lipid membrane of vesicles without disrupting their structure.
Experimental Details
Materials
Hydrogen tetrachloroaurate trihydrate (HAuCl4-3H2O, 99.999%), tetraoctylammonium bromide (TOAB, 98%), sodium borohydride (NaBH4, 98%), diethyl ether, 1-dodecanethiol (98%), 1-hexadecanethiol (95%), anhydrous chloroform (99%) and cis-9-octadecene-1-thiol were obtained from Sigma-Aldrich. Toluene, cyclohexane, hexanes, dichloromethane, acetone, ethanol (EtOH, 200 proof), isopropanol, and methanol were from Fisher Scientific. 1,2-dioleoyl-sn-glycero-3-phosphatidylcholine (DOPC, >99%) was obtained from Avanti Polar Lipids. Deionized (DI) water was obtained from a Barnstead Nanopure Filtration System operating at a 17 MΩ resistance. Deuterium oxide was from Cambridge Isotope Laboratory.
Gold Nanocrystal Synthesis
1.8 nm diameter Au nanocrystals capped with dodecanethiol were synthesized following literature procedures.31 In a 125 mL flask, 6.0 g of TOAB was dissolved in 73 mL of toluene by magnetic stirring (600 rpm). An aqueous gold solution (0.300 g HAuCl4-3H2O in 18 mL DI water) was added to the toluene phase and stirring was continued for 1 hour, resulting in complete phase transfer of the gold ions to the toluene phase. The toluene phase was extracted, placed in a clean flask, and stirred at 600 rpm. Next, 2.3 mmol of 1-dodecanethiol was injected into the stirring flask, and the toluene phase turned from red to colorless. After stirring for 15 minutes, an aqueous sodium borohydride solution (0.346 g NaBH4 in 18 mL DI water) was quickly poured into the toluene phase. Stirring was continued for 12 hours, and then the toluene phase was extracted and distributed into glass centrifuge tubes. Ethanol was added to each tube as an antisolvent (20 mL EtOH : 5 mL toluene). The tubes were centrifuged at 9000 rpm for 6 minutes, and the colorless supernatant was discarded. The gold nanocrystal precipitates were dispersed in 2 mL total of toluene, combined into one centrifuge tube, and centrifuged at 10000 rpm for 3 minutes. The supernatant of well-dispersed nanocrystals was transferred to a clean glass centrifuge tube. Size selective precipitation was performed by adding 500 μL of ethanol, centrifuging at 9000 rpm for 6 minutes, and transferring the supernatant to a new tube. The size selection was repeated 3 times (4 times total). The final supernatant was combined with 20 mL of ethanol and centrifuged to precipitate all of the remaining nanocrystals, which were dispersed in 2 mL of toluene, characterized by TEM and SAXS, and used for vesicle experiments.
Au nanocrystals with 4.1 nm diameter coated with dodecanethiol were prepared by modification of recent protocols.32 In a 125 mL flask, 5.4 g of TOAB was dissolved in 49 mL of toluene by magnetic stirring (600 rpm). An aqueous gold solution (0.760 g HAuCl4-3H2O in 72 mL DI water) was added to the toluene phase and stirring was continued for 1 hour, resulting in complete phase transfer of the gold ions to the toluene phase. The toluene phase was extracted, placed in a clean flask, and stirred at 600 rpm. Next, an aqueous sodium borohydride solution (1.0 g sodium borohydride in 60 mL DI water) was quickly poured into the toluene phase. Stirring was continued for 10 minutes, the two phase liquid mixture was decanted off of the bulk gold precipitate, and then the toluene phase was extracted from the mixture, washed with three 20 mL aliquots of DI water, and collected in a clean flask. Then 2.0 mmoles of dodecanethiol was injected into the toluene phase while stirring at 600 rpm. After 3 hours, the toluene phase was distributed into glass centrifuge tubes, centrifuged at 10000 rpm for 3 minutes, and the supernatant of well dispersed particles was collected. This dispersion was combined with ethanol (20 mL EtOH per 5 mL toluene), centrifuged at 8500 rpm for 6 minutes, and the colorless supernatant was discarded. The total gold precipitate was dispersed in 2 mL of toluene and then centrifuged at 10000 rpm for 3 minutes. The supernatant was collected and transferred to a clean glass centrifuge tube. Size selective precipitation was performed by adding 1 mL of ethanol, centrifuging at 8500 rpm for 5 minutes to precipitate the first fraction, and then transferring the supernatant to a clean tube. The size selection was repeated 3 more times. The third and fourth fractions were dispersed in toluene, combined, characterized by TEM and SAXS, and used in vesicle experiments.
Au nanocrystals capped with 1-hexadecanethiol were prepared as described above for 1.8 nm nanocrystals with 2.3 mmol of the appropriate thiol. After stirring the two phase reaction for 12 hr, the toluene phase was extracted and distributed into 30 mL glass centrifuge tubes (5 mL per tube). A 1:1 v/v mixture of acetone and isopropanol (IPA) was used as the antisolvent to purify the nanocrystals because hexadecanethiol does not dissolve in ethanol. The particles were washed by adding 20 mL of acetone/IPA to each tube and centrifuging at 9000 rpm for 5 minutes. The entire Au precipitate was dispersed in 2 mL of toluene, combined into a single glass centrifuge tube, and centrifuged at 10000 rpm for 3 minutes. The supernatant was transferred to a clean centrifuge tube, mixed with 20 mL of acetone/IPA, and centrifuged at 9000 rpm for 5 minutes. The Au precipitate was dispersed in 1 mL of toluene and centrifuged at 10000 rpm for 3 minutes. Finally, size selective precipitation was performed on the supernatant using the same method described for the 1.8 nm diameter dodecanethiol-coated Au nanocrystals with the same volumes of ethanol antisolvent in each step.
Gold Nanocrystal Characterization
Gold nanocrystals were dried from toluene solvent onto 200 mesh carbon-coated copper grids (Electron Microscopy Sciences) and imaged by a FEI Tecnai Biotwin transmission electron microscope (TEM) operating at 80 kV. Small angle x-ray scattering (SAXS) was used to determine the mean crystalline core diameter of gold nanocrystals dispersed in toluene as described previously.31 SAXS measurements were performed with a Molecular Metrology system having a 3.0 kW rotating copper anode X-ray generator (Bruker Nonius, λ=1.54 Å). Au nanocrystal dispersions were sealed between kapton windows in a stainless steel cell. Scattered photons were collected with a 2D multiwire gas-filled detector (Molecular Metrology, Inc.). A silver behenate standard was used to calibrate the scattering angle. Datasqueeze software package33 was used to perform radial integrations of scattering intensity, and the experimental data were corrected for background scattering.
The scattering intensity I(q) of a dispersion of non-interacting spherical nanocrystals is34,35
| (1) |
where N(r) is the number fraction of nanocrystals having a radius r, and P(q,r) is the form factor of a solid, homogeneous sphere:
| (2) |
The scattering wave vector q, depends on the x-ray wavelength λ and the scattering angle θ:
| (3) |
A Gaussian size distribution,
| (4) |
was assumed to determine the average nanocrystal radius R, and standard deviation of σ.
Thermogravimetric analysis (TGA) was used to determine the weight fractions of Au and organic ligand. TGA measurements were made with 1 mg of nanocrystals in a 70 μL alumina crucible (Mettler Toledo) using a Mettler Toledo TGA-1 with heating from 25–800°C at 10°C/minute under 5 mL/minute nitrogen gas flow.
Vesicle Formation
Vesicles were formed by dispersing a dry lipid-nanocrystal film in water. Films were prepared from a 1.0 mL chloroform dispersion containing 30 μmol of phospholipid (DOPC) and 3 mg of gold nanocrystals, illustrated in Figure 1. The 1 mL dispersion was placed in a 50 mL glass round bottom flask (Chemglass) and connected to a rotary evaporator (Buchi). Chloroform was evaporated with the rotary evaporator bath temperature at 25°C, 40 rpm rotation, and a pressure of 200 mbar. After 15 minutes, the flask was removed from the rotary evaporator and subjected to solvent vapor annealing as described below.
Figure 1.
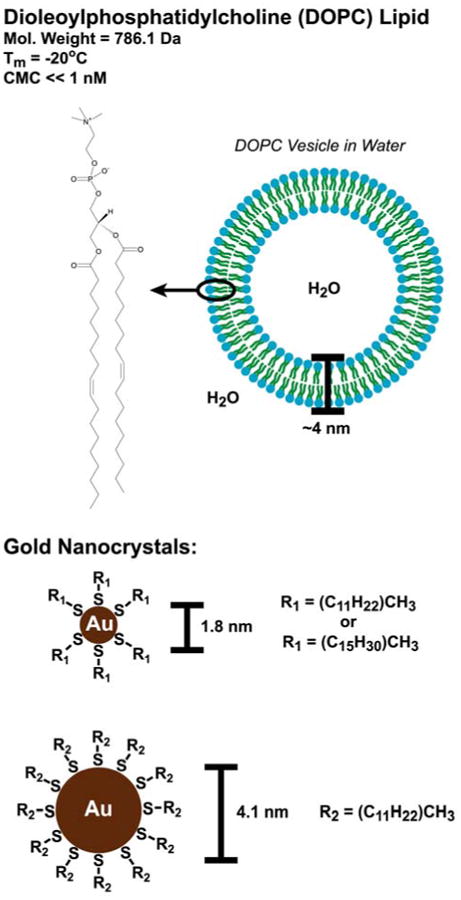
DOPC lipid and gold (Au) nanocrystals used for vesicle formation. DOPC is a glycerophosphatidylcholine with two monounsaturated fatty acid chains located at the sn1 and sn2 positions, and the hydrophilic phosphatidylcholine head group at the sn3 position. The DOPC molecular weight, critical micelle concentration (CMC), and lamellar gel to liquid crystal phase transition temperature (Tm) are derived from Marsh.36 The lipid bilayer thickness is based on measurements by Nagle et al.37
Lipid/nanocrystal films were annealed with chloroform vapor using the experimental setup llustrated in Figure 2A. The flask containing a dried lipid-nanocrystal film was placed on top of a glass bottle filled with liquid chloroform with the flask neck inserted into the bottle opening. The flask-bottle contact was wrapped with parafilm to help maintain constant chloroform vapor pressure. Solvent vapor annealing was performed for 60 minutes, and during the first 50 minutes of solvent vapor exposure, the films changed in appearance from opaque to translucent. Immediately after 60 minutes of solvent vapor annealing, the flask was separated from the glass bottle, 1.0 mL of DI water was added to the lipid/nanocrystal film, the flask opening was covered with parafilm and the film was sonicated for 10 min (Misonix bath sonicator, 600 mL water bath, 25-30°C temperature, 30 W power delivered to the sample).38
Figure 2.
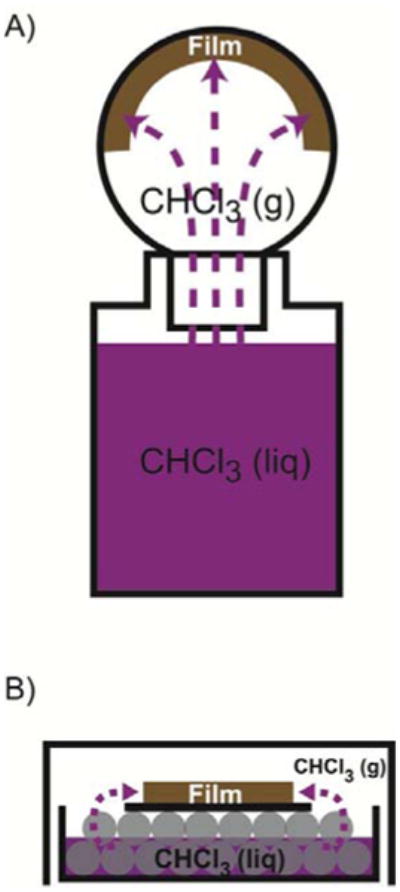
Solvent vapor annealing setups. (A) A glass bottle of liquid CHCl3 is used for lipid/nanocrystal films prepared in 50 mL glass round-bottom flasks. The liquid level is typically 2-3 mm below the opening of the round-bottom flask, and the contact between the glass bottle and flask is sealed by wrapping with parafilm. (B) A glass Petri dish containing 10 mL of liquid chloroform is used for annealing films prepared on glass cover slides. The cover slide (black) is placed face up on two layers of 5 mm diameter glass beads (grey), and the level of liquid chloroform is below the cover slide. The Petri dish is covered with a glass crystallization dish trap chloroform vapor inside.
After 10 min of ultrasonication, the aqueous lipid/nanocrystal dispersions were loaded into 2 mL plastic centrifuge tubes for purification from poorly dispersed nanocrystals and extrusion. The dispersions were centrifuged at 2000g for 10 minutes, the supernatant was removed with a glass pipette and placed into a clean 2 mL centrifuge tube, and then it was centrifuged at 2000g a second time. The final supernatant was transferred to a clean 2 mL centrifuge tube using a glass pipette. Vesicles formation was completed by extruding the lipid/nanocrystal dispersions through a polycarbonate membrane with 100 nm diameter pores using a hand-powered MiniExtruder (Avanti).
Light Microscopy
Lipid/nanocrystal films were imaged using a Leica DM2500 light microscope at 40× magnification in bright field mode. Images were captured using a Leica DFC 320 color camera. The lipid/nanocrystal films were prepared for light microscopy by dispersing lipids and nanocrystals in liquid chloroform and drop-casting 500 μL onto a 24×50 mm (12 cm 2) cover glass. The liquid chloroform was allowed to evaporate in a ventilated fume hood at room temperature (23°C) for 15 minutes. Once dry, the films were transferred to a room temperature vacuum oven and stored under vacuum for 12 hours.
Nanocrystal/lipid films were annealed with solvent vapor as illustrated in Figure 2B, using a glass petri dish filled with two complete layers of glass beads and liquid organic solvent in the dish. The liquid level was below the top layer of the beads. The cover glass coated with a dry lipid-nanocrystal film was placed face up on the top layer of glass beads. The Petri dish was covered by a glass crystallization dish, forming a closed container to trap the solvent vapor. The films were kept in the closed container until the film appearance changed from opaque to translucent, typically 5 minutes. Once annealing was complete, the films were removed from the closed container for light microscopy imaging.
Centrifugal Isolation of Au-Loaded Vesicles
An extruded lipid/nanocrystal dispersion was placed in a plastic centrifuge tube and spun at 10000g for 60 minutes. The Au-loaded vesicles concentrate at the bottom of the centrifuge tube. The supernatant was transferred to a clean centrifuge tube using a glass pipette and centrifuged at 10000g for 60 minutes. The remaining Au-loaded vesicles concentrated at the bottom of the centrifuge tube. A blue-opalescent supernatant, containing mostly empty vesicles, was transferred by pipette to a clean centrifuge tube. The concentrated Au-loaded vesicles from both centrifugation steps were combined and diluted to 0.5 mL with DI water for cryoTEM imaging.
CryoTEM Imaging
CryoTEM imaging was performed on an FEI Tecnai F20 transmission electron microscope operated at 200 kV with a liquid nitrogen cooled stage. Specimens were prepared on C-flat holey carbon film TEM grids (Protochips, via Electron Microscopy Sciences) having a 1.2 μm holes separated by and a 1.3 μm. TEM grids were exposed to glow discharge plasma for 30 sec to improve wetting of the hydrophobic grids. The TEM samples were vitrified using an automated Vitrobot (FEI). A 2.8 μL drop of lipid-nanocrystal dispersions was placed on a C-flat grid suspended in the Vitrobot chamber maintained at 22°C and 95-100% relative humidity. The Vitrobot blots the grid with filter paper (1 blot, 3.5 second blot time) and then plunges the grid into liquid ethane. The vitrified grid was transferred to a cryo grid storage box (Electron Microscopy Sciences) submerged in liquid nitrogen, where it was kept until imaging. The vitrified grid was transferred in liquid nitrogen to a Gatan CT3500 single tilt cryo TEM specimen holder on a cryo workstation (Gatan), followed by insertion into the microscope. Vesicles are imaged in the holey regions of the carbon film.
Dynamic Light Scattering (DLS)
DLS data were collected using a Zetasizer Nano ZS instrument (Malvern) operating at 25°C with a laser wavelength λ of 630 nm and a scattering angle θ of 173°. Measurements were made using disposable, polystyrene, low-volume microcuvettes (Malvern). Microcuvettes were rinsed before use with DI water filtered with polyvinylidene fluoride syringe filters (100 nm pore size; Millipore). Cuvettes were filled with 50 μL of aqueous lipid/nanocrystal dispersion for DLS characterization. (See Supporting Information for details about the analysis of the DLS data).
1H NMR
Pure lipid and lipid/nanocrystal dispersions were prepared as described above, but using D2O was used as the solvent instead of deionized water. The lipid dispersions were pipetted into NMR liquid sample tubes (Wilmad) and submitted to the University of Texas NMR facility for analysis. All spectra were collected at 27°C on a Varian Inova-500 spectrometer. The 1H NMR spectra with 13C decoupling were collected at 600 MHz using no spinning, 12.9 kHz spectral width, 4 kHz filter bandwidth, 3.57 s acquisition time, 0.020 relaxation delay, 64 transients with 32 transients collected before saving, 61 dB transmitter power, 1.4 kHz transmitter offset, and 11.6 μs pulse width.
Lipid and Nanocrystal Monolayer Compression
Monolayer compression experiments were carried out on a KSV Minitrough (maximum area=243 cm2) with Teflon barriers, a platinum Wilhelmy plate, and a DI water sub-phase maintained at 25°C by a recirculating water bath. DOPC lipid and nanocrystals were dispersed in chloroform and spread on the trough by touching a single droplet of the dispersion to the surface of the water every 10 seconds. After spreading, the monolayer was allowed to equilibrate for at least 10 minutes. The barriers were compressed to an area of 63 cm2 at a rate of 3.75 cm2/min while recording surface pressure and area.
LB monolayers with 10 mole% nanocrystals or less were prepared using nanocrystals dispersed in chloroform at 5 μM (0.28 mg/mL) and lipid dissolved separately in chloroform at 1 mM (0.79 mg DOPC/mL). The nanocrystals were spread first, followed by 30 nmol of lipid. For 25-100 mole% of nanocrystals, the 5 μM nanocrystal dispersion was too dilute to form a monolayer during compression on the Minitrough, so a 25 μM nanocrystal dispersion was prepared. For the monolayer with 50 mole% nanocrystals, it was difficult to spread the lipid after the gold nanocrystals without the surface pressure increasing over 1 mN/m before compression, which is detrimental to forming a monolayer according to the manufacturer. Because of this, the 50 mole% monolayer data was not included when comparing the experimental data of average area (nm2 per number of moles of DOPC plus nanocrystals added to the trough) versus mole% to the calculated area for ideal mixing (Aideal).
Results and Discussion
Au nanocrystals
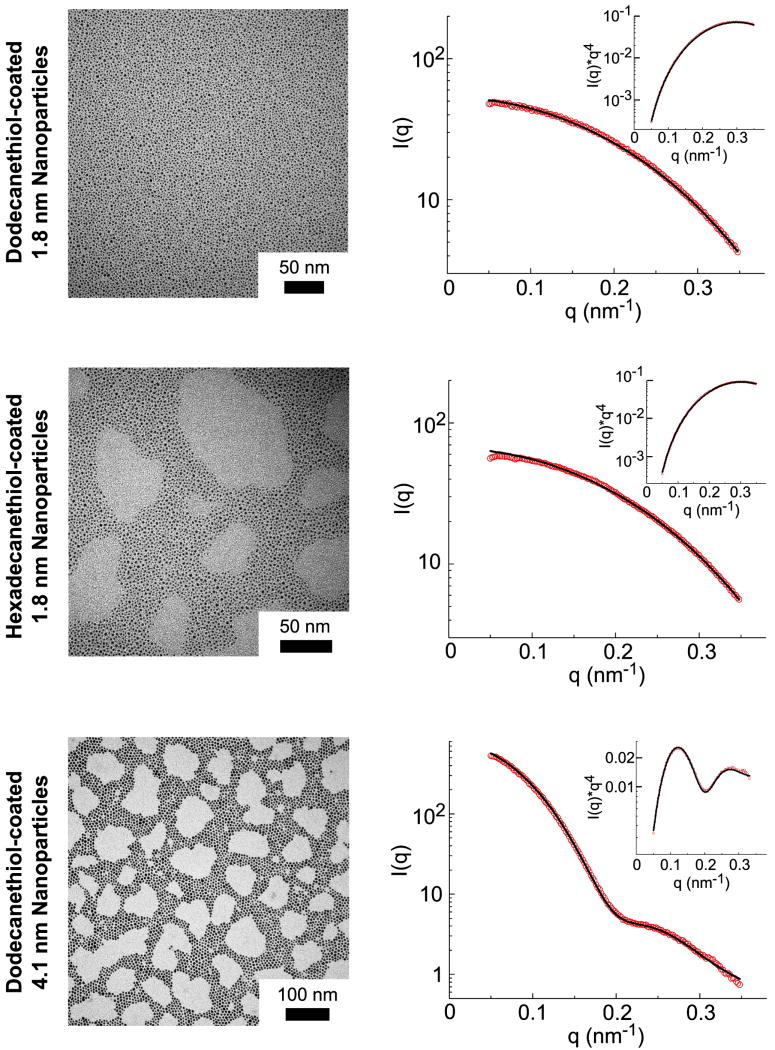
Three different Au nanocrystal samples were studied: (1) 1.8 nm diameter particles capped with dodecanethiol, (2) 1.8 nm diameter particles capped with hexadecanethiol and (3) 4.1 nm diameter nanocrystals capped with dodecanethiol. The average diameters of the nanocrystals were determined using both TEM and SAXS (Figure 3). Table 1 lists the average sizes determined from SAXS. (Optical absorbance spectra of the gold nanocrystals further verifying the nanocrystal sizes measured by TEM and SAXS is provided in Supporting Information). The 1.8 nm gold nanocrystal samples are too small to have a plasmon resonance, and the 4.1 nm nanocrystals have the characteristic Au nanocrystal plasmon peak at 520 nm.45 TGA (Figure 4) of the nanocrystals was used to ensure that each sample was free of unbound ligand and that the nanocrystals had similar ligand coverage. Table 1 lists the mass fraction of ligand expected for nanocrystals with a complete uniform thiol monolayer compared to the measured mass fraction. The measured ligand content is within experimental error of the expected ligand content.
Figure 3.
TEM and SAXS characterization of the Au nanocrystals used in the study. The SAXS data were fit using Equations (1-4) to obtain the mean nanocrystal diameters (D) and standard deviations (σ) listed in Table 1.
Table 1.
Size and mass fraction of Au and organic in the nanocrystal samples measured by SAXS and TGA.
| Measured SAXS Diameter, D (nm) | Thiol | Calculated Thiol Mass Percent (%) | Mass Fraction of Ligand Measured by TGA (%)‡ |
|---|---|---|---|
| 1.8 ± 0.2 | C12H25SH | 26 ± 9 | 27 |
| 1.8 ± 0.2 | C16H33SH | 31 ± 11 | 33 |
| 4.1 ± 0.8 | C12H25SH | 14 ± 9 | 21 |
Figure 4.
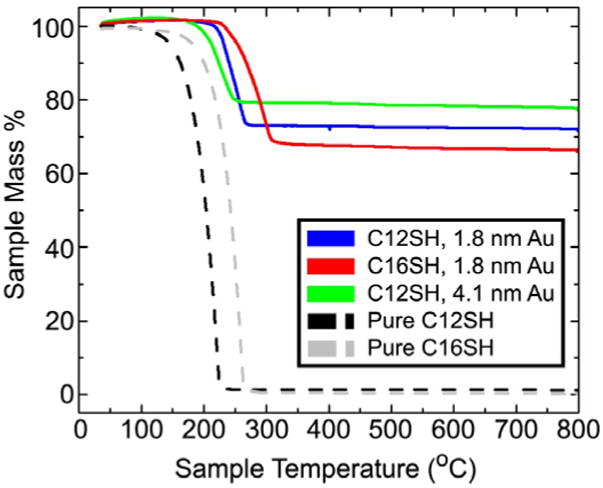
TGA of the alkanethiol-capped gold nanocrystals: dodecanethiol-coated 1.8 nm gold nanocrystals (blue), hexadecanethiol-coated 1.8 nm gold nanocrystals (red), and dodecanethiol-coated 4.1 nm gold nanocrystals (green). TGA of pure dodecanethiol (black) and hexadecanethiol (grey) Au are also plotted.
Chloroform solvent vapor annealing to improve nanocrystal incorporation into vesicles
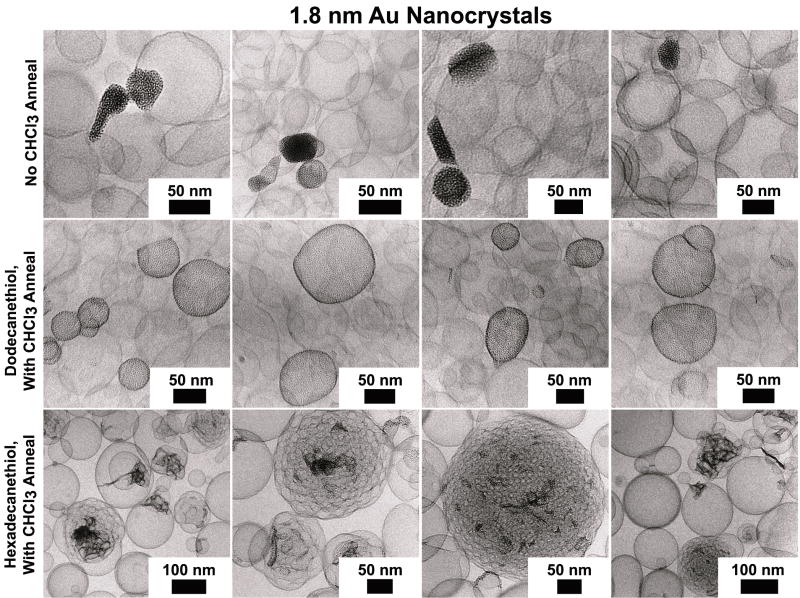
To form vesicles, the Au nanocrystals are dispersed in chloroform with DOPC lipid and then dried for 12 hours under vacuum. During this drying process, the nanocrystals and lipid phase separate. Chloroform vapor annealing reverses the phase separation and re-disperses the nanocrystals in the lipid film, as shown in Figure 5. Vesicles formed from the phase-separated nanocrystal/lipid films were predominantly free of nanocrystals, whereas the chloroform-annealed lipid/nanocrystal films formed vesicles with significant incorporation of the 1.8 nm diameter dodecanethiol-capped nanocrystals, as shown in the cryo-TEM images in Figure 6.
Figure 5.
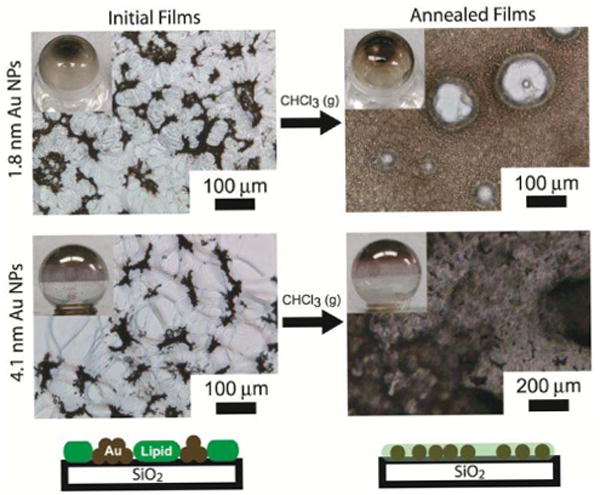
Light microscopy images of dried DOPC lipid/Au nanocrystal films after (a) complete drying followed by (b) exposure to chloroform vapor (i.e., solvent vapor “annealed” films).
Figure 6.
CryoTEM images of DOPC vesicles prepared in the presence of alkanethiol-coated 1.8 nm diameter gold nanocrystals. Only when lipid/nanocrystal films were annealed with chloroform vapor did the dodecanethiol-coated nanocrystals load the vesicle bilayers (middle row). Hexadecanethiol-coated nanocrystals caused interlamellar attachments to form between DOPC bilayers when annealed with chloroform (bottom row).
Centrifugal purification of nanocrystal-loaded DOPC vesicles
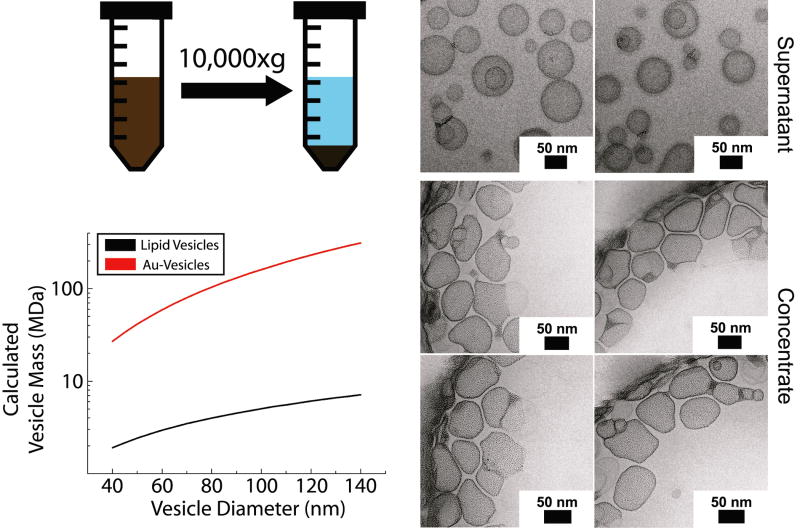
Nanocrystal-loaded and nanocrystal-free vesicles could be separated by centrifugation. As illustrated in Figure 7, vesicles loaded with nanocrystals are about 10-100 times heavier than the vesicles without nanocrystals. Figure 7 shows cryo-TEM images of vesicles enriched with lipid bilayer-embedded nanocrystals obtained by centrifugal separation. In a typical separation the supernatant has the characteristic blue opalescence of vesicles, whereas the concentrate is dark brown due to the Au nanocrystals.
Figure 7.
Separation of gold nanocrystal-loaded DOPC vesicles from nanocrystal-free vesicles. High speed centrifugation (10,000g for 60 minutes) precipitates the heavier nanocrystal-loaded vesicles from the nanocrystal-free vesicles. The vesicle mass was determined by assuming that lipids occupy an area of 0.7 nm2 with a 4 nm thick lipid bilayer,37 with nanocrystals residing at the center of the lipid bilayer and occupying an area of 10 nm2, based on LB nanocrystal monolayers (Figure 11).48 The nanocrystal molecular weight was taken to be 50 kDa/nanocrystal based on the TGA measurement of the ligand content.
Influence of ligand chain length and nanocrystal size on vesicle incorporation
Au nanocrystals with 1.8 nm diameter cores and longer capping ligands of hexadecanethiol (C16) did not incorporate into the DOPC vesicles. They tended to cluster at the intersection of multiple vesicle bilayers and induce the formation of lipid particles with many internal, interlamellar attachments as shown in Figure 6. Clustering of 6-10 nm diameter hydrophobic iron oxide nanocrystals between vesicle bilayers has been observed as well.15, 22 Lipid particles with many internal, interlamellar attachments have also been formed by hydrophobic phytosterols and polyprenoids in glycerolipid particles.49 The formation of interlamellar attachments suggests that the hexadecanethiol-coated nanocrystals destabilize the DOPC lipid bilayers. Some lipid particles were 200 nm in diameter or larger, probably due to the aggregation of vesicles induced by the hexadecanethiol-coated gold nanocrystals, similar to a mechanism suggested for monoolein lipid.49 According to Efrat et al., unilamellar monoolein vesicles loaded with phytosterol may fuse into larger vesicles with a few interlamellar attachments, followed by further fusion of bilayers within the vesicle to form a complex lipid particle with many interlamellar attachments.49 Hexadecanethiol-capped Au nanocrystals are probably too large to insert in the lipid bilayer of the DOPC vesicles.4,50,12 Compared to dodecanethiol-capped nanocrystals, hexadecanethiol adds at least a nanometer to their diameter.
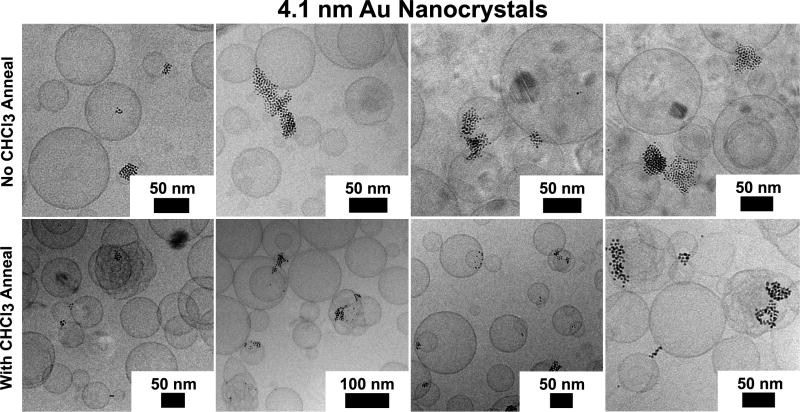
Even larger 4.1 nm Au nanocrystals capped with dodecanethiol also do not incorporate into the DOPC lipid bilayer. As the cryoTEM images in Figure 8 show, the nanocrystals tend agglomerate and fuse to vesicle membranes or lead to fused lipid bilayers and interlamellar attachments within and between vesicles when annealed with chloroform. These nanocrystals are even larger than the hexadecanethiol-capped nanocrystals with a diameter including the ligand shell of approximately 7.5 nm. Figure 9 summarizes the role of chloroform vapor annealing and the influence of nanocrystal size on the interaction between DOPC vesicles and the nanocrystals.
Figure 8.
CryoTEM imaging of DOPC vesicles prepared with dodecanethiol-coated 4.1 nm diameter Au nanocrystals. The nanocrystals do not form loaded vesicles, though chloroform annealing encourages formation of interlamellar attachments between DOPC bilayers.
Figure 9.
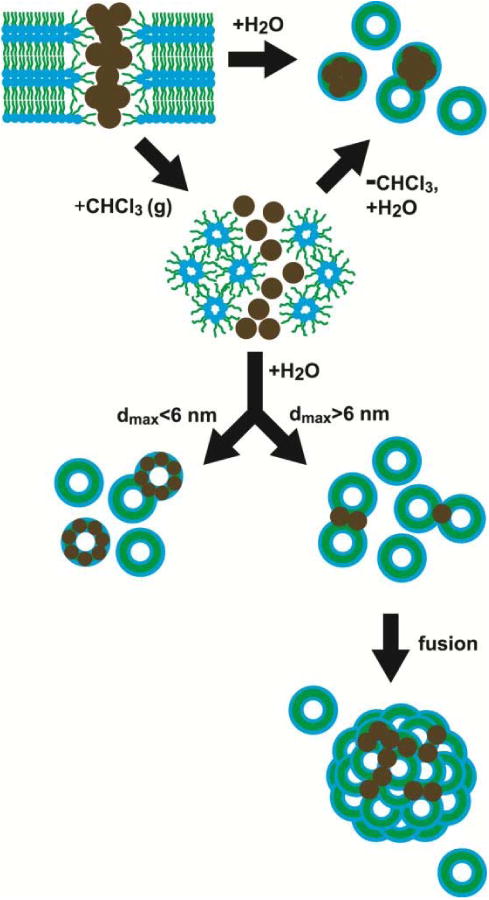
Pathways to vesicle formation and nanocrystal incorporation that depend on solvent vapor annealing and nanocrystal size. The diameter dmax, includes the fully extended length of the alkanethiol ligands. DOPC lipid adopts the inverted hexagonal phase in the anhydrous state after exposure to chloroform, similar to the lipid's behavior presence of dodecane at low water content.51 As predicted by Wi,12 Au nanocrystals less than 6 nm incorporate into DOPC vesicle bilayers (with chloroform annealing), whereas nanocrystals larger than 6 nm de-stabilize DOPC bilayers to form lipid particles with many inter-lamellar attachments. The dodecanethiol-coated 1.8 nm diameter nanocrystals have a diameter of about 5.2 nm including the ligand.
Rehydration and dispersion of lipid/nanocrystal films with chloroform vapor annealing
Chloroform vapor annealing of lipid/nanocrystal films led to much better aqueous dispersibility of both the smaller and larger Au nanocrystals. As shown in Figure 5, the 4.1 nm diameter nanocrystals also redisperse in the lipid film upon chloroform annealing, as the film changes color from violet to red—a sign of de-aggregation of Au nanocrystals in the lipid film.52-54 Even though the larger 4.1 nm diameter Au nanocrystals do not incorporate into the lipid membranes, the chloroform annealing process led to significantly better dispersibility of the nanocrystals with lipid in water. This was visually observed by the dark color of the dispersions and DLS measurements of lipid/nanocrystal aggregate size (Figure 10). When the lipid/nanocrystal films were not annealed with chloroform vapor, there was very poor dispersibility and the lipid and nanocrystals formed very large aggregates. Chloroform vapor-annealing gave DOPC/nanocrystal dispersions that passed easily through the extruder pores, consistent with their much better dispersibility.
Figure 10.
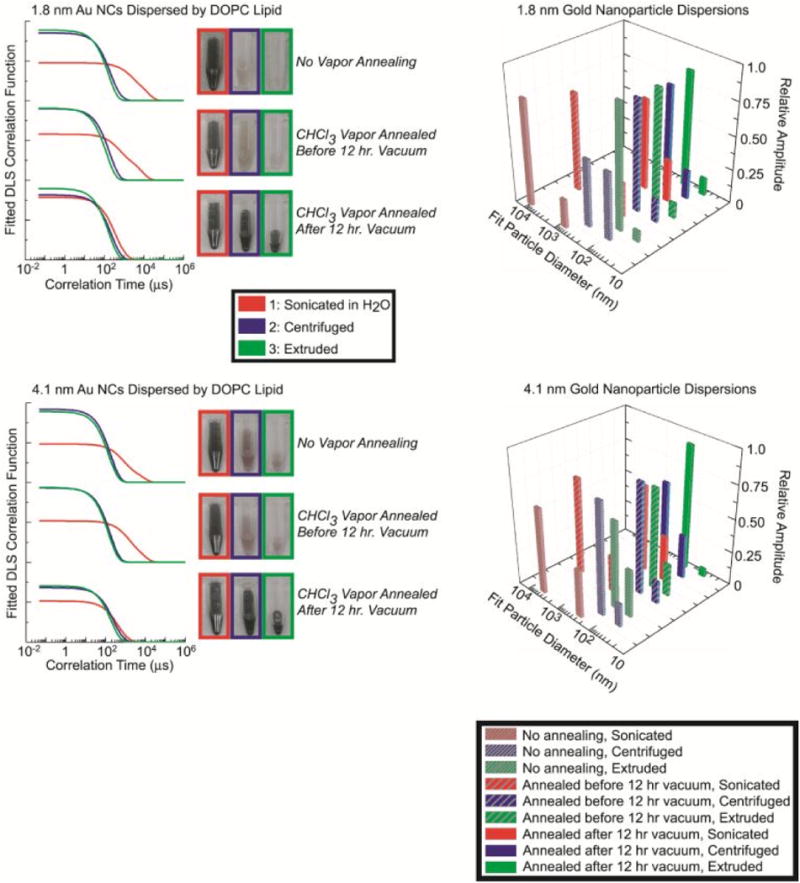
Dynamic light scattering (DLS) of DOPC lipid/nanocrystal dispersions. Immediately after the lipid/nanocrystal films were dried by rotary evaporation, they were either annealed with chloroform vapor and then vacuum dried for 12 hours, or vacuum dried for 12 hours followed by chloroform vapor annealing. One set of lipid/nanocrystal films were not exposed to chloroform vapor. The lipid/nanocrystal films were then rehydrated and sonicated (red), centrifuged after sonication (blue), or extruded after centrifugation (green). The plotted correlation functions are the best fit of Eqn (S-6) to triplicate measurements of the scattering correlation function. Numerical values obtained from the fits are tabulated in Supporting Information.
Role of solvent vapor annealing in nanocrystal loading of vesicles
Chloroform improves mixing of the nanocrystals and DOPC in the dried films and is also retained in the vesicles. The lipid/nanocrystal films exposed to chloroform vapor took significantly longer to lift off the glass surface during sonication than films without chloroform annealing. Organic solvent exposure to DOPC lipid leads to inverted hexagonal (HII) and cubic (Q) phases with exposed hydrophobic surfaces.51,55-57 Bringing the phospholipids to full hydration requires a transition from the chloroform-swollen non-lamellar phase to the vesicle-forming Lα phase,51,58 which is a relatively slow process requiring the lipids to rearrange.59,60
Retained chloroform influences several properties of lipid membranes, which may be important for nanocrystal loading. Absorbed chloroform lowers the lateral viscosity of lipid bilayers (increasing lipid lateral diffusivity),59,60 which should make the bilayers more fluid and less resistant to the physical deformation of incorporating a hydrophobic nanocrystal. Chloroform has a slight preference to reside at the membrane-water interface,60, 61 which should lower the pressure at the center of the bilayer and may encourage nanocrystal incorporation.62,63 Simulations of DOPC bilayers showed that chloroform encourages lipid to align more perpendicular to the membrane-water interface and increase the bilayer thickness.60
1H NMR spectra of DOPC vesicles prepared in D2O, with and without nanocrystals confirmed that chloroform is present in the DOPC/Au nanocrystal dispersions (Supporting Information). The DOPC dispersions prepared with 1.8 nm Au nanocrystals and chloroform annealing contained about 1 chloroform molecule per DOPC after the sonication step and then extrusion lowered the CHCl3:DOPC molar ratio to about 0.2. In 31P NMR spectra, the 31P resonance peak of the DOPC dispersions with chloroform vapor annealing was much broader when Au nanocrystals were present. This suggests either that the lipids must be more ordered to support nanocrystals in the bilayer or that the nanocrystals slow the lateral diffusivity of lipids in the bilayer.64,65
Pressure-area isotherms of DOPC/nanocrystal LB films
LB films of DOPC and the 1.8 nm diameter dodecanethiol-capped Au nanocrystals were studied. The lipid/nanocrystal films were spread from chloroform dispersions on the water sub-phase. The trough is open to air allowing the chloroform to evaporate. Phase separation between the lipid and the nanocrystals was observed. The pressure-area isotherms of the LB films are shown in Figure 11. An ideal mixture of nanocrystals and lipid should have an area Aideal, which is proportional to the mole fractions of lipid (xlipid) and nanocrystals (xNPs):66,67
Figure 11.
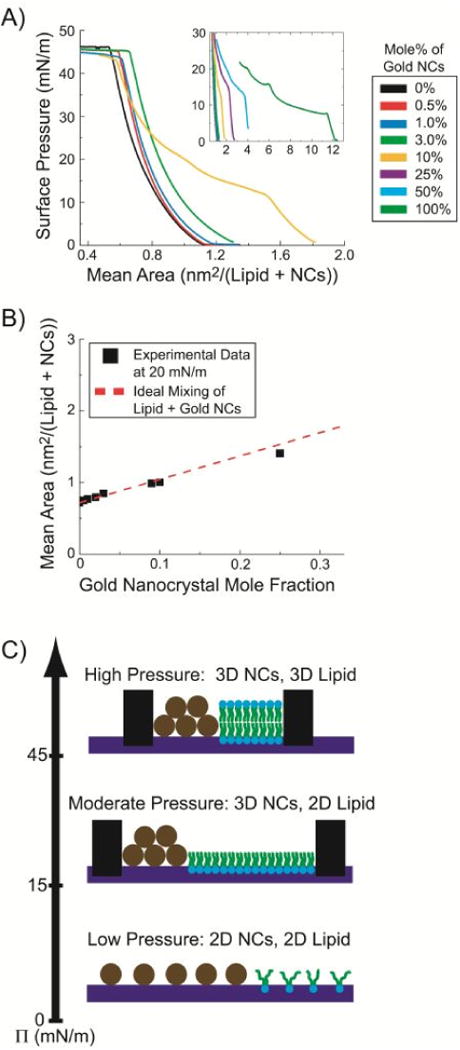
Compression of LB films of DOPC lipid and dodecanethiol-coated 1.8 nm gold nanocrystals at a water/air interface. (A) Surface pressure-area isotherms of monolayers with varying DOPC/nanocrystal ratio. (B) Mean area per DOPC lipid/nanocrystals at 20 mN/m pressure, plotted versus Au nanocrystal mole fraction. The data (solid squares) are taken from the plots in (A) and the dashed line plots the area calculated assuming ideal mixing (Eqn (5)). (C) Illustration of the nanocrystal/lipid configurations at various pressure.
| (5) |
Alipid and ANPs are the areas occupied by a lipid molecule and a nanocrystal in a pure single component monolayer at surface pressure π. Deviations from Aideal indicate attractive or repulsive interactions between nanocrystals and lipid in the film A plot of LB film area measured at 20 mN/m surface pressure with changing nanocrystal mole fraction in Figure 11B is consistent with Eqn (5), which means that the nanocrystals and lipid are completely miscible or immiscible.67 The buckling pressure was found to be around 45 mN/m and did not vary with the amount of nanocrystals in the film. This corresponds to the phase transition pressure for LB films of pure DOPC, whereas the transition for a pure nanocrystal film is typically at about 15 mN/m,68 indicating that the film behavior is mostly dominated by the lipid and is consistent with phase separation between the lipid and nanocrystals. Phase separation of saturated phospholipids and alkanethiol-capped Au nanocrystals has also been observed in LB monolayer compression studies by microscopy.69
Conclusions
Dried films of hydrophobic, alkanethiol-coated gold nanocrystals and DOPC undergo micro-phase separation. Exposure to chloroform vapor, however, leads to mixing of the nanocrystals and lipid. Without chloroform vapor annealing, the lipid-nanocrystal films dispersed poorly in water and formed micrometer-size lipid-coated nanocrystal agglomerates. Lipid-nanocrystal films saturated with chloroform vapor on the other hand disperse well in water. Dodecanethiol-coated 1.8 nm diameter Au nanocrystals did not disrupt vesicle formation and the nanocrystals were observed to completely load the DOPC vesicle membranes vesicles. The larger hexadecanethiol-coated 1.8 nm diameter and dodecanethiol-coated 4.1 nm diameter Au nanocrystals, however, disrupted vesicle formation and tended to disperse as small clusters that fused multiple lipid bilayers.
These data show reveal a maximum nanocrystal size for incorporation into lipid bilayers,7,8 consistent with recent theoretical work.12 Another recent study also revealed that 2 nm diameter hydrophobic gold nanocrystals only inserted into a hydrated lamellar phase of sodium dodecyl sulfate and pentanol when swollen with dodecane solvent,70 and that hydrophobic nanocrystals larger than the bilayer thickness did not incorporate into the membranes.
In terms of applications, chloroform is toxic and carcinogenic,71-73 making these nanocrystal-loaded vesicles unsuitable for medical applications. Alternative preparative conditions must be developed for forming nanocrystal-loaded vesicles with relevance to medical applications.
Supplementary Material
Acknowledgments
We thank the Texas A&M University Microscopy and Imaging Center and Dr. Zhiping Luo for allowing training and generous use of their facilities. We acknowledge use of the Microscopy and Imaging Facility of the Institute for Cellular and Molecular Biology and the NMR facility at the University of Texas at Austin. We also acknowledge the Robert A. Welch Foundation (F-1464) and the National Institutes of Health (Grant no. R01 CA132032) for financial support of the research.
Footnotes
Supporting Information: Gold nanocrystal absorbance spectra, tabulated DLS fitting parameters, DLS data analysis and additional DLS data, lipid/nanocrystal films under different drying conditions and annealed with other solvent vapors, cryoTEM images of vesicles from dichloromethane vapor-annealed DOPC/Au nanocrystal films, NMR spectra. This material is available free of charge via the Internet at http://pubs.acs.org.
References
- 1.Al-Jamal WT, Kostarelos K. Liposome-nanoparticle hybrids for multimodal diagnostic and therapeutic applications. Nanomed. 2007;2:85–98. doi: 10.2217/17435889.2.1.85. [DOI] [PubMed] [Google Scholar]
- 2.Torchilin VP, Weissig V. Liposomes: A Practical Approach. 2nd. Oxford; New York: 2003. [Google Scholar]
- 3.Jesorka A, Orwar O. Liposomes: Technologies and Analytical Applications. Ann Rev Anal Chem. 2008;1:801–832. doi: 10.1146/annurev.anchem.1.031207.112747. [DOI] [PubMed] [Google Scholar]
- 4.Israelachvili JN. Intermolecular and Surface Forces. 2nd. Academic press Inc.; San Diego: 1992. [Google Scholar]
- 5.Le Meins JF, Sandre O, Lecommandoux S. Recent trends in the tuning of polymersomes' membrane properties. Euro Phys J E. 2011;34:1–17. doi: 10.1140/epje/i2011-11014-y. [DOI] [PubMed] [Google Scholar]
- 6.Tong R, Christian DA, Tang L, Cabral H, Baker JR, Kataoka K, Discher DE, Cheng JJ. Nanopolymeric Therapeutics. MRS Bull. 2009;34:422–431. [Google Scholar]
- 7.Amstad E, Kohlbrecher J, Muller E, Schweizer T, Textor M, Reimhult E. Triggered Release from Liposomes through Magnetic Actuation of Iron Oxide Nanoparticle Containing Membranes. Nano Lett. 2011;11:1664–1670. doi: 10.1021/nl2001499. [DOI] [PubMed] [Google Scholar]
- 8.Gopalakrishnan G, Danelon C, Izewska P, Prummer M, Bolinger PY, Geissbuhler I, Demurtas D, Dubochet J, Vogel H. Multifunctional lipid/quantum dot hybrid nanocontainers for controlled targeting of live cells. Angew Chem Intl Ed. 2006;45:5478–5483. doi: 10.1002/anie.200600545. [DOI] [PubMed] [Google Scholar]
- 9.Li Y, Chen X, Gu N. Computational Investigation of Interaction between Nanoparticles and Membranes: Hydrophobic/Hydrophilic Effect. J Phys Chem B. 2008;112:16647–16653. doi: 10.1021/jp8051906. [DOI] [PubMed] [Google Scholar]
- 10.Ginzburg VV, Balijepailli S. Modeling the thermodynamics of the interaction of nanoparticles with cell membranes. Nano Lett. 2007;7:3716–3722. doi: 10.1021/nl072053l. [DOI] [PubMed] [Google Scholar]
- 11.Pan J, Tristram-Nagle S, Kucerka N, Nagle JF. Temperature Dependence of Structure, Bending Rigidity, and Bilayer Interactions of Dioleoylphosphatidylcholine Bilayers. Biophys J. 2008;94:117–124. doi: 10.1529/biophysj.107.115691. [DOI] [PMC free article] [PubMed] [Google Scholar]
- 12.Wi HS, Lee K, Pak HK. Interfacial energy consideration in the organization of a quantum dot-lipid mixed system. J Phys Cond Matt. 2008;20:494211. [Google Scholar]
- 13.Torchilin VP. Recent advances with liposomes as pharmaceutical carriers. Nature Rev Drug Disc. 2005;4:145–160. doi: 10.1038/nrd1632. [DOI] [PubMed] [Google Scholar]
- 14.Torchilin VP, Sawant RR. Liposomes as ‘smart’ pharmaceutical nanocarriers. Soft Matter. 2010;6:4026–4044. [Google Scholar]
- 15.Chen Y, Bose A, Bothun GD. Controlled Release from Bilayer-Decorated Magnetoliposomes via Electromagnetic Heating. ACS Nano. 2010;4:3215–3221. doi: 10.1021/nn100274v. [DOI] [PubMed] [Google Scholar]
- 16.Immordino ML, Dosio F, Cattel L. Stealth liposomes: review of the basic science, rationale, and clinical applications, existing and potential. Intl J Nanomed. 2006;1:297–315. [PMC free article] [PubMed] [Google Scholar]
- 17.Mann S, Hannington JP, Williams RJP. Phospholipid-Vesicles as a Model System for Biomineralization. Nature. 1986;324:565–567. doi: 10.1038/324565a0. [DOI] [PubMed] [Google Scholar]
- 18.Korgel BA, Monbouquette HG. Synthesis of size-monodisperse CdS nanocrystals using phosphatidylcholine vesicles as true reaction compartments. J Phys Chem. 1996;100:346–351. [Google Scholar]
- 19.Von White IG, Chen Y, Roder-Hanna J, Bothun GD, Kitchens CL. Structural and Thermal Analysis of Lipid Vesicles Encapsulating Hydrophobic Gold Nanoparticles. ACS Nano. 2012;6:4678–4685. doi: 10.1021/nn2042016. [DOI] [PubMed] [Google Scholar]
- 20.Mueller W, Koynov K, Fischer K, Hartmann S, Pierrat S, Basche T, Maskos M. Hydrophobic Shell Loading of PB-b-PEO Vesicles. Macromolecules. 2009;42:357–361. [Google Scholar]
- 21.Sanson C, Diou O, Thevenot J, Ibarboure E, Soum A, Brulet A, Miraux S, Thiaudiere E, Tan S, Brisson A, Dupuis V, Sandre O, Lecommandoux S. Doxorubicin Loaded Magnetic Polymersomes: Theranostic Nanocarriers for MR Imaging and Magneto-Chemotherapy. ACS Nano. 2011;5:1122–1140. doi: 10.1021/nn102762f. [DOI] [PubMed] [Google Scholar]
- 22.Krack M, Hohenberg H, Kornowski A, Lindner P, Weller H, Forster S. Nanoparticle-loaded magnetophoretic vesicles. J Am Chem Soc. 2008;130:7315–7320. doi: 10.1021/ja077398k. [DOI] [PubMed] [Google Scholar]
- 23.Hickey RJ, Haynes AS, Kikkawa JM, Park S. Controlling the Self-Assembly Structure of Magnetic Nanoparticles and Amphiphilic Block-Copolymers: From Micelles to Vesicles. J Am Chem Soc. 2011;133:1517–1525. doi: 10.1021/ja1090113. [DOI] [PubMed] [Google Scholar]
- 24.Mai Y, Eisenberg A. Controlled Incorporation of Particles into the Central Portion of Vesicle Walls. J Am Chem Soc. 2010;132:10078–10084. doi: 10.1021/ja1024063. [DOI] [PubMed] [Google Scholar]
- 25.Wang MF, Zhang M, Siegers C, Scholes GD, Winnik MA. Polymer Vesicles as Robust Scaffolds for the Directed Assembly of Highly Crystalline Nanocrystals. Langmuir. 2009;25:13703–13711. doi: 10.1021/la900523s. [DOI] [PubMed] [Google Scholar]
- 26.Akiyoshi K, Moritani Y, Nomura SM, Morita I. Direct integration of cell-free-synthesized connexin-43 into liposomes and hemichannel formation. FEBS J. 2010;277:3343–3352. doi: 10.1111/j.1742-4658.2010.07736.x. [DOI] [PubMed] [Google Scholar]
- 27.Bernhard F, Schwarz D, Dotsch V. Production of membrane proteins using cell-free expression systems. Proteomics. 2008;8:3933–3946. doi: 10.1002/pmic.200800171. [DOI] [PubMed] [Google Scholar]
- 28.Kudlicki W, Katzen F, Peterson TC. Membrane protein expression: no cells required. Trends in Biotechnol. 2009;27:455–460. doi: 10.1016/j.tibtech.2009.05.005. [DOI] [PubMed] [Google Scholar]
- 29.Jayanna PK, Torchilin VP, Petrenko VA. Liposomes targeted by fusion phage proteins. Nanomed. 2009;5:83–89. doi: 10.1016/j.nano.2008.07.006. [DOI] [PMC free article] [PubMed] [Google Scholar]
- 30.The god core of the nanocrystal has a diameter of 1.8 nm, but the alkanethiol capping ligand shells add another 1.6 nm, making the overall nanoparticle diameter about 5.0 nm.
- 31.Rasch MR, Rossinyol E, Hueso JL, Goodfellow BW, Arbiol J, Korgel BA. Hydrophobic Gold Nanoparticle Self-Assembly with Phosphatidylcholine Lipid: Membrane-Loaded and Janus Vesicles. Nano Lett. 2010;10:3733–3739. doi: 10.1021/nl102387n. [DOI] [PubMed] [Google Scholar]
- 32.Smith DK, Goodfellow BW, Smilgies DM, Korgel BA. Self-assembled simple hexagonal AB2 binary nanocrystal superlattices: SEM, GISAXS and Defects. J Am Chem Soc. 2009;131:3281–3290. doi: 10.1021/ja8085438. [DOI] [PubMed] [Google Scholar]
- 33.Available on the internet: http://www.datasqueezesoftware.com/
- 34.Guinier A, Fournet G. Small-Angle Scattering of X-Rays. Wiley; New York: 1955. [Google Scholar]
- 35.Glatter O, Kratky O, editors. Small-Angle X-Ray Scattering. Academic Press; New York: 1982. [Google Scholar]
- 36.Marsh D. CRC Handbook of Lipid Bilayers. CRC Press, Inc.; Boca Raton, FL: 1990. [Google Scholar]
- 37.Nagle JF, Pan J, Tristram-Nagle S, Kucerka N. Temperature dependence of structure, bending rigidity, and bilayer interactions of dioleoylphosphatidylcholine bilayers. Biophys J. 2008;94:117–124. doi: 10.1529/biophysj.107.115691. [DOI] [PMC free article] [PubMed] [Google Scholar]
- 38.Taurozzi JS, Hackley VA, Wiesner MR. Ultrasonic dispersion of nanoparticles for environmental, health and safety assessment—issues and recommendations. Nanotoxicology. 2011;5:711–729. doi: 10.3109/17435390.2010.528846. [DOI] [PubMed] [Google Scholar]
- 39.Brown W, Mortensen K. Scattering in Polymeric and Colloidal Systems. Gordon and Breach; Singapore: 2000. [Google Scholar]
- 40.McNeil SE. Characterization of Nanoparticles Intended for Drug Delivery. Humana Press; Totawa, N.J.: 2011. [Google Scholar]
- 41.Appell J, Porte G, Buhler E. Self-diffusion and collective diffusion of charged colloids studied by dynamic light scattering. J Phys Chem B. 2005;109:13186–13194. doi: 10.1021/jp051016k. [DOI] [PubMed] [Google Scholar]
- 42.Shukla A, Neubert RHH. Diffusion behavior of pharmaceutical O/W microemulsions studied by dynamic light scattering. Coll Polymer Sci. 2006;284:568–573. [Google Scholar]
- 43.Yan YD, Clarke JHR. Dynamic Light-Scattering from Concentrated Water-in-Oil Microemulsions the Coupling of Optical and Size Polydispersity. J Chem Phys. 1990;93:4501–4509. [Google Scholar]
- 44.Zulauf M, Eicke HF. Inverted Micelles and Microemulsions in the Ternary-System H2O-Aerosol-Ot-Isooctane as Studied by Photon Correlation Spectroscopy. J Phys Chem. 1979;83:480–486. [Google Scholar]
- 45.Daniel M, Astruc D. Gold Nanoparticles: Assembly, Supramolecular Chemistry, Quantum-Size-Related Properties, and Applications toward Biology, Catalysis, and Nanotechnology. Chem Rev. 2004;104:293–346. doi: 10.1021/cr030698+. [DOI] [PubMed] [Google Scholar]
- 46.Korgel BA, Fullam S, Connolly S, Fitzmaurice D. Assembly and self-organization of silver nanocrystal superlattices: Ordered “soft spheres”. J Phys Chem B. 1998;102:8379–8388. [Google Scholar]
- 47.Saunders AE, Korgel BA. Second Virial Coefficient Measurements of Dilute Gold Nanocrystal Dispersions Using Small-Angle X-ray Scattering. J Phys Chem B. 2004;108:16732–16738. [Google Scholar]
- 48.The amount of lipid in nanoparticle-loaded vesicles was estimated as the same as pure lipid vesicles of equal diameter.
- 49.Efrat R, Kesselman E, Aserin A, Garti N, Danino D. Solubilization of Hydrophobic Guest Molecules in the Monoolein Discontinuous Q(L) Cubic Mesophase and Its Soft Nanoparticles. Langmuir. 2009;25:1316–1326. doi: 10.1021/la8016084. [DOI] [PubMed] [Google Scholar]
- 50.Based on fully extended alkanethiol chains.
- 51.Sjolund M, Lindblom G, Rilfors L, Arvidson G. Hydrophobic Molecules in Lecithin Water-Systems .1. Formation of Reversed Hexagonal Phases at High and Low Water Contents. Biophys J. 1987;52:145–153. doi: 10.1016/S0006-3495(87)83202-2. [DOI] [PMC free article] [PubMed] [Google Scholar]
- 52.Mirkin CA, Hurst SJ, Hill HD, Macfarlane RJ, Wu JS, Dravid VP. Synthetically Programmable DNA Binding Domains in Aggregates of DNA-Functionalized Gold Nanoparticles. Small. 2009;5:2156–2161. doi: 10.1002/smll.200900568. [DOI] [PMC free article] [PubMed] [Google Scholar]
- 53.Jiang M, Liu Z. Reversible aggregation of gold nanoparticles driven by inclusion complexation. J Mater Chem. 2007;17:4249–4254. [Google Scholar]
- 54.Mandal TK, Si S. pH-controlled reversible assembly of peptide-functionalized gold nanoparticles. Langmuir. 2007;23:190–195. doi: 10.1021/la061505r. [DOI] [PubMed] [Google Scholar]
- 55.Seddon JM. Structure of the Inverted Hexagonal (Hii) Phase, and Non-Lamellar Phase-Transitions of Lipids. Biochim Biophys Acta. 1990;1031:1–69. doi: 10.1016/0304-4157(90)90002-t. [DOI] [PubMed] [Google Scholar]
- 56.Lohner K. Effects of Small Organic-Molecules on Phospholipid Phase-Transitions. Chem Phys Lipids. 1991;57:341–362. doi: 10.1016/0009-3084(91)90085-p. [DOI] [PubMed] [Google Scholar]
- 57.Gustafsson J, Ljusberg-Wahren H, Almgren M, Larsson K. Submicron Particles of reversed lipid phases in water stabilized by a nonionic amphiphilic polymer. Langmuir. 1997;13:6964–6971. [Google Scholar]
- 58.Luzzati V, Tardieu A. Lipid Phases—Structure and Structural Transitions. Ann Rev Phys Chem. 1974;25:79–94. [Google Scholar]
- 59.Regen SL, Turkyilmaz S, Chen WH, Mitomo H. Loosening and Reorganization of Fluid Phospholipid Bilayers by Chloroform. J Am Chem Soc. 2009;131:5068–5069. doi: 10.1021/ja9011468. [DOI] [PMC free article] [PubMed] [Google Scholar]
- 60.Reigada R. Influence of Chloroform in Liquid-Ordered and Liquid-Disordered Phases in Lipid Membranes. J Phys Chem B. 2011;115:2527–2535. doi: 10.1021/jp110699h. [DOI] [PubMed] [Google Scholar]
- 61.Phonphok N, Chidichimo G, Westerman PW. Disposition of chloroform in phosphatidylcholine membranes: A H-2- and P-31-NMR study. Chem Phys Lipids. 1996;83:25–37. [Google Scholar]
- 62.Cantor RS. The lateral pressure profile in membranes: A physical mechanism of general anesthesia. Biochemistry. 1997;36:2339–2344. doi: 10.1021/bi9627323. [DOI] [PubMed] [Google Scholar]
- 63.Alakoskela JM, Vitovic P, Kinnunen PKJ. Screening for the Drug-Phospholipid Interaction: Correlation to Phospholipidosis. ChemMedChem. 2009;4:1224–1251. doi: 10.1002/cmdc.200900052. [DOI] [PubMed] [Google Scholar]
- 64.Burnell EE, Cullis PR, Kruijff BD. Effects of tumbling and lateral diffusion on phosphatidylcholine model membrane 31P-NMR lineshapes. Biochim Biophys Acta. 1980;603:63–69. doi: 10.1016/0005-2736(80)90391-0. [DOI] [PubMed] [Google Scholar]
- 65.Tilcock CPS, Cullis PR, Gruner SM. On the validity of 31P-NMR determinations of phospholipid polymorphic phase behavior. Chem Phys Lipids. 1986;40:47–56. [Google Scholar]
- 66.Stillwell W, Shaikh SR, Dumaual AC, Jenski LJ. Lipid phase separation in phospholipid bilayers and monolayers modeling the plasma membrane. Biochim Biophy Acta Biomembranes. 2001;1512:317–328. doi: 10.1016/s0005-2736(01)00335-2. [DOI] [PubMed] [Google Scholar]
- 67.Hall RA, Thistlethwaite PJ, Grieser F. An Investigation of Miscibility in Guest-Host Monolayers by Surface Pressure and Fluorescence Methods. Langmuir. 1993;9:2128–2132. [Google Scholar]
- 68.Kundu SKS. Layer-by-Layer Assembly of Thiol-Capped Au Nanoparticles on a Water Surface and Their Deposition on H-Terminated Si(001) by the Langmuir-Blodgett Method. Langmuir. 2011;27:3930–3936. doi: 10.1021/la104306m. [DOI] [PubMed] [Google Scholar]
- 69.Jelinek R, Mogilevsky A, Volinsky R, Dayagi Y, Markovich N. Gold Nanoparticle Self-Assembly in Saturated Phospholipid Monolayers. Langmuir. 2010;26:7893–7898. doi: 10.1021/la9047903. [DOI] [PubMed] [Google Scholar]
- 70.Pansu B, Lecchi A, Constantin D, Imperor-Clerc M, Veber M, Dozov I. Insertion of Gold Nanoparticles in Fluid Mesophases: Size Filtering and Control of Interactions. J Phys Chem C. 2011;115:17682–17687. [Google Scholar]
- 71.Abbassi R, Chamkhia N, Sakly M. Chloroform-induced oxidative stress in rat liver: Implication of metallothionein. Toxicol Ind Health. 2010;26:487–496. doi: 10.1177/0748233710373088. [DOI] [PubMed] [Google Scholar]
- 72.Beddowes EJ, Faux SP, Chipman JK. Chloroform, carbon tetrachloride and glutathione depletion induce secondary genotoxicity in liver cells via oxidative stress. Toxicology. 2003;187:101–115. doi: 10.1016/s0300-483x(03)00058-1. [DOI] [PubMed] [Google Scholar]
- 73.Aggazzotti G, Fantuzzi G, Tartoni L, Predieri G. Plasma chloroform concentrations in swimmers using indoor pools. Archives of Environmental Health: An International Journal. 1990;45:175–179. doi: 10.1080/00039896.1990.9936712. [DOI] [PubMed] [Google Scholar]
Associated Data
This section collects any data citations, data availability statements, or supplementary materials included in this article.


