Abstract
Molecular dating of species divergences has become an important means to add a temporal dimension to the Tree of Life. Increasingly larger datasets encompassing greater taxonomic diversity are becoming available to generate molecular timetrees by using sophisticated methods that model rate variation among lineages. However, the practical application of these methods is challenging because of the exorbitant calculation times required by current methods for contemporary data sizes, the difficulty in correctly modeling the rate heterogeneity in highly diverse taxonomic groups, and the lack of reliable clock calibrations and their uncertainty distributions for most groups of species. Here, we present a method that estimates relative times of divergences for all branching points (nodes) in very large phylogenetic trees without assuming a specific model for lineage rate variation or specifying any clock calibrations. The method (RelTime) performed better than existing methods when applied to very large computer simulated datasets where evolutionary rates were varied extensively among lineages by following autocorrelated and uncorrelated models. On average, RelTime completed calculations 1,000 times faster than the fastest Bayesian method, with even greater speed difference for larger number of sequences. This speed and accuracy will enable molecular dating analysis of very large datasets. Relative time estimates will be useful for determining the relative ordering and spacing of speciation events, identifying lineages with significantly slower or faster evolutionary rates, diagnosing the effect of selected calibrations on absolute divergence times, and estimating absolute times of divergence when highly reliable calibration points are available.
Keywords: bioinformatics, timescales, relaxed clocks
Thousands of research studies have reported the use of molecular dating techniques in establishing the timing of species divergences (e.g., refs. 1–5). With the availability of fast and cheap genome sequencing, molecular dating is being applied to increasingly larger datasets that span a much greater diversity of species and harbor extensive heterogeneity of evolutionary rates among lineages. This complexity poses many challenges that limit modern scientific investigations from truly leveraging the genome revolution. First, the application of the fastest molecular dating tools available already requires a very large amount of computational time for datasets containing only a few hundred sequences, which are modest for today’s standards (6, 7). Second, current approaches require a priori selection of statistical distributions to model the heterogeneity of rates among branches in the evolutionary tree (e.g., autocorrelated versus uncorrelated rates, 8–12). Use of an incorrect statistical distribution is known to introduce significant bias in such analyses (10, 13–15). With increasingly larger datasets, it is unlikely that the same rate model will fit evolutionarily distant groups in the same large phylogeny, which exacerbates the problem. Third, the current molecular dating approaches also require reliable knowledge of some a priori divergence times, their minimum-maximum boundaries, and uncertainty distributions, all of which are seldom available or universally agreed on (17–19). These constraints, referred to as clock calibrations, are the root cause of many controversies, because the final time estimates naturally depend strongly on the clock calibrations selected (20, 21). Some now argue that clock calibrations used in many studies may be flawed (19, 22–27). For these reasons, molecular-based time estimates for many important divergences in the evolutionary history show notable differences not only with the estimates from the nonmolecular data (e.g., fossil record), but also from each other (e.g., refs. 3, 4, and 19–21).
We have developed a method that is designed to avoid many of these problems and produces a relative time of divergence for every branching point in the phylogenetic tree. In our approach, branch-specific relative rates are estimated without using a specific distribution of lineage rate heterogeneity and by applying the fact that the elapsed time of two sister lineages from their most recent common ancestor is equal, which is tantamount to using calibrations points with time equal to 0 for each contemporary sequence in the tree. In the following, we first describe the maximum likelihood (ML) version of our approach by using data from a simple example. This description is followed by an evaluation of its accuracy and comparative superiority over a Bayesian approach in computer simulated alignments by using a model timetree, which is an order of magnitude larger than those used in computer simulations in previous molecular clock studies. Furthermore, we present an analysis of a recently published empirical mammalian sequence dataset and show that RelTime estimates are close to those obtained by using a very large number of calibration points and a sophisticated Bayesian method.
RelTime Method for Estimating Relative Divergence Times
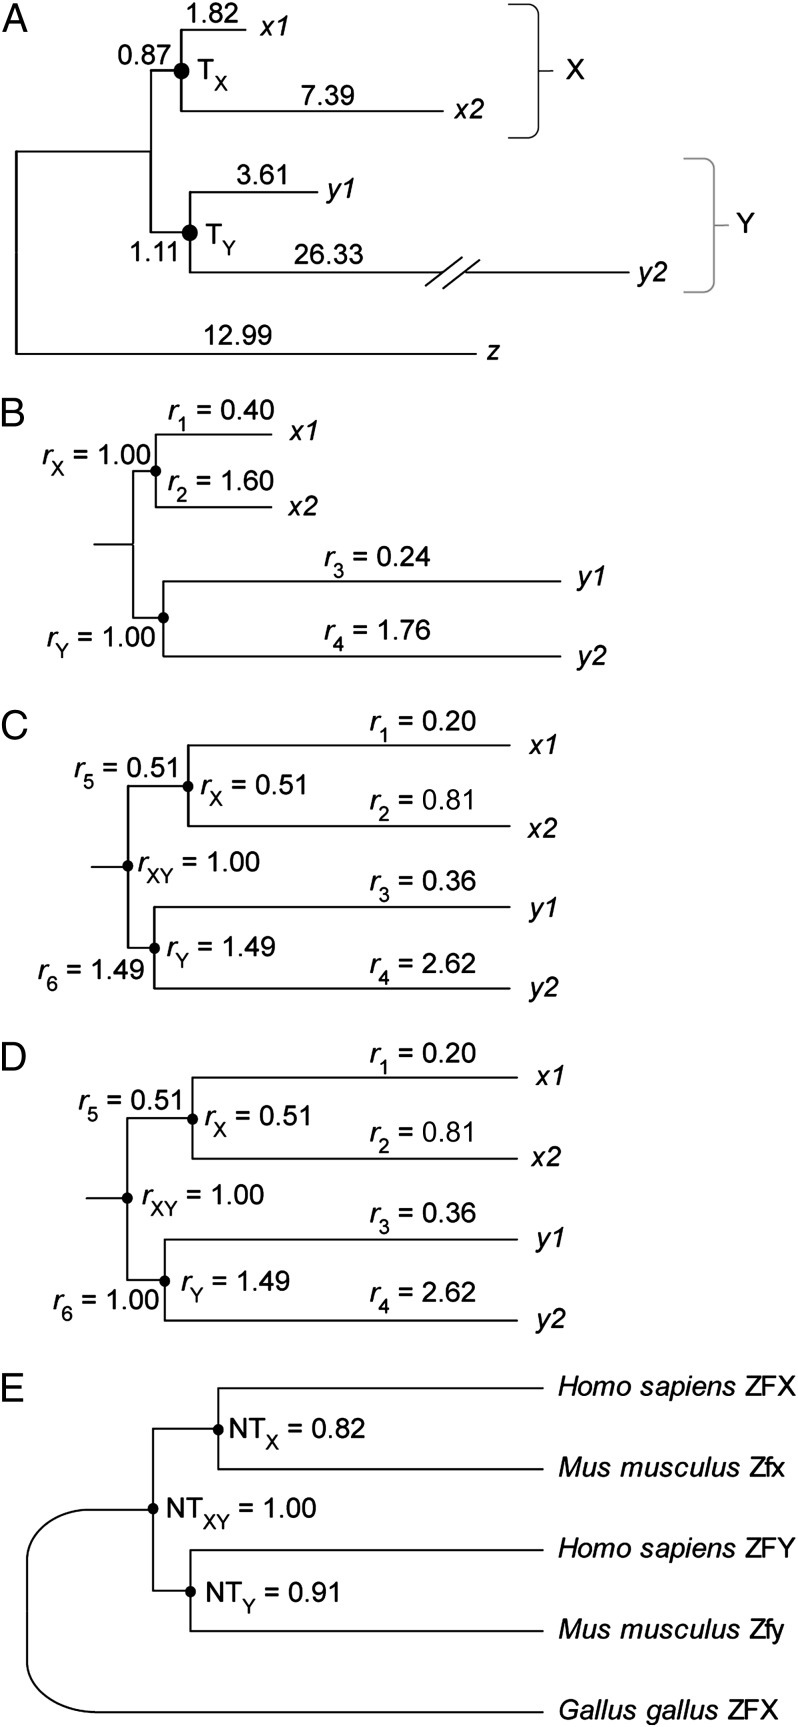
We explain the RelTime approach by using a simple example, where sequence evolution shows large rate differences within and between groups (X and Y; Fig. 1A). As expected, a likelihood ratio test (LRT) rejects the molecular clock hypothesis overwhelmingly (ΔlnL = 208; P << 0.01), so a global clock cannot be assumed for estimating divergence times Tx and Ty. Instead, RelTime computes branch-specific relative rates (r1 … r6) and starts with nodes that have only two descendants. For the two descendants of node X, the relative rates are r1 = 0.40 and r2 = 1.60. They are obtained by dividing the branch lengths (per 100 base pairs) by the average height of the node X (4.61). Here, r1 and r2 capture deviation from equal rates, where a value of less than 1 indicates a relative slowdown and a value of greater than 1 indicates a speed-up. Node X is given a rate equal to 1 (rX = 1), which is the average of the two descendant nodes. Similarly, we compute r3 = 0.24 and r4 = 1.76 for the two descendant branches from node Y, with rY = 1. Note that the relative rates are not comparable across lineages because they are estimated based on their local context only, i.e., r1 and r2 cannot be compared with r3 and r4 at this stage. For this reason, node and branch rates in groups X and Y are initial assignments, and they need to be adjusted based on their higher level relationships.
Fig. 1.
RelTime approach for estimating relative rates and times. The phylogeny is obtained from a sequence alignment of 2,322 base pairs with HKY+Γ model by using ML (lnL = −7,295.91). (A) The ML branch lengths in the units of number of substitutions per 100 base pairs. (B) Estimates of relative evolutionary rates within clade X and within clade Y. (C) Estimates of relative rates in all descendent branches and nodes of the most recent common ancestor of clades X and Y. (D) Updated relative rates after setting r6 = rY, because they were found to be not statistically significantly different. The log likelihood of the resulting tree (lnL = −7,295.96) is only marginally different from that of the original tree (see above). (E) The final timetree showing relative node times (NTs) normalized such that the maximum relative NT is 1. The evolutionary tree in A is from five sequences, two each from human and mouse and one from chicken (GenBank accession no. gi296010876; gi113205066; gi223890138; gi156938288; and gi363728820). They were aligned by ClustalW at the amino acid level. This alignment was used for a ML tree under the HKY+ Γ nucleotide substitution model after removing all sites containing gaps (28–30).
We next compute relative rates for the two lineages descending from the node XY. These estimates are 0.51 for the lineage leading to group X and 1.49 for the lineage leading to group Y; they are obtained by dividing the total lineage length to group X and to group Y by the average height (10.78) of node XY (Fig. 1B). Therefore, r5 = 0.51 and r6 = 1.49. Therefore, rX and rY rates need to be in the ratio 0.51:1.49, which is achieved by scaling the descendant branch rates by the respective ancestral relative rates, e.g., new r1 = 0.40 × 0.51 = 0.20 (Fig. 1C). After the application of this procedure, all of the branch rates (r1 … r6) become directly comparable, with the ingroup ancestral node XY automatically assigned an average rate of 1.0.
In the next step, all of these rate estimates are refined by statistically testing the significance of the difference between the descendent branch and ancestral node pairs individually, such that the smallest number of rate parameters is estimated to avoid statistical overfitting and higher variances. This test can be done by using the SEs obtained by the curvature method applied to the trend of ML optimization (28) or by estimating variances of relative rates by the bootstrap procedure. Any descendant branches with rates not statistically significantly different from the ancestral node rate are assigned the ancestral node rate. This process showed that r6 = rXY (Fig. 1D). ML branch length optimization with that constraint produced a tree in which the log likelihood value is reduced marginally (2ΔlnL = 0.1), which is not statistically significant (LRT, χ2 with 1 degree of freedom).
Using the final estimates of rates, we obtain node times (Tx and Ty) and time elapsed on individual branches (Fig. 1E). Because all of the evolutionary rates are relative, the resulting time estimates are also relative. Finally, it is useful to note that Tx and Ty correspond to the human-mouse species divergence in two duplicated genes (Zfx and Zfy) that are found on the X and Y chromosomes, respectively (29–31). The ratio of TX:TY is 0.9, which is close to the expected value of 1.0.
Results
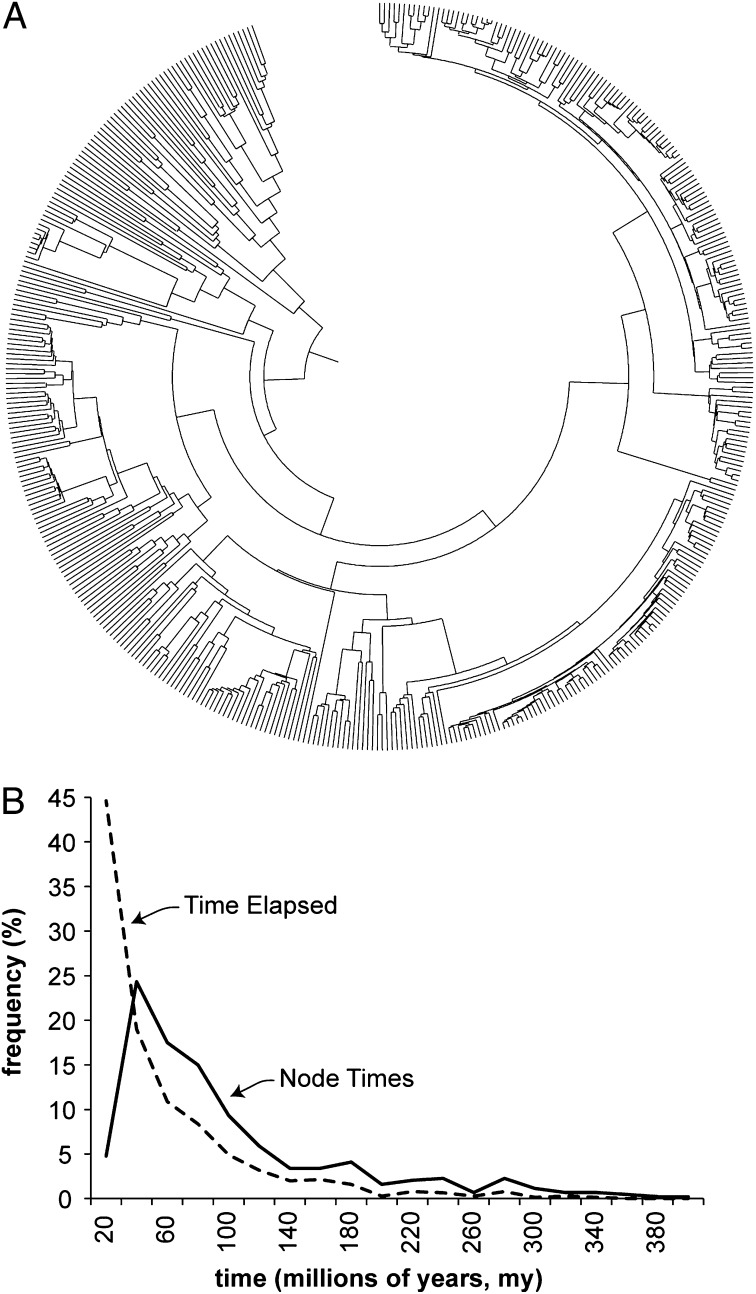
We assessed the absolute and comparative accuracy and calculation speed of RelTime by means of computer-simulated alignments. We generated hundreds of sequence alignments by applying substitution parameters sampled from a natural set on a large phylogeny containing 446 taxa (Fig. 2A; Methods). The simulated datasets encompassed a wide distribution of node divergences and times elapsed on individual branches (Fig. 2B). Four types of evolutionary rate variations were applied to this tree while generating the sequence data. The simplest was the constant rate (CR) scenario, where the actual number of substitutions on a branch was determined according to a Poisson process with the mean equal to the expected number of substitutions (determined by average rate and sequence length). In this case, the rate variation among lineages is only due to the stochastic nature of the evolutionary process. Then, we generated sequence alignments where the rate variation among lineages was autocorrelated (AR), such that the rate of a descendant branch was drawn from a lognormal distribution around the mean rate of the ancestral branch (see details in refs. 6 and 15). Finally, we conducted simulations by using two cases in which the (expected) evolutionary rates varied randomly on each branch by ±50% or ±100% of the overall rate. We refer to them as random rate simulations (RR50 and RR100, respectively).
Fig. 2.
The model timetree for computer simulations. (A) A timetree of 446 taxa. (B) Distribution of divergence times on nodes (solid curve) and times elapsed on branches (dashed curve).
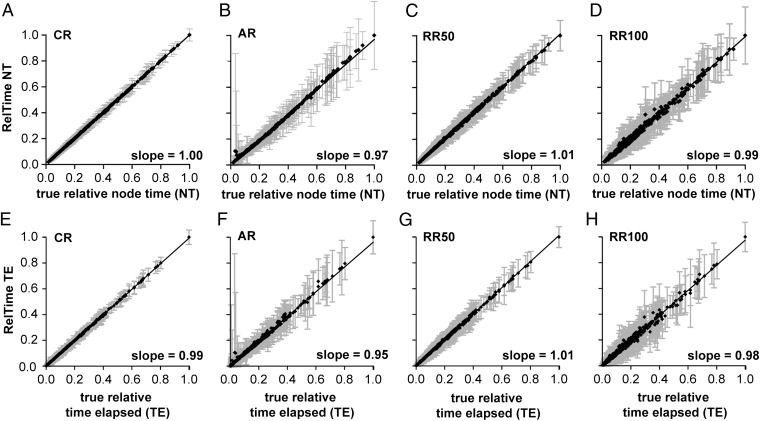
RelTime estimates showed a linear relationship with the true times. This trend was clearly evident from a direct comparison of the true and estimated times (Fig. 3). In this comparison, we normalized the RelTime and true time estimates to vary on the same scale (0–1; Methods) such that the expected slope is 1.0. Indeed, the slope of the linear regression through the origin is close to 1 for CR, AR, RR50, and RR100 datasets for node times (NTs; Fig. 3 A–D). NTs in a timetree are correlated because of sharing of evolutionary lineages, so we examined the relationship of the estimated and true times elapsed (TEs) on branches. Again, the slopes of the linear regressions were close to 1 for estimated and true TEs in every case (Fig. 3 E–H), which confirms the result obtained for NTs. As expected, the variance becomes higher when the evolutionary rate variation is large (Fig. 3).
Fig. 3.
Accuracy of RelTime estimates. (A–D) Estimated versus true node times (NTs) for simulated datasets under CR, AR, and RRs (RR50, R100). (E–H) Estimated versus true TEs on branches. Each data point represents the average of normalized times from 100 simulations (±1 SD). Each graph contains the linear regression slope through the origin.
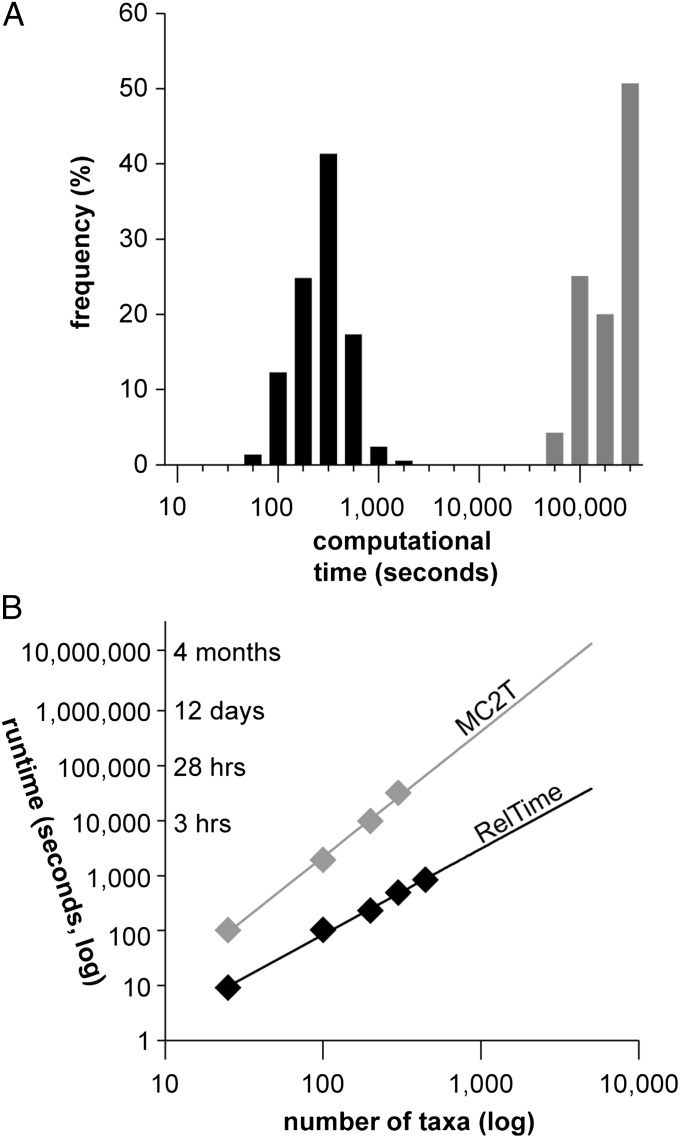
We also compared the performance of RelTime with that of a Bayesian approach. We selected MCMCTree (MC2T) from among the widely used software packages (11, 12), because MC2T is much more computationally efficient and performs as well as other more computationally expensive methods (6, 7). Even though MC2T is fast, it still required 1,000 times larger calculation time than our approach, with many MC2T calculations taking multiple days (Fig. 4A). Our projections show that for datasets containing thousands of sequences, MC2T will be extremely time expensive, whereas RelTime will produce results within a few hours (Fig. 4B). We did not use BEAST (11) in our simulation analysis because it is expected to take 1,000 fold longer than even MC2T (6), making it impractical for simulation analysis of large phylogenies. However, results with smaller datasets in the past have shown that MC2T and BEAST perform similarly (6).
Fig. 4.
Computational time required by RelTime and MC2T for 500 simulated datasets. (A) Absolute computational times for RelTime (black bars) and MC2T (gray bars). (B) Projected computational times for a large number of sequences. These times were estimated by using an alignment of 4,493 sites on a single core computer. For this dataset, the best fit exponential equation was 0.06 × n2.28 and 0.06 × n1.56 for MC2T and RelTime, respectively, where n is the number of sequences.
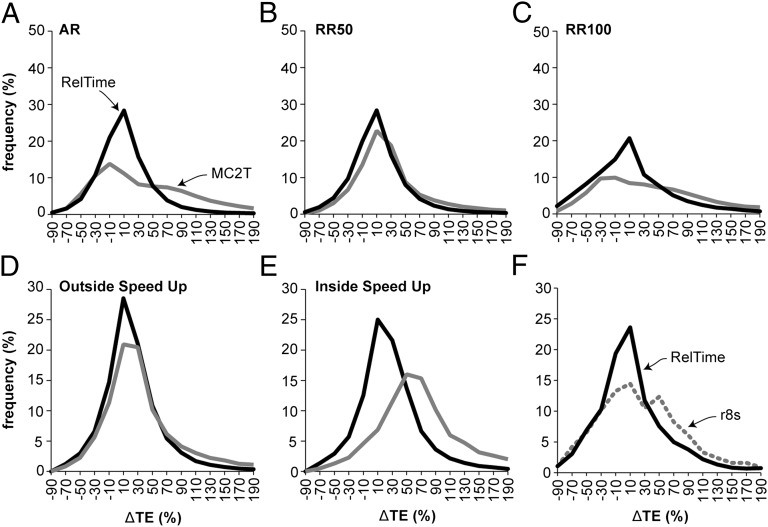
Compared with RelTime, we found that the differences between the estimated and true TEs displayed a large dispersion when MC2T is used (Fig. 5, gray curves). MC2T shows a high propensity to overestimate elapsed times when the rates are autocorrelated (Fig. 5A) and when the rate variation is large (RR100; Fig. 5C). Similar trends are observed for node time estimates (Fig. S1). In all of these analyses, we used the correct model of rate variation in MC2T, which rules out model violation as a reason for the observed performance of MC2T. Furthermore, MC2T was used with a perfect calibration with tight boundaries around the true time (±1 million year; My), which prevented interactions between uncertainties in rate estimations and statistical distributions of multiple calibrations.
Fig. 5.
Distributions of the normalized differences between estimated and true TEs on branches. (A–C) Comparisons of RelTime (black curve) and MC2T (gray curve) performances for datasets simulated with AR and RRs (RR50, RR100). Relative performances of MC2T and RelTime for estimating times outside (D) and inside (E) the speed-up clades. (F) Comparison of the accuracy of RelTime (black solid) and r8s (gray dotted) for RR100 and RR50+50 datasets. The corresponding panels for relative node times (NTs) are shown in Fig. S1.
We also evaluated the performance of RelTime when there were clade-specific rate changes, because many molecular phylogenies show clades with concerted speed-ups and slow-downs (e.g., ref. 32). To investigate the effect of such a scenario on the performance of RelTime, we imposed an additional 50% rate acceleration on random clades in the RR50 simulation (RR50+50; Methods). Neither autocorrelated nor random rate variation models perfectly fit the distribution of lineage rates for RR50+50 datasets, which enabled an assessment of the robustness of the RelTime and MC2T approaches for such data.
RelTime produced times that show an excellent correspondence with the true NTs and TEs for all nodes in the speed-up clade (Fig. 5 D and E). However, the accuracy of MC2T was worse for nodes in the speed-up clade (Fig. 5E, gray curve). Because MC2T performed generally well for RR50 data (Fig. 3 C and G), the observed difference in performance between RelTime and MC2T is likely because RelTime does not impose a prespecified rate variation model, unlike MC2T. This result prompted us to examine the performance of r8s, which uses a semiparametric rate smoothing approach (penalized likelihood method) to model a variety of conditions in a tree that range from clock-like to non–clock-like (33). However, r8s performed worse than RelTime for RR100 and RR50+50 datasets analyzed (Fig. 5F).
Discussion
We have described an approach for building timetrees that decouples the estimation of relative lineage-specific rates from the inference of absolute times of divergence. This method enables the estimation of relative divergence times without requiring the prespecification of statistical distribution of lineage rates and clock calibrations. These properties also make the RelTime method orders of magnitude faster than the fastest Bayesian method available. At the same time, our computer simulation results have shown that our method performs as well as or better than the other approaches that are practical for large datasets.
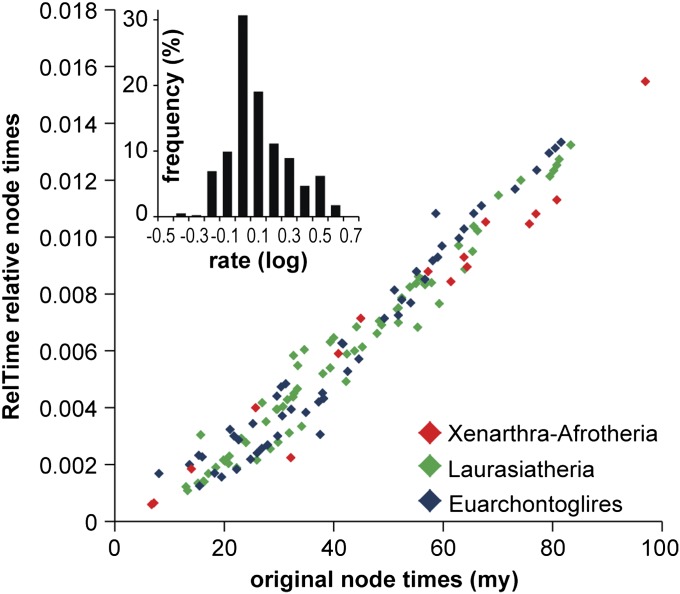
As an example application, we used RelTime to reanalyze a recent dataset of mammalian species in which divergence times were obtained with MC2T (4). Their analysis used 82 calibrations (64 constraining nodes within the placental mammals). We compared RelTime estimates to those obtained by using MC2T for divergences among 138 placentals (with 24 marsupial sequences used as outgroups; 162 total sequences) using the same substitution model and the original alignment and phylogeny. We found a linear relationship between the two estimates for each of the three major clades identified (Fig. 6), although RelTime did not require any calibration information or a prespecified lineage rate distribution. A similar result was observed when analyzing third codon positions (Fig. S2A), all codon positions (Fig. S2B), or only retaining amino acid positions containing fewer than 10% gaps (Fig. S2C).
Fig. 6.
Comparisons of node times in RelTime (y axis) and MC2T (x axis) for the tree of 138 placental mammals, where marsupials were used to root the tree. Node times are relative estimates in RelTime and absolute values in MC2T (millions of years; My). Nodes in major clades are color coded by following Meredith et al. (4). Inset shows the distribution of relative evolutionary rates produced by RelTime, where the negative values indicate slower and positive values indicate faster rate than the ancestral average rate of 1. The skewness and kurtosis for the distribution of logarithmically transformed data (0.54 and 0.32, respectively) were much smaller than those for the raw data (1.73 and 3.51), indicating that the lognormal distribution is a better fit. The dataset analyzed consisted of an alignment of 11,010 amino acid positions (4). A JTT+Γ model was used in RelTime, as in ref. 4.
RelTime also yielded a distribution of amino acid substitution rates among lineages, which we found to fit a lognormal distribution better than a normal distribution (Fig. 6, Inset). We also found that we could convert relative times into absolute time estimates that were close to those reported in ref. 4 by deriving an average evolutionary rate from just three (instead of 64) placental calibrations that showed smallest relative difference between the minimum and maximum boundaries, i.e., most tightly constrained (Table S1).
We anticipate that the relative times and branch rates produced by RelTime will be useful in many different ways. First, the relative times are directly useable for determining the relative ordering and spacing of divergence events on a phylogeny. Second, the branch (relative) rates produced by RelTime directly reveal the statistical properties of the distribution of evolutionary rates in a phylogeny, which exposes clades and lineages with significantly slower or faster evolutionary rates. This approach can be used not only for different groups of species, but also for duplicated genes. Third, the relative times obtained from molecular data can be directly compared with available times from nonmolecular data (e.g., fossil record) without the problem of circularity. This comparison will enable a better assessment of concordance between times suggested by different types of data. Fourth, the relative times will be useful in diagnosing the effect of selected calibrations on absolute divergence times by looking for the discordance of relative times from RelTime and estimated times assuming different clock calibrations in Bayesian and other methods. Fifth, relative times can be translated into absolute times by using the most tightly constrained calibration times (i.e., the upper and lower bounds are close to each other), a practice that has been advocated by many (17, 34). Therefore, the RelTime approach appears to be accurate and fast, with a promise to be useful for testing evolutionary hypotheses quickly in the fields of molecular phylogenetics and the evolution of multigene families, both of which are important to understanding the evolution of new functions and adaptations (35–37).
Methods
Computer Simulation.
We conducted computer simulations to generate nucleotide sequence alignments for which the gene lengths and other evolutionary parameters were drawn from the distribution of the number of sites (range 445–4,439 sites), evolutionary rates (range 1.35–2.60 substitutions per site per billion years, GC contents (range 39–82%), and transition/transversion ratio (range 1.9–6.0) presented in ref. 38. Five independent sets of simulations, with 100 replicates each, were carried out by using CR, AR, and varying RR among lineages by following the procedures in ref. 15. For AR, we used autocorrelation parameter ν = 1 (39). The RR cases were simulated under two scenarios. In the first scenario (RR50), the branch-specific evolutionary rate was drawn from a uniform distribution over the open interval ranging from 0.5r to 1.5r, where r is the nominal rate for the entire gene. In the second scenario (RR100), this interval was increased to range from 0 to 2r. For the clade-specific speed-ups, we used RR50 as the baseline system and applied a specified amount of rate increase, to a randomly selected group of branches containing at least 50 nodes (termed the speed-up clade). We used SeqGen (40) under the Hasegawa–Kishino–Yano (HKY) model (41) to generate alignments by using the master phylogeny of 446 taxa, which was derived from the bony-vertebrate clade in the Timetree of Life (42); all polytomies were pruned.
Molecular Dating Analyses.
In all analyses, we used the correct model of nucleotide substitution, the correct phylogeny, and the correct model of rate variation among lineages (MC2T). RelTime estimates were obtained by using its own program (which will be released upon the publication of this work), and MC2T (PAML version 4.5; ref. 12) was used. For MC2T, the time estimation process was completed after 50,000 chains and a burn-in of 10%. For each of the 500 alignments, the time estimation process was run twice to ensure convergence had been reached. Other parameters were as follows: birth-death values (2 2 0); kappa_gamma (1 dataset-specific); and sigma2_gamma (1 dataset-specific). For MC2T, we used a single calibration node of depth 324.5 My centered around its true time (323.5–325.5 My) to fulfill the program requirements. Note that MC2T only completed the analysis of 38 (of 100) alignments for RR100 (maximum calculation time limit = 60 h), so the results presented are from completed analyses only. For r8s (33), we used the semiparametric penalized likelihood model (TN algorithm, five random starting points) for four simulated datasets. Branch lengths were obtained via ML (HKY, uniform rates) by using MEGA version 5.0 (43). The cross-validation procedure to infer the appropriate smoothing rate factor failed to complete for most values tested for our large dataset; range of the log(smooth) = 0.0–3.9. However, large rate variations like the ones simulated here can be modeled by small smoothing factors. Therefore, we tested three smoothing parameters (0.1, 1, and 10), which yielded similar results.
Measurements of Accuracies.
All comparisons of estimated and true times for computer simulated data involved normalized values, which were obtained by dividing the given time by the maximum time in the tree. This normalization was applied for both the node times (NTs) and the times elapsed (TEs). The percent difference in time elapsed (ΔTE) is the difference between the true and the estimated TE divided by the true TE and multiplied by 100.
Supplementary Material
Acknowledgments
We thank Bill Murphy for promptly providing the mammalian dataset. This work is supported by funding from National Institutes of Health Grant R01 HG002096-11 and National Science Foundation Grant DBI-0850013 (to S.K.) and from Japan Society for the Promotion of Science Grants 23370096, 24370033, and 30398036 (to K.T.).
Footnotes
The authors declare no conflict of interest.
This article is a PNAS Direct Submission.
This article contains supporting information online at www.pnas.org/lookup/suppl/doi:10.1073/pnas.1213199109/-/DCSupplemental.
References
- 1.Trueba G, Dunthorn M. Many neglected tropical diseases may have originated in the Paleolithic or before: New insights from genetics. PLoS Negl Trop Dis. 2012;6(3):e1393. doi: 10.1371/journal.pntd.0001393. [DOI] [PMC free article] [PubMed] [Google Scholar]
- 2.Kumar S, Hedges SB. TimeTree2: Species divergence times on the iPhone. Bioinformatics. 2011;27(14):2023–2024. doi: 10.1093/bioinformatics/btr315. [DOI] [PMC free article] [PubMed] [Google Scholar]
- 3.Erwin DH, et al. The Cambrian conundrum: Early divergence and later ecological success in the early history of animals. Science. 2011;334(6059):1091–1097. doi: 10.1126/science.1206375. [DOI] [PubMed] [Google Scholar]
- 4.Meredith RW, et al. Impacts of the Cretaceous Terrestrial Revolution and KPg extinction on mammal diversification. Science. 2011;334(6055):521–524. doi: 10.1126/science.1211028. [DOI] [PubMed] [Google Scholar]
- 5.Hedges SB, Kumar S. In: The Timetree of Life. Hedges SB, Kumar S, editors. New York: Oxford Univ Press; 2009. [Google Scholar]
- 6.Battistuzzi FU, Billing-Ross P, Paliwal A, Kumar S. Fast and slow implementations of relaxed-clock methods show similar patterns of accuracy in estimating divergence times. Mol Biol Evol. 2011;28(9):2439–2442. doi: 10.1093/molbev/msr100. [DOI] [PMC free article] [PubMed] [Google Scholar]
- 7.dos Reis M, Yang Z. Approximate likelihood calculation on a phylogeny for Bayesian estimation of divergence times. Mol Biol Evol. 2011;28(7):2161–2172. doi: 10.1093/molbev/msr045. [DOI] [PubMed] [Google Scholar]
- 8.Thorne JL, Kishino H, Painter IS. Estimating the rate of evolution of the rate of molecular evolution. Mol Biol Evol. 1998;15(12):1647–1657. doi: 10.1093/oxfordjournals.molbev.a025892. [DOI] [PubMed] [Google Scholar]
- 9.Thorne JL, Kishino H. Divergence time and evolutionary rate estimation with multilocus data. Syst Biol. 2002;51(5):689–702. doi: 10.1080/10635150290102456. [DOI] [PubMed] [Google Scholar]
- 10.Drummond AJ, Ho SY, Phillips MJ, Rambaut A. Relaxed phylogenetics and dating with confidence. PLoS Biol. 2006;4(5):e88. doi: 10.1371/journal.pbio.0040088. [DOI] [PMC free article] [PubMed] [Google Scholar]
- 11.Drummond AJ, Rambaut A. BEAST: Bayesian evolutionary analysis by sampling trees. BMC Evol Biol. 2007;7:214. doi: 10.1186/1471-2148-7-214. [DOI] [PMC free article] [PubMed] [Google Scholar]
- 12.Yang ZH. PAML 4: Phylogenetic analysis by maximum likelihood. Mol Biol Evol. 2007;24(8):1586–1591. doi: 10.1093/molbev/msm088. [DOI] [PubMed] [Google Scholar]
- 13.Lepage T, Bryant D, Philippe H, Lartillot N. A general comparison of relaxed molecular clock models. Mol Biol Evol. 2007;24(12):2669–2680. doi: 10.1093/molbev/msm193. [DOI] [PubMed] [Google Scholar]
- 14.Ho SYW. An examination of phylogenetic models of substitution rate variation among lineages. Biol Lett. 2009;5(3):421–424. doi: 10.1098/rsbl.2008.0729. [DOI] [PMC free article] [PubMed] [Google Scholar]
- 15.Battistuzzi FU, Filipski A, Hedges SB, Kumar S. Performance of relaxed-clock methods in estimating evolutionary divergence times and their credibility intervals. Mol Biol Evol. 2010;27(6):1289–1300. doi: 10.1093/molbev/msq014. [DOI] [PMC free article] [PubMed] [Google Scholar]
- 16.Ho SYW, et al. Time-dependent rates of molecular evolution. Mol Ecol. 2011;20(15):3087–3101. doi: 10.1111/j.1365-294X.2011.05178.x. [DOI] [PubMed] [Google Scholar]
- 17.Hedges SB, Kumar S. Precision of molecular time estimates. Trends Genet. 2004;20(5):242–247. doi: 10.1016/j.tig.2004.03.004. [DOI] [PubMed] [Google Scholar]
- 18.Benton MJ, Donoghue PCJ, Asher RJ. Calibrating and constraining molecular clocks. In: Hedges SB, Kumar S, editors. The Timetree of Life. New York: Oxford Univ Press; 2009. pp. 35–86. [Google Scholar]
- 19.Parham JF, et al. Best practices for justifying fossil calibrations. Syst Biol. 2012;61(2):346–359. doi: 10.1093/sysbio/syr107. [DOI] [PMC free article] [PubMed] [Google Scholar]
- 20.Roger AJ, Hug LA. The origin and diversification of eukaryotes: Problems with molecular phylogenetics and molecular clock estimation. Philos Trans R Soc Lond B Biol Sci. 2006;361(1470):1039–1054. doi: 10.1098/rstb.2006.1845. [DOI] [PMC free article] [PubMed] [Google Scholar]
- 21.Hug LA, Roger AJ. The impact of fossils and taxon sampling on ancient molecular dating analyses. Mol Biol Evol. 2007;24(8):1889–1897. doi: 10.1093/molbev/msm115. [DOI] [PubMed] [Google Scholar]
- 22.Near TJ, Sanderson MJ. Assessing the quality of molecular divergence time estimates by fossil calibrations and fossil-based model selection. Philos Trans R Soc Lond B Biol Sci. 2004;359(1450):1477–1483. doi: 10.1098/rstb.2004.1523. [DOI] [PMC free article] [PubMed] [Google Scholar]
- 23.Near TJ, Meylan PA, Shaffer HB. Assessing concordance of fossil calibration points in molecular clock studies: An example using turtles. Am Nat. 2005;165(2):137–146. doi: 10.1086/427734. [DOI] [PubMed] [Google Scholar]
- 24.Ho SYW, Phillips MJ. Accounting for calibration uncertainty in phylogenetic estimation of evolutionary divergence times. Syst Biol. 2009;58(3):367–380. doi: 10.1093/sysbio/syp035. [DOI] [PubMed] [Google Scholar]
- 25.Inoue J, Donoghue PCJ, Yang Z. The impact of the representation of fossil calibrations on Bayesian estimation of species divergence times. Syst Biol. 2010;59(1):74–89. doi: 10.1093/sysbio/syp078. [DOI] [PubMed] [Google Scholar]
- 26.Clarke JT, Warnock RCM, Donoghue PCJ. Establishing a time-scale for plant evolution. New Phytol. 2011;192(1):266–301. doi: 10.1111/j.1469-8137.2011.03794.x. [DOI] [PubMed] [Google Scholar]
- 27.Dornburg A, Beaulieu JM, Oliver JC, Near TJ. Integrating fossil preservation biases in the selection of calibrations for molecular divergence time estimation. Syst Biol. 2011;60(4):519–527. doi: 10.1093/sysbio/syr019. [DOI] [PubMed] [Google Scholar]
- 28.Edwards AWF. Likelihood. Cambridge, UK: Cambridge Univ Press; 1972. [Google Scholar]
- 29.Chang BH, Shimmin LC, Shyue SK, Hewett-Emmett D, Li WH. Weak male-driven molecular evolution in rodents. Proc Natl Acad Sci USA. 1994;91(2):827–831. doi: 10.1073/pnas.91.2.827. [DOI] [PMC free article] [PubMed] [Google Scholar]
- 30.Shimmin LC, Chang BH, Li WH. Contrasting rates of nucleotide substitution in the X-linked and Y-linked zinc finger genes. J Mol Evol. 1994;39(6):569–578. doi: 10.1007/BF00160402. [DOI] [PubMed] [Google Scholar]
- 31.Tucker PK, Adkins RM, Rest JS. Differential rates of evolution for the ZFY-related zinc finger genes, Zfy, Zfx, and Zfa in the mouse genus Mus. Mol Biol Evol. 2003;20(6):999–1005. doi: 10.1093/molbev/msg112. [DOI] [PubMed] [Google Scholar]
- 32.Bininda-Emonds ORP. Fast genes and slow clades: Comparative rates of molecular evolution in mammals. Evol Bioinform Online. 2007;3:59–85. [PMC free article] [PubMed] [Google Scholar]
- 33.Sanderson MJ. Estimating absolute rates of molecular evolution and divergence times: A penalized likelihood approach. Mol Biol Evol. 2002;19(1):101–109. doi: 10.1093/oxfordjournals.molbev.a003974. [DOI] [PubMed] [Google Scholar]
- 34.Kumar S, Hedges SB. A molecular timescale for vertebrate evolution. Nature. 1998;392(6679):917–920. doi: 10.1038/31927. [DOI] [PubMed] [Google Scholar]
- 35.Friedman R, Hughes AL. The temporal distribution of gene duplication events in a set of highly conserved human gene families. Mol Biol Evol. 2003;20(1):154–161. doi: 10.1093/molbev/msg017. [DOI] [PubMed] [Google Scholar]
- 36.Hahn MW, De Bie T, Stajich JE, Nguyen C, Cristianini N. Estimating the tempo and mode of gene family evolution from comparative genomic data. Genome Res. 2005;15(8):1153–1160. doi: 10.1101/gr.3567505. [DOI] [PMC free article] [PubMed] [Google Scholar]
- 37.Conant GC, Wolfe KH. Turning a hobby into a job: How duplicated genes find new functions. Nat Rev Genet. 2008;9(12):938–950. doi: 10.1038/nrg2482. [DOI] [PubMed] [Google Scholar]
- 38.Rosenberg MS, Kumar S. Heterogeneity of nucleotide frequencies among evolutionary lineages and phylogenetic inference. Mol Biol Evol. 2003;20(4):610–621. doi: 10.1093/molbev/msg067. [DOI] [PubMed] [Google Scholar]
- 39.Kishino H, Thorne JL, Bruno WJ. Performance of a divergence time estimation method under a probabilistic model of rate evolution. Mol Biol Evol. 2001;18(3):352–361. doi: 10.1093/oxfordjournals.molbev.a003811. [DOI] [PubMed] [Google Scholar]
- 40.Rambaut A, Grassly NC. Seq-Gen: An application for the Monte Carlo simulation of DNA sequence evolution along phylogenetic trees. Comput Appl Biosci. 1997;13(3):235–238. doi: 10.1093/bioinformatics/13.3.235. [DOI] [PubMed] [Google Scholar]
- 41.Hasegawa M, Kishino H, Yano TA. Dating of the human-ape splitting by a molecular clock of mitochondrial DNA. J Mol Evol. 1985;22(2):160–174. doi: 10.1007/BF02101694. [DOI] [PubMed] [Google Scholar]
- 42.Hedges SB, Kumar S. The Timetree of Life. New York: Oxford Univ Press; 2009. Discovering the timetree of life. pp 3–18. [Google Scholar]
- 43.Tamura K, et al. MEGA5: Molecular evolutionary genetics analysis using maximum likelihood, evolutionary distance, and maximum parsimony methods. Mol Biol Evol. 2011;28(10):2731–2739. doi: 10.1093/molbev/msr121. [DOI] [PMC free article] [PubMed] [Google Scholar]
Associated Data
This section collects any data citations, data availability statements, or supplementary materials included in this article.


