

Abstract
Toughening in hierarchically structured materials like bone arises from the arrangement of constituent material elements and their interactions. Unlike microcracking, which entails micrometer-level separation, there is no known evidence of fracture at the level of bone’s nanostructure. Here, we show that the initiation of fracture occurs in bone at the nanometer scale by dilatational bands. Through fatigue and indentation tests and laser confocal, scanning electron, and atomic force microscopies on human and bovine bone specimens, we established that dilatational bands of the order of 100 nm form as ellipsoidal voids in between fused mineral aggregates and two adjacent proteins, osteocalcin (OC) and osteopontin (OPN). Laser microdissection and ELISA of bone microdamage support our claim that OC and OPN colocalize with dilatational bands. Fracture tests on bones from OC and/or OPN knockout mice (OC−/−, OPN−/−, OC-OPN−/−;−/−) confirm that these two proteins regulate dilatational band formation and bone matrix toughness. On the basis of these observations, we propose molecular deformation and fracture mechanics models, illustrating the role of OC and OPN in dilatational band formation, and predict that the nanometer scale of tissue organization, associated with dilatational bands, affects fracture at higher scales and determines fracture toughness of bone.
Keywords: noncollagenous proteins, diffuse damage, energy dissipation
In hierarchically structured materials, the composition and spatial arrangement of nanoscale elements are the key determinants of toughness (1, 2). In comparison with many man-made materials, cortical bone is well known for its superior toughness (3, 4). Bone’s ability to resist crack propagation originates from its highly complex hierarchical material structure (Fig. 1). At the highest level of material structure in adult human bone lie the osteons (0.1–0.2 mm in diameter) that contribute to toughness by trapping microcracks (5, 6) and participate in the formation of “uncracked ligaments” (7). Osteons are made of multiple 3- to 7-μm–thick sheets (lamellae) of mineralized matrix. Individual lamellae have the ability to slide past each other (8, 9), forming 60- to 130-μm–long linear microcracks (9) that provide resistance to fracture through microcrack toughening (10). Individual mineralized collagen fibrils <1μm thick, which make up the lamellae, bridge the crack surfaces and toughen the bone (7). Bone’s ability to crack, and not fracture by propagating that crack, is therefore a key fundamental aspect of the toughening mechanisms at the microstructural level (10).
Fig. 1.

Bone hierarchy and dilatational bands. Hierarchical model of bone toughness shows that dilatational bands and diffuse damage link to higher-level toughening mechanisms in bone. Loss or modification at the nanoscale translates through the different scales shown here and alters bone toughness.
Recent evidence suggests that bone’s nanostructure contributes to bone toughness (11). The nonfibrillar and ductile extrafibrillar matrix components in bone can serve as a “glue” between stiffened mineralized collagen fibrils (11) and between fibrils and mineral platelets (12). Fibril matrix shearing (13) has been proposed to enhance bone toughness through mineral interparticle friction (14) and “sacrificial bonds,” a nanoscale mechanism that facilitates energy dissipation (11, 15). Stick/slip-type matrix flow (13) and the presence of a “crack-like flaw” within mineral crystals of bone (16) have also been invoked to explain the remarkable strength of bone. Although fracture/damage phenomena at the fibrillar level have been shown (17), the initiation of these processes remains unclear.
We explored the involvement of the noncollagenous proteins osteocalcin (OC) and osteopontin (OPN) in bone fracture. OC and OPN are directly associated with mineral or mineral–collagen complexes (18, 19). Osteocalcin has been shown to bind strongly to the bone mineral hydroxyapatite (20) and it complexes with and links to collagen through osteopontin (18). Osteocalcin’s ability to link the mineral and organic components of bone renders it a strong candidate for serving a mechanical function in bone. Osteopontin also associates strongly with bone mineral and participates in the rupture and reformation of “Ca2+-OPN sacrificial bonds” (15). OPN plays the role of “bone glue” and imparts in bone an ability to resist crack growth (21) and repair its matrix damage through sacrificial bonding (15, 21) or remodeling (22, 23).
To investigate in detail, we conducted controlled crack propagation and fatigue tests on a human bone specimen. We subsequently used various imaging modalities like laser confocal, scanning electron, and atomic force microscopy to investigate the regions of microdamage. Here, we present unique evidence, showing that bone fracture involves the formation of “dilatational bands.” Dilatational bands are distinct ellipsoidal voids ∼100 nm in size that form due to the deformation of noncollagenous protein complexes embedded within bone’s rigid mineralized matrix. We show that these bands colocalize with OC and OPN and form in between fused mineral aggregates. To directly confirm the role of OC and OPN in regulation of microdamage and bone toughness, we used genetic knockout mice models. Fracture tests and microdamage analyses on bones from osteocalcin, osteopontin, and osteocalcin–osteopontin knockout mice (OC−/−, OPN−/−, and OC-OPN−/−;−/−) established the direct involvement of OC and OPN in dilatational band formation. Furthermore, indentation studies on fatigued bovine bone showed that the association of dilatational bands with bone microdamage results in greater energy dissipation. On the basis of these observations, we propose molecular deformation and fracture mechanics models, illustrating the role of OC and OPN in microcracking, and predict that the nanometer scale of tissue organization associated with dilatational bands affects damage at higher scales, like diffuse damage, and determines fracture toughness of bone.
Results
Evidence of Dilatational Band Formation in Bone.
Controlled crack propagation and fatigued human bone specimens (protocols described in Materials and Methods) were imaged using various modalities to identify regions of bone microdamage. Fig. 2A shows that the fracture zone in bone comprises microcracks, uncracked ligaments, and collagen fibrils that span the cracks. In addition to linear microcracks, laser confocal microscopic images (Fig. 2 B and C) of bone fracture in controlled crack propagation studies show the presence of diffuse damage on the crack path and within the uncracked ligament. Diffuse damage (DD), as we and others have previously reported (9, 24–27), forms under tensile loading and is characterized by several submicroscopic cracks. Unlike linear microcracks (LM), examination of diffuse damage patches under high-resolution laser confocal, atomic force, and scanning electron microscopy shows the formation of dilatational bands (Fig. 3).
Fig. 2.

Bone toughening mechanisms observed in damaged bone specimen. (A) The toughening mechanisms in bone: collagen fibril bridging, uncracked ligament, and microcracks in the fracture zone. (B) Under confocal laser microscopy (Zeiss; basic fuchsin, excitation = 543 nm, emission = 560 nm) extensive amounts of diffuse damage (DD) and linear microcracks (LM) were observed within uncracked ligaments and in the vicinity of the main fracture crack in a compact-tension specimen. (C) Diffuse damage area at high magnification showing submicroscopic cracks.
Fig. 3.

Formation of dilatational bands in damaged bone studied via atomic force and confocal microscopy. The images show the progression of dilatational band formation in bone. (A and B) The presence of bands in diffuse damage regions of fatigued longitudinal bone. (Scale bar, 10 μm.) Dilatational bands form in a direction normal to the loading direction (thick dark arrows). (C) A single dilatational band imaged by atomic force microscopy that corresponds to each of the circled entities in B. Encircled in red dotted lines are the fused mineral aggregates, each over 100 nm in size. Mineral aggregates connected by the osteocalcin and osteopontin complex (additional details in Fig. 6) separate (in the direction of arrows shown in D) to form dilatational bands (encircled). Growth of dilatational bands subsequently leads to the rupture and separation of mineralized fibrils (D) and formation of diffuse damage regions (E). (F) Three-dimensional rendering of AFM dilatational bands’ topography. Bands can be seen as depressions in the surface (marked by arrows in E and F).
Dilatational bands vary in density and are distinct from the submicroscopic cracks within the diffuse damage areas. In particular, they are ellipsoidal voids that are oriented normal to the loading direction, along the diagonal in Fig. 3 A and B. Fig. 3 C–E shows the atomic force microscopy (AFM) topographical images of a region with dilatational bands of the order of 100 nm. The AFM investigation of the damage site confirmed that, in agreement with their confocal laser scanning microscopy (CLSM) analysis, the dilatational bands originated within the fused mineral aggregates (Fig. 3 C and D) that are known to exist in the region between mineralized collagen fibrils (28, 29). The mineral aggregates extend into the extrafibrillar space surrounding mineralized collagen fibers and link to each other and collagen through protein complexes (30). Tensile loading of this assembly leads to strain inhomogeneity (31) and results in inelastic deformation and dilatational band formation (Fig. 3D).
The formation of dilatational bands (Fig. 3C) occurs before any collagen fibril deformation or separation of mineralized fibril (Fig. 3D) and it represents a nanoscale fracture phenomenon in bone that has not been identified before. These bands grow in size and number (Fig. 3E) and cause matrix failure at the next level of bone hierarchy, in the form of diffuse damage, and through rupture and separation of mineralized collagen (Fig. 3D) reported previously (13). Consistent with our results, previous studies also show that fused mineralized aggregates are indeed of the same order (∼100 nm) (32, 33) as the size of dilatational bands reported here (Fig. 3 C–E). A 3D rendering of dilatational bands has also been shown (Fig. 3F).
Association of Osteocalcin and Osteopontin with Dilatational Bands.
After identifying that the dilatational bands form among the fused mineral aggregates located in the extrafibrillar space, we sought to investigate whether OC and OPN are associated with the formation of these bands. Thus, we looked at the spatial distribution and levels of OC and OPN. We stained for OC and OPN, using immunohistochemical protocols (described in Materials and Methods). In all of the sections examined, we found that the dilatational bands colocalized with OC and OPN (Fig. 4A).
Fig. 4.

Immunohistochemical staining of fatigued specimen and ELISA for osteocalcin and osteopontin quantification. (A) Associations of dilatational bands (Upper) and diffuse damage (Lower) with osteocalcin, osteopontin, and phosphoproteins. As seen in the micrographs, osteocalcin, osteopontin, and phosphorylated proteins colocalize with the bands (highlighted red by basic fuchsin, which stains for damage), indicating their possible role in band formation. (B) Mouse bones lacking OC (OC−/−), OPN (OPN−/−), and OC-OPN (OC-OPN−/−;−/−) showed a significantly lower level of fracture toughness than their WT controls but were not different from each other. (C) Mouse bones lacking OC (OC−/−), OPN (OPN−/−), and OC-OPN (OC-OPN−/−;−/−) showed a dramatic reduction in diffuse damage compared with their WT controls but were not different from each other. *P < 0.05; ***P < 0.001.
To quantify the levels of OC and OPN in the diffuse damage areas containing dilatational bands, we used ELISA. ELISA allows rapid screening and quantification of samples for the presence of antigen (here, OPN and OC), using specific antibodies. We found that at the nanoscale level there was ∼25 times more OC (P < 0.05) in the damaged regions containing dilatational bands (8.05 ± 1.71 nmol OC/g bone) than in the adjacent nondamaged control (0.31 ± 0.21 nmol OC/g bone). OPN content in the damaged area (0.63 ± 0.14 nmol OPN/g bone) was also greater (P < 0.05) than in its nondamaged control (0.46 ± 0.10 nmol OPN/g bone). Thus, protein analysis confirmed that diffuse damage regions containing dilatational bands had greater amounts of osteocalcin and osteopontin than spatially matched controls.
Fracture Toughness Testing and Microdamage Analysis of Bones Obtained from OC−/−, OPN−/−, OC-OPN−/−;−/−, and WT mice.
To directly confirm the role of osteocalcin and osteopontin in bone toughness and dilatational band formation, we mechanically tested (34) bones of four genotypes: wild type (WT), osteocalcin knockout (OC−/−), osteopontin knockout (OPN−/−), and double knockout (OC-OPN−/−;−/−). We found that bones from OC−/−, OPN−/−, and OC-OPN−/−;−/− mice had a lower propagation toughness than the WT controls, indicating an increased propensity of bone to fracture in the absence of OC and/or OPN (Fig. 4B). Analysis of microdamage in all of the genotypes showed a dramatic reduction in diffuse damage formation in the OC−/−, OPN−/−, and OC-OPN−/−;−/− mice compared with WT controls (Fig. 4C). All knockout genotypes were devoid of any dilatational bands. Additionally, there were no significant differences in the fracture toughness values between the OC−/−, OPN−/−, and OC-OPN−/−;−/− groups. A similar result was seen for diffuse damage formation. These findings suggest that, akin to links in a chain, the absence of OC, OPN, or both OC and OPN from the bone matrix disrupts dilatational band formation and results in similar magnitudes of reduction in bone toughness and diffuse damage.
Effects of Bone Microdamage on Matrix Softening.
With continued loading, large-scale localized yielding in the form of submicroscopic cracks (seen as white bands in the micrographs in Fig. 3 A and B) occurs in close association with dilatational bands. Various known contributors to bone toughness are therefore colocalized with diffuse damage patches containing nanoscale damage.
We then asked, Is the preferential colocalization of dilatational bands with diffuse damage and not linear microcracks a pure coincidence? Or does nanoscale fracture, in the form of dilatational bands, trigger a plethora of toughening mechanisms at higher scales like diffuse damage? It is noteworthy that in bone with a high level of toughness, diffuse damage, containing dilatational bands, has been shown to be more prevalent compared with linear microcracks—damage occurring at a higher scale in bone’s hierarchy (9, 10).
To address the above issues, we histologically identified microdamage in the midspan region of fatigued bovine bone. Mechanical assessment of damage was then done by microindentation-based measurements of the local tissue hardness. Target areas of interest included (i) a diffuse damage region, (ii) a 50- to 100-µm zone surrounding diffuse damage, (iii) a 0- to 50-µm zone surrounding linear microcracks, and (iv) a 50- to 100-µm zone surrounding linear microcracks. The hardness data from the control as well as from each region of damage were examined using an ANOVA test and post hoc Student–Newman–Keuls analysis (SigmaStat 2.0).
Compared with controls, diffuse damage and 0- to 50-µm zones surrounding linear microcracks showed a significant drop in hardness (P < 0.05; Fig. 5A). The percentage of hardness loss was, however, distinct. The diffuse damage region lost 13%, whereas the 0- to 50-µm zone surrounding linear microcracks lost 7% of its initial hardness (Fig. 5B). There were no significant differences between the 50- to 100-μm zones and the corresponding control values for both LM and DD (Fig. 5 A and B).
Fig. 5.

Hardness and toughness reduction in diffuse damage and linear microcrack regions. (A and B) Compared with the controls, the diffuse damage region displayed a 13% drop in hardness (A), whereas the 0- to 50-µm zone surrounding linear microcracks (B) lost only 7%. *P < 0.05.
Effects of Microdamage on Matrix Toughening Mechanisms and Fracture Toughness of Bone.
The effects of damage-induced hardness loss on fracture toughness of bone and higher-scale toughening mechanisms including uncracked ligaments and crack ligament bridging were investigated via cohesive finite-element and analytical modeling, respectively. Cohesive finite-element models represent the physical processes including damage in the vicinity of a propagating crack by a simplified traction-displacement relationship and consequently isolate the fracture process from the surrounding continuum constitutive model (35–37). A number of simulations (more details in SI Materials and Methods) incorporating diffuse damage only, linear microcracks only, and diffuse damage plus linear microcracks were performed to compare the effects of a single linear or diffuse patch on fracture initiation and propagation in bone. No attempt was made to incorporate the effects of damage distribution or interaction between damage morphologies. Inclusion of these effects is likely to magnify the effects of damage presented below.
Inclusion of all microdamage effects (linear microcracks and diffuse damage) in simulations predicted the initiation fracture toughness of bone to be KLM+DD = 2.57 MPam1/2. When the cohesive parameters were reduced according to 7% and 13% hardness loss for LM and DD, initiation toughness reduced to KLM = 2.43 MPam1/2 and KDD = 2.32 MPam1/2, respectively. Furthermore, DD formation resulted in a greater total uncracked ligament length (580 µm) than LM (540 µm) and the crack resistance curve slope, defining propagation toughness, was an order of magnitude higher for DD (10.5 MPa) compared with LM (0.9 MPa). Thus, if the cohesive model parameters are changed to incorporate material softening due to damage morphologies, there is a greater resistance to fracture as well as a greater magnitude of uncracked ligament length associated with dilatational bands containing diffuse damage than linear microcracks.
Another form of toughening mechanism in bone occurring at a lower scale than uncracked ligament is crack bridging via collagen fibrils (7). The contribution of crack bridging to fracture toughness of bone occurring through diffuse damage and linear microcracks was investigated using an analytical model with constant crack bridging stresses distributed over the crack surfaces. Microindentation data presented in the current study and the crack-length data for linear microcracks and diffuse damage from a previous study (9) for young (38 ± 9 y) and old (82 ± 5 y) human donors were used in conjunction with the analytical model to evaluate the crack-bridging–based bone toughening (details in SI Materials and Methods) in different damage morphologies. Crack-bridging–based bone toughening in diffuse damage was predicted to be 2.61 and 1.27 times more effective than linear microcracks in younger and older donors, respectively. Thus, similar to findings at the higher hierarchical scale presented above, these results indicate that diffuse damage provides a larger contribution to crack-bridging–based bone toughness than linear microcracks.
The model also predicted the role of crack orientation (longitudinal or transverse) in determining the resistance to crack growth. Dilatational bands in bone contribute to toughening in both the transverse and the longitudinal directions. Crack propagation in the transverse direction needs over five times the driving force or energy than that in the longitudinal direction (38). Thus, transverse cracking due to dilatational band formation and coalescence indicates greater energy dissipation during the fracture process. Enhanced toughening due to transverse cracking in diffuse damage regions containing dilatational bands has been predicted by our cohesive modeling. Their growth in the longitudinal direction, as a result of protein deformation, also causes energy dissipation. The energy dissipated due to these protein-based interactions is explained via a dilatational band model (Fig. 6) presented in Discussion.
Fig. 6.

Dilatational band formation in bone. Schematic shows dilatational band formation and subsequent collagen fibril rupture and slippage. The first stage (Left) illustrates two sites of dilatational band formation. Each site comprises two osteocalcin molecules (red) and an osteopontin molecule (green). The OC and OPN molecules are sandwiched between two fused mineral aggregates (i.e., aggregates composed of several individual mineral crystals). OC directly interacts with mineral (at point of contact with mineral aggregate). Possible long-range OPN interactions with mineral via Ca2+ ions are shown in the schematic as dashed white lines. The mineral aggregate is also surrounded by additional OC molecules (shown in red above the mineral aggregate) that may not partake in dilatational band formation and play only the role of crystal growth regulator. The formation of dilatational bands occurs before deformation of collagen. The application of a load (Center) causes the OC-OPN-OC protein complex to unfold. Dilatational bands (highlighted in yellow) form and extend until the maximum extension of 135 nm is reached. Continuous loading causes the OC and OPN to separate (Right). The separation of OC and OPN dictates the subsequent rupture and shear of collagen fibrils. The shear is shown by the difference in longitudinal displacement of the fibrils.
Discussion
Structural organization of constituent elements is critical to material strength and fracture resistance. Natural composite materials like bone exploit structural hierarchy and exhibit superior mechanical properties compared with many man-made materials (2). Our studies indicate that hierarchy is critical to bone’s toughness where toughening mechanisms at the lower scales of tissue organization facilitate toughening at higher scales and provide bone with the ability to resist fracture (Fig. 1). At the nanoscale, diffuse damage formation ensues from dilatational bands. On the basis of the results presented in this study, we hypothesize that dilatational bands result from the tensile loading of noncollageneous matrix proteins, in particular, osteocalcin and osteopontin, both of which are known to bind adjacent mineral aggregates through calcium ion-mediated complexes (18). In the absence of continuous tensile loading, the deformed protein complexes may “close” or completely recover the deformation to the initial unloaded state in a time-dependent manner (anelastic behavior). However, under continued loading, inelastic deformation of the protein complexes results in the formation of dilatational bands (Fig. 3C). Subsequent loading of the dilatational bands will cause shearing and rupture of mineralized collagen fibrils and formation of diffuse damage (Fig. 3E). The diffuse damage regions will then affect the formation of linear microcracks at the 3- to 7-μm level (Fig. 1), by controlling the sliding of the lamella past each other.
The above analysis requires that dilatational bands play a critical role in bone toughness through the osteocalcin–osteopontin complex. Whereas the contribution of osteopontin to bone toughness has been elegantly demonstrated by Hansma and coworkers (39), our proposal uniquely places osteocalcin as a critical component of bone toughness hierarchy. It is noteworthy that, in contrast to OPN alone, OC may enhance bone toughness because it is significantly smaller in size (∼50 amino acids) than osteopontin (∼300 amino acids) and is 13 times as abundant as osteopontin in diffuse damage regions where it contributes superiorly to bone toughness through the OC-OPN-OC complex (details in SI Discussion). The role of the OC-OPN complex in regulating bone toughness was confirmed by fracture toughness tests on bones obtained from OC−/−, OPN−/−, and OC-OPN−/−;−/− mice. In particular, we show that OC and OPN operate in tandem and act akin to links in a chain. Consequently, the deletion of either one or both of these links from bone matrix leads to the disruption of the chain and causes a similar magnitude of toughness loss in the knockouts compared with their WT controls.
To demonstrate the contributions of dilatational bands to bone toughness, we propose a simple model (Fig. 6) where two OC molecules are connected to each end of OPN through transglutaminase analogous motifs (40) at the N terminus of OC or through α-helix–based interactions. Unfolding of OC and OPN secondary structures in the OC-OPN-OC complex could result in total extension of the dilatational band to a length of 135 nm (assuming each amino acid is 0.35 nm long) (39). Continued extension and eventual separation of the OC-OPN complex dictates the higher-order damage mechanisms involving collagen fibril rupture and shear (13) (Fig. 6) and leads to the formation of diffuse damage. Consistent with this model, fracture testing of OC−/−, OPN−/−, and OC-OPN−/−;−/− mice bones show that the absence of OC, OPN, or both OC and OPN disrupts dilatational band formation and leads to dramatic and similar magnitudes of reduction in diffuse damage formation and toughness. The absence of dilatational bands in the tested genetic knockout mice bones supports our hypothesis that OC and OPN are integral to dilatational bands and to subsequent diffuse damage formation.
Osteocalcin has been shown to have an average of three hydroxyapatite attachment sites (carboxylated Gla residues on OC) with an average binding affinity of K ∼ 10−7 (41). Osteopontin exhibits an average of 20 Ca+2-OPN interactions with an average binding affinity of K ∼ 1.1 × 10⁻³ (42). We believe that these interactions result from sacrificial bonding involving mineral and collagen. The strength of the interaction between osteocalcin and osteopontin is of the order of 10−8 (18). Assuming that all Ca2+–protein interactions are broken during the formation of a single dilatational band, we estimate a dissipation of over 5 eV per band. Furthermore, accounting for H-bond rupture during the unfolding of individual protein molecules at later stages of deformation leads to total energy dissipation of the order of 50 eV. These calculations, consistent with experimental data reported by Hansma et al. (43), emphasize the role of ionic interactions in the deformation and energy dissipation by OPN and OC. The relative contributions of OC and OPN to energy dissipation (details in SI Discussion) are valid if both OC and OPN form the intact and chain-like dilatational band complex. The absence of OC, OPN, or both OC and OPN will disrupt the chain and dramatically reduce energy dissipation by similar magnitudes as is experimentally observed in this study. It is noteworthy that osteocalcin has been preserved throughout the evolution of bone (44) and, to the best of our knowledge, this study provides unique evidence of its role in bestowing bone with fracture resistance.
In conclusion, we found that fracture in bone initiates as dilatational bands that form as a result of OC-OPN interaction, where the role of OC is to anchor OPN to mineral and participate in energy dissipation. Dilatational band formation via the OC-OPN complex is therefore crucial to energy dissipation, and in the absence of either protein, the complex is disrupted, resulting in a dramatic loss of toughness. The association of dilatational bands with damage at higher scales, including diffuse damage, explains their contribution to bone toughness. Thus, any changes in bone’s nanostructure (i.e., mineral, collagen, and noncollagen proteins), reported in osteoporosis and metabolic bone diseases (45–49), will dramatically reduce bone toughness by altering toughening at from nano- to macro scales.
Materials and Methods
Controlled Crack Propagation Tests.
Compact specimens (width = 14 mm, thickness = 3 mm, initial crack length = 7mm) were prepared from human tibial middiaphysis and subjected to fracture mechanics tests [American Society for Testing and Materials (ASTM) E399]. A crack propagation gauge (Micromeasurement Ltd.; TK-09-CPB02) was mounted on each compact specimen, and the specimen was loaded under constant irrigation of saline at 37 °C on an MTS servo-hydraulic testing machine at 0.05 mm/min. A total crack extension of 2.25 mm was achieved. Following testing each specimen was bulk stained in basic fuchsin (48). Basic fuchsin fluoresces at 568 nm excitation, illuminating both the microcracks and the areas of diffuse staining containing submicroscopic cracks.
Fatigue Tests.
Rectangular parallelepiped beams (4 × 4 × 48 mm) were machined from the anterior and posterior quadrants of the tibial middiaphysis of human tibiae and subjected to fatigue loading in a four-point bending configuration. This enabled us to get distinct regions with both diffuse damage and linear microcracks (9). The tests were conducted on a servo-hydraulic machine (MTS Bionix Model 858) and specimens were loaded in the same anatomical configuration to induce compression on the endocortical side and tension on the periosteal side (9). Each specimen was fatigue loaded under load control at 2 Hz up to its normalized load corresponding to 5,000 μstrain at the midspan. Tests were stopped when specimen deflection reached a preset point corresponding to a modulus loss of 50%.
Immunohistochemical Staining for OPN and OC.
Basic fuchsin-stained bone slices, containing microdamage due to fatigue loading described above, were hydrated in sterile PBS for 30 min and stained for OPN and OC. Primary antibodies for osteopontin (raised in rat) (MAB3055; Chemicon) and osteocalcin (raised in mouse) (MAB1419; R & D Systems) were added to the sections at concentrations of 2 μg/mL and 10 μg/mL, respectively. Following incubation, the samples were rinsed and secondary antibodies including a donkey anti-rat Alexa Fluor 488 (A21208; Invitrogen) and a goat anti-mouse Alexa Fluor 405 (A31553; Invitrogen) were added at concentrations of 10 μg/mL.
Laser Microdissection and Protein Isolation of Damaged Bone and Its Controls.
Five-micrometer transverse sections of the fatigued specimen were bonded to a membrane slide [Molecular Machines and Industries (MMI)], preimaged, and laser cut using the Olympus IX71 Inverted Microscope (Olympus America) equipped with MMI CellTools. Images of the sections were used to cut circular areas enclosing damaged bone and their spatial controls. The sample was automatically collected into an Eppendorf tube with an adhesive cap (MMI) and used immediately for protein isolation or stored at −80 °C until use. Extraction buffer (0.05 M EDTA, 4 M Guanidine chloride, 30 mM Tris⋅HCl, 1 mg/mL BSA, 10 μL/mL Halt Protease Inhibitor from “Pierce,” pH 7.4) was added to the tubes containing laser-microdissected samples. These were incubated overnight at 4 °C and transferred into an Eppendorf tube with a dialysis membrane (Spectra Por 3 Dialysis Membrane; Spectrum Laboratories) and closed. Microdialysis was conducted at 4 °C against PBS buffer, pH 7.4. After dialysis, the samples were centrifuged. Supernatants were used directly for OPN and OC ELISA analyses or freeze-dried and stored at −80 °C until use.
ELISAs.
Detection and quantitation of OC and OPN were performed using the hOST-ELISA and Human Osteopontin Assay kits (American Research Products), following manufacturer protocols.
Small Animal Bone Fracture Mechanics.
Femora from 6-mo-old OC−/−, OPN−/−, OC-OPN−/−;−/−, and WT mice (n = 8 in each case) were harvested and notched in the anterior middiaphyseal region, using a slow-speed diamond blade (Buehler). The anterior side was chosen to mimic natural loading conditions during three-point bending tests (34). Notched bones were soaked in saline for 1 h and tested in wet conditions. The bending tests were done on a custom-made fixture in the displacement feedback mode (Elf 3200; EnduraTEC) at a cross-head rate of 0.001 mm/s until fracture. The resulting load-displacement curves were used to calculate propagation toughness (34). Microdamage was measured from 100-μm basic fuchsin-stained bone cross-sections located adjacent to the fracture surface in all tested specimens (n = 8 in each case).
Microindentation Tests.
Microindentation tests were conducted on a bovine test specimen (fatigued as in fatigue protocol above) in a drip of saline at room temperature to mechanically assess the impact of diffuse damage and linear microcracks on local tissue hardness. To this end, a LecoDM-400FT Hardness tester (25-g load) was used to indent the areas of interest on epoxy-embedded, longitudinal sections with 0.25-μm surface finish and parallel faces. Hardness (GPa) of damaged areas (diffuse damage or linear microcracks), and of their controls, was obtained by multiplying the resulting Vickers hardness number (VHN) by 9.81 × 10⁻³ [VHN = (1,854.4 *P)/(d2), where P = 25 g and d = mean diagonal length].
Cohesive Modeling.
Crack-growth modeling (longitudinal orientation) of compact-tension (width = 14 mm; thickness = 3 mm) specimens was performed to determine the effects of linear microcracks and diffuse damage on R-curve behavior and uncracked ligament formation in human cortical bone, using the finite-element method incorporating a cohesive model previously used (35). A finite-element model of the compact tension (CT) specimens was created using a finite-element program, FEAP (v7.1, 1999), composed of quadrilateral elements. The cohesive interface elements are placed in the direction of the expected crack growth. The simulations were carried out under plane strain assumptions. The R-curve slope was calculated for crack extensions of 1 mm. The uncracked ligament length was calculated on the basis of distance between the crack tip and the crack initiation locations in the adjacent layers. Further details are included in SI Materials and Methods.
Analytical Modeling.
Effects of microdamage on crack bridging were assessed using an analytical model. The ratio of stress-intensity factors for diffuse damage and linear microcracks was calculated as
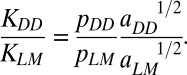 |
The ratio of bridging stresses (pDD/pMM) was evaluated using the data from microindentation tests on diffuse damage and linear microcracks  .The crack-length values for linear microcracks (aLM) and diffuse damage (aDD) were taken from the literature (9). Further details are in SI Materials and Methods.
Supplementary Material
Acknowledgments
The authors thank Dr. Colleen Janeiro (Rensselaer Polytechnic Institute) for assistance with immunohistochemical staining and laser confocal microscopy images and Ms. Sophia Hohlbauch (Asylum Research, Goleta, CA) for AFM image analysis. This study is supported by National Institutes of Health Grants AR 49635, AR 38460, and DE04141.
Footnotes
The authors declare no conflict of interest.
This article is a PNAS Direct Submission.
This article contains supporting information online at www.pnas.org/lookup/suppl/doi:10.1073/pnas.1201513109/-/DCSupplemental.
References
- 1.Calvert P. Nanotube composites: A recipe for strength. Nature. 1999;399:210–211. [Google Scholar]
- 2.Li X, Wei-Che C, Yuh JC, Wang R, Chang M. Nanoscale structural and mechanical characterization of a natural nanocomposite material: The shell of red abalone. Nano Lett. 2004;4:613–617. [Google Scholar]
- 3.Peterlik H, Roschger P, Klaushofer K, Fratzl P. From brittle to ductile fracture of bone. Nat Mater. 2006;5(1):52–55. doi: 10.1038/nmat1545. [DOI] [PubMed] [Google Scholar]
- 4.Rho JY, Kuhn-Spearing L, Zioupos P. Mechanical properties and the hierarchical structure of bone. Med Eng Phys. 1998;20(2):92–102. doi: 10.1016/s1350-4533(98)00007-1. [DOI] [PubMed] [Google Scholar]
- 5.Burr DB, Schaffler MB, Frederickson RG. Composition of the cement line and its possible mechanical role as a local interface in human compact bone. J Biomech. 1988;21(11):939–945. doi: 10.1016/0021-9290(88)90132-7. [DOI] [PubMed] [Google Scholar]
- 6.O’Brien FJ, Taylor D, Clive Lee T. The effect of bone microstructure on the initiation and growth of microcracks. J Orthop Res. 2005;23(2):475–480. doi: 10.1016/j.orthres.2004.08.005. [DOI] [PubMed] [Google Scholar]
- 7.Nalla RK, Kinney JH, Ritchie RO. Mechanistic fracture criteria for the failure of human cortical bone. Nat Mater. 2003;2(3):164–168. doi: 10.1038/nmat832. [DOI] [PubMed] [Google Scholar]
- 8.Jepsen KJ, Davy DT, Krzypow DJ. The role of the lamellar interface during torsional yielding of human cortical bone. J Biomech. 1999;32(3):303–310. doi: 10.1016/s0021-9290(98)00179-1. [DOI] [PubMed] [Google Scholar]
- 9.Diab T, Condon KW, Burr DB, Vashishth D. Age-related change in the damage morphology of human cortical bone and its role in bone fragility. Bone. 2006;38(3):427–431. doi: 10.1016/j.bone.2005.09.002. [DOI] [PubMed] [Google Scholar]
- 10.Vashishth D, Tanner KE, Bonfield W. Contribution, development and morphology of microcracking in cortical bone during crack propagation. J Biomech. 2000;33(9):1169–1174. doi: 10.1016/s0021-9290(00)00010-5. [DOI] [PubMed] [Google Scholar]
- 11.Fantner GE, et al. Sacrificial bonds and hidden length dissipate energy as mineralized fibrils separate during bone fracture. Nat Mater. 2005;4(8):612–616. doi: 10.1038/nmat1428. [DOI] [PubMed] [Google Scholar]
- 12.Kindt J, Fantner G, Thurner P, Schitter G, Hansma P. 2005. A new technique for imaging mineralized fibrils on bovine trabecular bone fracture surfaces by atomic force microscopy. Mater Res Soc Symp Proc 874:L5.12.1–12.7.
- 13.Gupta HS, et al. Nanoscale deformation mechanisms in bone. Nano Lett. 2005;5(10):2108–2111. doi: 10.1021/nl051584b. [DOI] [PubMed] [Google Scholar]
- 14.Tai K, Ulm FJ, Ortiz C. Nanogranular origins of the strength of bone. Nano Lett. 2006;6(11):2520–2525. doi: 10.1021/nl061877k. [DOI] [PubMed] [Google Scholar]
- 15.Hansma PK, et al. Sacrificial bonds in the interfibrillar matrix of bone. J Musculoskelet Neuronal Interact. 2005;5(4):313–315. [PubMed] [Google Scholar]
- 16.Gao H, Ji B, Jager IL, Arzt E, Fratzl P. Materials become insensitive to flaws at nanoscale: Lessons from nature. Proc Natl Acad Sci USA. 2003;100(10):5597–5600. doi: 10.1073/pnas.0631609100. [DOI] [PMC free article] [PubMed] [Google Scholar]
- 17.Hassenkam T, et al. High-resolution AFM imaging of intact and fractured trabecular bone. Bone. 2004;35(1):4–10. doi: 10.1016/j.bone.2004.02.024. [DOI] [PubMed] [Google Scholar]
- 18.Ritter NM, Farach-Carson MC, Butler WT. Evidence for the formation of a complex between osteopontin and osteocalcin. J Bone Miner Res. 1992;7(8):877–885. doi: 10.1002/jbmr.5650070804. [DOI] [PubMed] [Google Scholar]
- 19.Hoang QQ, Sicheri F, Howard AJ, Yang DS. Bone recognition mechanism of porcine osteocalcin from crystal structure. Nature. 2003;425(6961):977–980. doi: 10.1038/nature02079. [DOI] [PubMed] [Google Scholar]
- 20.Hauschka PV, Carr SA. Calcium-dependent α-helical structure in osteocalcin. Biochemistry. 1982;21:2538–2547. doi: 10.1021/bi00539a038. [DOI] [PubMed] [Google Scholar]
- 21.Thurner PJ, et al. Osteopontin deficiency increases bone fragility but preserves bone mass. Bone. 2010;46(6):1564–1573. doi: 10.1016/j.bone.2010.02.014. [DOI] [PMC free article] [PubMed] [Google Scholar]
- 22.Duvall CL, Taylor WR, Weiss D, Wojtowicz AM, Guldberg RE. Impaired angiogenesis, early callus formation, and late stage remodeling in fracture healing of osteopontin-deficient mice. J Bone Miner Res. 2007;22(2):286–297. doi: 10.1359/jbmr.061103. [DOI] [PubMed] [Google Scholar]
- 23.Yoshitake H, Rittling SR, Denhardt DT, Noda M. Osteopontin-deficient mice are resistant to ovariectomy-induced bone resorption. Proc Natl Acad Sci USA. 1999;96(14):8156–8160. doi: 10.1073/pnas.96.14.8156. [DOI] [PMC free article] [PubMed] [Google Scholar]
- 24.Boyce TM, Fyhrie DP, Glotkowski MC, Radin EL, Schaffler MB. Damage type and strain mode associations in human compact bone bending fatigue. J Orthop Res. 1998;16(3):322–329. doi: 10.1002/jor.1100160308. [DOI] [PubMed] [Google Scholar]
- 25.Fazzalari NL, Forwood MR, Manthey BA, Smith K, Kolesik P. Three-dimensional confocal images of microdamage in cancellous bone. Bone. 1998;23(4):373–378. doi: 10.1016/s8756-3282(98)00111-2. [DOI] [PubMed] [Google Scholar]
- 26.Diab T, Vashishth D. Effects of damage morphology on cortical bone fragility. Bone. 2005;37(1):96–102. doi: 10.1016/j.bone.2005.03.014. [DOI] [PubMed] [Google Scholar]
- 27.Diab T, Vashishth D. Morphology, localization and accumulation of in vivo microdamage in human cortical bone. Bone. 2007;40(3):612–618. doi: 10.1016/j.bone.2006.09.027. [DOI] [PMC free article] [PubMed] [Google Scholar]
- 28.Weiner S, Price PA. Disaggregation of bone into crystals. Calcif Tissue Int. 1986;39(6):365–375. doi: 10.1007/BF02555173. [DOI] [PubMed] [Google Scholar]
- 29.Burger C, et al. Lateral packing of mineral crystals in bone collagen fibrils. Biophys J. 2008;95(4):1985–1992. doi: 10.1529/biophysj.107.128355. [DOI] [PMC free article] [PubMed] [Google Scholar]
- 30.Fratzl P, Gupta HS, Paschalis EP, Roschger P. Structure and mechanical quality of the collagen–mineral nano-composite in bone. J Mater Chem. 2004;14:2115–2123. [Google Scholar]
- 31.Krauss S, et al. Inhomogeneous fibril stretching in antler starts after macroscopic yielding: Indication for a nanoscale toughening mechanism. Bone. 2009;44(6):1105–1110. doi: 10.1016/j.bone.2009.02.009. [DOI] [PubMed] [Google Scholar]
- 32.Mackie IG, Green M, Clarke H, Isaac DH. Osteoporotic bone microstructure by collagenase etching. Ann Rheum Dis. 1989;48(6):464–469. doi: 10.1136/ard.48.6.464. [DOI] [PMC free article] [PubMed] [Google Scholar]
- 33.Rubin MA, et al. TEM analysis of the nanostructure of normal and osteoporotic human trabecular bone. Bone. 2003;33(3):270–282. doi: 10.1016/s8756-3282(03)00194-7. [DOI] [PubMed] [Google Scholar]
- 34.Ritchie RO, et al. Measurement of the toughness of bone: A tutorial with special reference to small animal studies. Bone. 2008;43(5):798–812. doi: 10.1016/j.bone.2008.04.027. [DOI] [PMC free article] [PubMed] [Google Scholar]
- 35.Ortiz M, Pandolfi A. Finite-deformation irreversible cohesive elements for three-dimensional crack propagation analysis. Int J Numer Methods Eng. 1999;44:1267–1282. [Google Scholar]
- 36.Ural A, Vashishth D. Cohesive finite element modeling of age-related toughness loss in human cortical bone. J Biomech. 2006;39(16):2974–2982. doi: 10.1016/j.jbiomech.2005.10.018. [DOI] [PubMed] [Google Scholar]
- 37.Yang QD, Cox BN, Nalla RK, Ritchie RO. Re-evaluating the toughness of human cortical bone. Bone. 2006;38(6):878–887. doi: 10.1016/j.bone.2005.10.014. [DOI] [PubMed] [Google Scholar]
- 38.Fratzl P. Bone fracture: When the cracks begin to show. Nat Mater. 2008;7(8):610–612. doi: 10.1038/nmat2240. [DOI] [PubMed] [Google Scholar]
- 39.Fantner GE, et al. Nanoscale ion mediated networks in bone: Osteopontin can repeatedly dissipate large amounts of energy. Nano Lett. 2007;7(8):2491–2498. doi: 10.1021/nl0712769. [DOI] [PubMed] [Google Scholar]
- 40.Kaartinen MT, Pirhonen A, Linnala-Kankkunen A, Mäenpää PH. Transglutaminase-catalyzed cross-linking of osteopontin is inhibited by osteocalcin. J Biol Chem. 1997;272(36):22736–22741. doi: 10.1074/jbc.272.36.22736. [DOI] [PubMed] [Google Scholar]
- 41.Atkinson RA, et al. Conformational studies of osteocalcin in solution. Eur J Biochem. 1995;232(2):515–521. doi: 10.1111/j.1432-1033.1995.tb20838.x. [DOI] [PubMed] [Google Scholar]
- 42.Chen Y, Bal BS, Gorski JP. Calcium and collagen binding properties of osteopontin, bone sialoprotein, and bone acidic glycoprotein-75 from bone. J Biol Chem. 1992;267(34):24871–24878. [PubMed] [Google Scholar]
- 43.Fantner GE, et al. Sacrificial bonds and hidden length: Unraveling molecular mesostructures in tough materials. Biophys J. 2006;90(4):1411–1418. doi: 10.1529/biophysj.105.069344. [DOI] [PMC free article] [PubMed] [Google Scholar]
- 44.Nielsen-Marsh CM, et al. Osteocalcin protein sequences of Neanderthals and modern primates. Proc Natl Acad Sci USA. 2005;102(12):4409–4413. doi: 10.1073/pnas.0500450102. [DOI] [PMC free article] [PubMed] [Google Scholar]
- 45.Tang SY, Zeenath U, Vashishth D. Effects of non-enzymatic glycation on cancellous bone fragility. Bone. 2007;40(4):1144–1151. doi: 10.1016/j.bone.2006.12.056. [DOI] [PMC free article] [PubMed] [Google Scholar]
- 46.Boivin G, et al. The role of mineralization and organic matrix in the microhardness of bone tissue from controls and osteoporotic patients. Bone. 2008;43(3):532–538. doi: 10.1016/j.bone.2008.05.024. [DOI] [PubMed] [Google Scholar]
- 47.Miller E, Delos D, Baldini T, Wright TM, Pleshko Camacho N. Abnormal mineral-matrix interactions are a significant contributor to fragility in oim/oim bone. Calcif Tissue Int. 2007;81(3):206–214. doi: 10.1007/s00223-007-9045-x. [DOI] [PMC free article] [PubMed] [Google Scholar]
- 48.Burr DB, Hooser M. Alterations to the en bloc basic fuchsin staining protocol for the demonstration of microdamage produced in vivo. Bone. 1995;17(4):431–433. doi: 10.1016/s8756-3282(95)00241-3. [DOI] [PubMed] [Google Scholar]
- 49.Vashishth D, et al. In vivo diffuse damage in human vertebral trabecular bone. Bone. 2000;26(2):147–152. doi: 10.1016/s8756-3282(99)00253-7. [DOI] [PubMed] [Google Scholar]
Associated Data
This section collects any data citations, data availability statements, or supplementary materials included in this article.