

Abstract
The objective of this preliminary study was to examine the spatial correlation between microbubble (MB)-induced vessel wall displacements and resultant microvascular bioeffects. MBs were injected into venules in ex vivo rat mesenteries and insonated by a single short ultrasound pulse with a center frequency of 1 MHz and peak negative pressures spanning the range of 1.5–5.6 MPa. MB and vessel dynamics were observed under ultra-high speed photomicrography. The tissue was examined by histology or transmission electron microscopy for vascular bioeffects. Image registration allowed for spatial correlation of MB-induced vessel wall motion to corresponding vascular bioeffects, if any. In cases in which damage was observed, the vessel wall had been pulled inward by more than 50% of the its initial radius. The observed damage was characterized by the separation of the endothelium from the vessel wall. Although the study is limited to a small number of observations, analytic statistical results suggest that vessel invagination comprises a principal mechanism for microvessel bioeffects in venules by microbubbles.
Keywords: Microbubble dynamics, High speed photomicrography, Ultrasound bioeffects, Ultrasound contrast agents, Ultrasound-induced vascular damage, Microvessels
INTRODUCTION
Ultrasound contrast agent microbubbles (MBs) were originally intended to enhance blood pool diagnostic imaging capabilities, but the potential to exploit acoustically-driven bubble dynamics for therapeutic purposes has generated much interest. Applications include the targeted delivery of therapeutic agents such as genetic materials, proteins and chemotherapeutic agents, for treating diseases including genetic disorders, cancer and cardiovascular diseases, wherein the MBs are used as delivery vehicles or ‘mechanical adjuvants’ for the agents (Liu et al. 2006; Phillips et al. 2011; Sorace et al. 2012). An often important goal of ultrasound-enhanced delivery of therapeutics is increasing the permeability of the endothelial barrier, which can be achieved by ultrasound-activated MBs (Skyba et al. 1998; Stieger et al. 2007).
Enhancement of vascular permeability is often discussed in the context of vascular damage. The goal of many studies is to determine an optimal parameter space that maximizes gene or drug delivery while minimizing ‘excessive’ or ‘substantial’ vascular injury. These studies typically explore MB parameters such as size or shell properties (see, e.g., (Bohmer et al. 2010; Choi et al. 2010) or ultrasound pulse parameters such as fundamental transmit frequency, pulse repetition frequency, duty cycle, pulse length, Mechanical Index, or the acoustic peak negative acoustic pressure (see, e.g., (Hwang et al. 2005; Miller et al. 2008). It is difficult to associate vascular or cellular damage to a specific mechanism in studies that use multiple pulses. However, in vitro studies indicate that bioeffects are correlated strongly with the inertial ‘cavitation dose’ that develops in a sample (Chen et al. 2003a; Chen et al. 2003b). Similarly, in vivo studies with rabbit auricular veins have demonstrated a correlation between ‘cavitation dose’ and the extent of damage to the blood vessel walls (Hwang et al. 2005; Hwang et al. 2006; Tu et al. 2006a; Tu et al. 2006b). Taken together, these results indicate that cumulative exposures increase the bioeffect severity. In contrast to these previous studies, the focus of this paper is to examine vascular bioeffects from a single short ultrasound pulse, and to attempt to correlate any observed damage with a specific MB-induced, vascular dynamics mechanism.
The mechanism broadly but provisionally accepted as most probable for MB-induced vascular damage is that MBs collapse violently and form liquid jets which are directed toward and impinge upon the vessel, creating defects (‘poking holes’) in the vessel wall. It is well known that inertial cavitation near a rigid boundary can result in the formation of liquid jets which are capable of pitting even hardened surfaces (Blake and Gibson 1987). However, blood vessels are not rigid; they are viscoelastic. Prentice et al. (Prentice et al. 2005) studied MB dynamics and corresponding cellular bioeffects using high speed photomicrography. Although the frame rate of the camera was too slow to observe MB growth and collapse in detail, they were able to register the location of the interaction and measure pores induced in nearby cells, suggesting that jetting caused the opening of the pores. Of note in this study is that they used a 20-μs long burst (at 1 MHz), and the cells were attached to a rigid surface. The pulse length may have induced repeated MB-cell interactions, while the rigid boundary artificially provided a condition that promoted MB jetting toward the cells. The few published studies we have found on the topic of single, short acoustic exposure bioeffects involve acoustic shock wave interactions with the surface of ex vivo tissue (Kodama and Takayama 1998) or a layer of cells attached to a rigid surface (Ohl et al. 2006). Shock waves, partly because of their rapid rise-time, often induce asymmetric MB collapse leading to jetting in the direction of wave propagation, even in the presence of a tissue surface (Kodama and Takayama 1998). In general, the formation and direction of a jet depends on the characteristics of acoustic waves, mechanical properties of the boundary, bubble size, and distance from the boundary (Brujan et al. 2001; Fong et al. 2006). Our previous study of MBs in microvessels of ex vivo rat mesenteries insonated by a single ultrasound pulse showed that near a mesenteric microvessel wall (a compliant viscoelastic boundary), liquid jets were always directed away from the nearest vessel wall rather than towards it, indicating that liquid jet impact may not be the dominant mechanism for microvessel disruption for single-shot, short pulse acoustic exposures (Chen et al. 2011a). It is possible that for small microvessels, the jet propagating away from one vessel wall can impact the opposite wall. Such behavior has been observed in smaller microvessels (Chen et al. 2010).
Other potential mechanisms for vascular damage include distension (pushing against the vessel or cell due to MB expansion) and invagination (pulling of the vessel or cell due to MB collapse). The distension mechanism has been reported in both in vitro (Zhong et al. 2001) and ex vivo (Chen et al. 2010; Van Leeuwen et al. 1993) studies. Invagination has been reported infrequently in tissue response studies involving ultrasound-activated MBs. Nonetheless, vessel invagination in response to bubble collapse has been hypothesized as a damage mechanism in laser-induced intra-luminal vapor bubble creation in dissected rabbit femoral arteries (Van Leeuwen et al. 1993). In addition, our previous observations show that the extent of invagination is often greater than distension in mesenteric microvessels (Chen et al. 2011a; Chen et al. 2011b). These observations are important because most of the available evidence from in vivo studies indicates that vessel permeabilization effects occur principally in the microcirculation (Miller et al. 2008).
The goal of this work was to extend the observations discussed above, to relate microscopically-discernable vascular bioeffects in ex vivo mesenteric microvessels with ultra-high speed photomicrographic observations of MB and vessel wall dynamics at a very high level of spatial correlation. Toward that goal, we focused our studies to venules, motivated by the following considerations. First, our previous experiments suggest that venules respond to a greater degree than arterioles to nearby MB oscillations (most probably due to the relative lack of supporting structure). Second, some studies suggest that MBs persist longer in venules than arterioles or capillaries as they can attach transiently to venular endothelial cells (Keller et al. 1989; Yasu et al. 1999); this suggests a greater potential for vascular bioeffects there. Indeed, Kobayashi, et al. (Kobayashi et al. 2002) showed that endothelial cell damage in rat mesenteries was dominant in venules, which was hypothesized to be caused by MB attachment to the endothelial cells of venules, leading to intense closely-coupled mechanical interactions between the MBs and the endothelial cells when insonated by ultrasound. (our own work also suggests that attached MBs enhance the mechanical interactions between MBs and endothelial cells (Chen et al. 2011a)). Finally, Stieger et al. showed that for a Mechanical Index (MI, a measure of the relative likelihood of inertial cavitation, given by the peak negative acoustic pressure divided by the square root of frequency) larger than 1.3, the mean and largest vessel size in which dye extravasation were observed were 21 and 55 μm, respectively (Stieger et al. 2007). Therefore, we selected venules with sizes from 16 – 46 μm in this study.
For this preliminary investigation, three specific hypotheses were tested in our ex vivo mesenteric model: (1) A single short ultrasound pulse can cause detectable vascular bioeffects in the presence of MBs; (2) the mechanical interactions between MBs and microvessels during ultrasound exposure are correlated with vessel bioeffects; and (3) vessel invagination induced by the collapse of MBs plays an important role in generating vascular bioeffects. These hypotheses were tested by spatial and temporal correlation of microbubble and microvessel interactions observed under high speed optical imaging (photomicrography) with histological or transmission electron microscopy (TEM) evaluation of that same interaction zone. In general, all three hypotheses were supported by the data.
MATERIALS AND METHODS
Animal tissue preparation
The animal experiment protocol was approved by the Institutional Animal Care and Use Committee at the University of Washington. Optically transparent ex vivo rat mesenteries were used as the tissue model and prepared as described previously (Chen et al. 2010; Chen et al. 2011a; Chen et al. 2011b). The rat mesentery was selected as the animal model because it has good optical transparency, allowing easy observations of its microvasculature under light microscopy. Further, the mesentery contains many vascular networks that allow for multiple experiments on each excised tissue sample. Fifteen male F344 rats (Charles River Labs, Seattle, WA, USA) with a weight ~200 g were used. In brief, after each rat was anesthetized, its mesentery was exteriorized, cannulated and perfused with saline to flush blood out of the vessels. The mesentery with intestine was then excised. A segment of the mesentery with a rich vascular network was spread out and sandwiched between two D-shaped annular plates. Care was taken to mount the tissue such that it resembled its in situ dimensions. The hole in the plates provided a window for optical viewing and acoustical exposure. Next, lipid-coated perfluoropropane MBs (Definity®) in saline were injected using a syringe pump into the mesentery through a tube that cannulated a draining vein of the selected mesentery segment. Green India ink at a volume concentration less than 3% was added to the saline solution to increase the optical contrast of the microvessels to the surrounding tissue. The mesentery was used up to a maximum of three hours after it was excised
Experimental system
The experimental system consisted of a transducer for ultrasound exposure, a microscope, and an ultra-high speed camera for capturing the MB and vessel interactions. The prepared tissue sample was placed in a water bath filed with Krebs-Ringer buffer (Sigma-Aldrich Co. LLC. St. Louis, MO, USA) at room temperature on a customized inverted microscope (TE2000-U; Nikon Inc., Melville, NY, USA) equipped with a 40× water-immersion objective. The buffer was used to maintain the physiological condition of the tissue sample. An ultra-high speed camera (Imacon 200; DRS Hadland, Cupertino, CA, USA) was connected to one port of the microscope for ultra-high speed image acquisitions.
The ultrasound transducer (H102; Sonic Concepts, Bothell, WA, USA) was coupled to a water cone. It had a center frequency of 1 MHz, and its aperture and focal length were 64 mm and 63 mm, respectively. It was connected to an electrical matching network and driven by amplified function generator signals. Single-cycle 1-MHz sinusoidal signals with varying amplitudes were generated by the function generator. However, because of transducer ringing, the measured ultrasound pulse lasted ~2 μs. A fiber optic probe hydrophone (FOPH 2000; RP Acoustics, Leutenbach, Germany) was used to align the focus of the ultrasound transducer to the center of the microscope field of view, and also for measurement of the acoustic pressures. The full-width half-maximum (FWHM) lateral and axial beam widths were approximately 1.5 mm and 12 mm, respectively. For ease of alignment, the transducer was positioned directly opposite the microscope objective. The distance between the tissue and the objective lens top surface was approximately 3 mm. Although the objective caused reflected waves, the amplitude (approximately one-third of incident wave) and arrival time (delayed by ~4 μs relative to the incident wave) did not cause significant problems with data interpretation; as shown later, vessel deformations were induced mainly by the incident pulse. Additional experimental details are described elsewhere (Chen et al. 2011a; Chen et al. 2011b).
Ultra-high speed photomicrography
Intact microvessels (showing no signs of leakage of green India ink) with MBs flowing through were selected for ultrasound targeting (this study is limited to venules in the range of 16–46 μm, as discussed before). When a targeted microvessel was found, the function generator was triggered to emit a single cycle pulse. Meanwhile, a synchronized signal with an appropriate delay triggered the ultra-high speed camera and flash lamp, resulting in 14 ultra-high speed image frames. The first frame was captured when the ultrasound pulse first arrived at the tissue sample, denoted as time zero. The exposure and interframe time were set to 50 and 600 ns, respectively. Thus the 14 frames were captured within ~8 μs, which was long enough to cover both the incident and reflected pulses. Each selected microvessel was targeted only once for ultrasound exposure. Consequently, only one ultra-high speed image sequence was captured for each selected microvessel segment. The peak negative pressure (PNP) amplitudes used in this study ranged from 1.5–5.6 MPa. At 5.6 MPa, only a single targeted microvessel was selected on the entire mesentery tissue preparation to prevent overlap of treatments. At lower pressures, multiple targeted microvessels were selected on a single tissue sample; however the distances between any two of them were at least 1 mm to reduce the chance of overlapping exposures.
The images were calibrated using a standard stage micrometer (10 μm per smallest division). MB maximum equivalent radius Rmax, microvessel initial diameter D and microvessel deformation were quantified using a custom Matlab program (Mathworks Inc., Sherborn, MA, USA), as described elsewhere (Chen et al. 2011a). In each ultra-high speed image sequence, the MB maximum equivalent radius, Rmax, was measured at the maximum expansion state of the MB by assuming the MB was a prolate spheroid. The initial vessel diameter D was measured along a line passing through the pixel coordinates of the center of the MB when it first appeared. The vessel wall deformation was quantified by the radial displacements of the point on the vessel wall that had the largest extent of deformation, instead of measuring the displacements of the point closest to the MB center (Chen et al. 2011b), as multiple MBs may have been present in the recorded images. Vessel displacements toward the vessel lumen were defined to be negative. Post-processing of all the selected images was repeated three times (by the same observer on three different days) on image groups corresponding to single sets of observations; i.e., a single event sequence within one rat mesentery at one particular time and spatial location. Averages and standard deviations as presented thus represent measurement variability. The variability in vessel diameter, maximum distention and invagination measurements was less than 1 μm for most of the measured results; however, higher variability (between 1 and 2 μm) occurred in about 25% of them. Additional measurement uncertainties of about 1 μm were also present, owing to frame-to-frame alignment jitter of the camera’s optics. We estimated that uncertainties in the measurements ranged from 1–3 μm.
Microvessel bioeffects examinations
Once the ultra-high speed images were obtained, two criteria were used to select targeted venules for further microvascular bioeffects assessment: (1) the vessel walls were clearly identifiable in the ultra-high speed images, and (2) the vessel underwent unambiguous invagination in response to MB collapse. These criteria allowed for quantitative deformation measurements, but reduced the overall number of data available for analysis. After these targeted venules were selected, custom-made tissue holders (circular shape with an inner diameter of 1.5 cm) were used to capture these pieces of the mesentery containing the selected microvessels. As illustrated by Fig. 1, two black fiducial marks were made on the captured tissue to define the region of interest (ROI) at the macroscopic level, and color images of the ROI were taken at both low and high magnifications to assist the identification of the targeted venules. The low magnification images were taken using a 10× objective to better define the ROI, and high magnification images were taken using the same optical setup as the ultra-high speed imaging but with a CCD camera. By comparing the high magnification images with the corresponding high-speed images, the ROI could be refined. Finally, landmarks (bifurcations, fat cells, etc.) near the targeted microvessels were noted and their distances to the targeted microvessels were measured. These distances facilitated precise location of the ROI. The tissue samples were then used for either histology or TEM analysis. Also, to help identify the targeted vessels during histology and TEM sectioning, a higher concentration of green color India ink was perfused into the vascular network after the ultra-high speed images were captured (but before the tissue sample was resected).
Figure 1.

Illustration of the image registration method used to spatially locate the targeted region for histology or TEM analysis. A piece of the mesentery containing the targeted microvessel was captured by a tissue holder with an O-ring (image shown on the upper left corner). Two black fiducial marks on the tissue define the region of interest (ROI) at the macroscopic level. The images in the center were taken at low magnification to better define ROI. The image on the right was taken using the same optical setup as the ultra-high speed imaging but with a CCD camera. By comparing the images on the right with the corresponding high-speed images, the targeted region where the ultrasound-activated MBs had been observed could be identified. Landmarks, such as vessel bifurcation points, fat cells and other vessels, were identified and their distances to the targeted region were measured to assist locating of the targeted region.
For histological analysis, each tissue sample was fixed in 4% parafomaldehyde, and eventually embedded in glycol methacrylate (Rosenberg et al. 1960). Due to the need for accurate and precise sectioning from specific regions of the sample, the sample was left in the tissue holder until just before it was embedded. The block was then placed under a stereo microscope to transfer landmarks as noted in the recorded color images to the outside of the block. These markers were used as references during sectioning to help identify the targeted region of interest. Each section was 1 μm thick and subsequent sections were cut at 4-μm increments through the region of the targeted microvessel that had interacted with the MB as recorded in the ultra-high speed image sequence. Most sections were saved to ensure that we did not inadvertently section through a critical area and lose data. All sections were subsequently stained with Lee’s methylene blue-basic fuchsin.
To examine the vascular structure at a sub-cellular level, tissue samples were also prepared for TEM analysis. Each tissue sample was first fixed in a Karnovsky’s fixative (Karnovsky 1965), washed with cacodylate-sucrose buffer, post fixed in osmium tetroxide, again washed with deionized water, stained with uranyl acetate and then rinsed several times with water. After dehydration, the sample was infiltrated with resin, which polymerized overnight. The targeted microvessel was identified with the help of the recorded color images. Sections as thin as 100 nm were cut at 10-μm steps through the region on the targeted microvessel that had interacted with the recorded MBs. Subsequently, these sections were mounted on grids and stained with uranyl acetate and lead citrate. The sections were examined using a transmission electron microscope (JEM 1200EX II; JEOL, Tokyo, Japan). For both histology and TEM analyses, control sections were obtained from either nearby microvessels or the same microvessels at locations away from the targeted regions. Evaluation of the histology slides and TEM images were conducted by reviewers who were ‘blinded’ to the history of the sample under inspection.
RESULTS
Figure 2a shows an ultra-high speed image sequence of MB interaction with a venule (D = 33 μm) from insonation at a peak negative pressure PNP = 1.5 MPa. The corresponding vessel displacement measured at the location indicated by the arrows is shown in Fig. 2b. In this particular case, two MBs appeared in the second frame. Apparent coalescence of these MBs was observed. The maximum expansion occurred in the frame captured at 1.8 μs. At this time, vessel distension due to MB growth reached a maximum of ~2 μm (Fig. 2b). In this frame, the maximum equivalent radii of the two MBs at upper and lower positions were 14 and 6 μm, respectively. The subsequent collapse of the coalesced MB led to invagination of both sides of the vessel wall, which can be observed in the frame captured at 3.6 μs, and all later frames. The reflected ultrasound pulse from the microscope objective was measured to arrive at ~4 μs, which was associated with MB re-expansion (6 and 6.6 μs) and re-collapse (7.2 and 7.8 μs). As shown in Fig. 2b, the MB dynamics associated with the reflected pulse did not lead to significant additional vessel wall motions; vessel invagination persisted over the entire 7.8 μs experiment, reaching a maximum invagination of ~11 μm. This result is very typical of vessel displacements that we have observed (Chen et al. 2010; Chen et al. 2011a; Chen et al. 2011b). In this case, invagination exceeded distension by a factor of approximately five. Note that even after the pulse was over, the vessel remained invaginated (although the data are not presented here, the vessel eventually returned to its equilibrium position as observed under the microscope after the ultra-high speed images were captured).
Figure 2.

(a) Dynamics of MBs in a venule of diameter 33 μm insonated by an ultrasound pulse with PNP = 1.5 MPa. A time stamp for each frame is located at the bottom left corner and the scale bar on the bottom right of the last frame represents 10 μm. The locations of the vessel wall in the first and last frames are highlighted by the dashed lines. (b) Displacements of the vessel wall measured from the images. The vessel displacements were measured at the same point (indicated by the arrow in each frame) on the vessel wall that had the largest extent of deformation through the observation. The error bars indicate the standard deviation of three repeated measurements. This example shows that MB oscillation induced the distention and invagination of both sides of the vessel wall with invagination significantly larger than distention.
Selected images of the corresponding histology results are shown in Fig. 3. Figure 3a shows that an intact venule was observed in a control section obtained from the targeted microvessel shown in Fig. 2a, but away from the targeted region. Similarly intact vessel structures were also observed in sections obtained from other microvessels not treated by ultrasound. The green material inside the vessel lumen is India ink. Figure 3b shows a section from the vessel segment in the targeted region revealing a region of darkly stained material projecting into the vessel lumen (arrow). This material appears to form a tag of tissue that is continuous with the vessel wall, suggestive as being part of an endothelial cell (nucleus and some cytoplasm) that was torn free from the vessel wall. In nine sequential sections representing about 37 μm of the vessel’s length (each section was 1 μm thick and every fourth section was mounted), a site of darkly stained material was observed within the vessel lumen. No leakage of perfused MBs or ink was observed. Six venules were selected for histological analysis and similar vascular damage associated with the invagination-dominated vessel response noted in Fig. 3b was observed in three of the six (summarized in Fig. 6).
Figure 3.
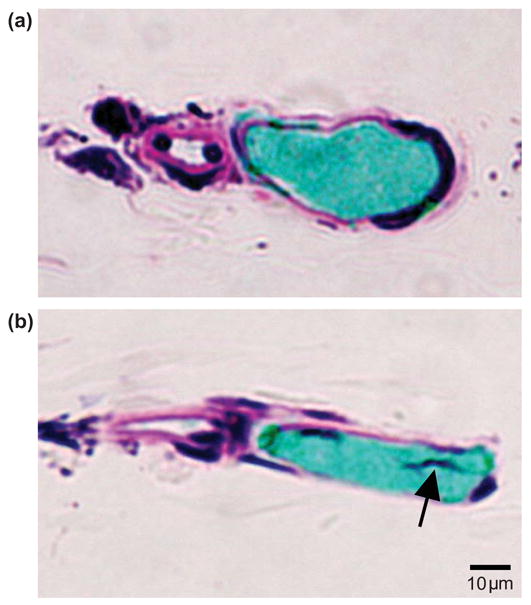
Histological sections corresponding spatially to the targeted region in the vessel recorded by the image sequence shown in Fig. 2a, or in an untreated region of the same vessel. (a) Control section obtained from the venule shown in Fig. 2a, but out of the MB-microvessel interaction region. It shows the vessel section was intact. (b) A representative section within the targeted region. The dark materials (arrow) inside the vessel lumen appears to form a tag of tissue that is continuous with the vessel wall, suggestive as being part of an endothelial cell (nucleus and some cytoplasm) that was torn free from the vessel wall.
Figure 6.

(a) Comparison of maximum vessel invagination and distention of 9 venules selected for histology (H: squares) or TEM analysis (T: circles). Vascular damage (filled symbols) was observed in 5 cases and no damage (open symbols) was found in the remaining 4 cases. Their diameters were between 16 and 46 μm; the ultrasound pulse PNPs were 1.5, 4.0 or 5.6 MPa. These data all fall above the dashed line, demonstrating that invagination exceeded distention. (b) Plot of vessel invagination ratio (the maximum invagination normalized by the initial radius of the vessel) with respect to the PNP of the ultrasound pulses. This plot suggests that vessel damage is associated with the invagination ratio. For the five cases that vascular damage was observed, the normalized invagination ratios were all larger than 0.5 (dashed line). (c) Plot of vessel distention ratio (the maximum distention normalized by the initial radius of the vessel) with respect to the PNP of the ultrasound pulses. No simple correlation exists for the distension ratio.
Figure 4a shows another example of a MB interacting with a venule of D = 40 μm, in this case insonated with PNP = 4 MPa. In the frame captured at 0.6 μs, the MB deformed to an approximately hemispherical shape, accompanied by slight (~1 μm) inward movement of the adjacent vessel wall, suggesting that the MB was at the beginning of its collapse phase. In the frame captured at 1.2 μs, the MB collapsed and significant inward movement of the vessel wall was observed. The MB re-expanded at 2.4 μs, but the vessel wall continued to move inward (again, typical of our observations (Chen et al. 2011b)). At 3.6 μs, the inward vessel displacement was near its maximum, about 11 μm (Fig. 4b). The reflected pulse from the microscope objective contributed to MB re-expansion (4.8 and 6 μm) and re-collapse (5.4 and 6.6 μs), leading to the rapid fluctuations of the vessel displacement curve in Fig. 4b; however, there persisted a net vessel inward displacement throughout the period of MB oscillation. The last panel in Fig. 4a was acquired at 0.5 ms, and indicates that the vessel recovered within this time period. In this case, vessel distention either did not occur, or it was very slight and presented for very short duration. Note that the reflected ultrasound pulse from the microscope objective arrived at a delay of about 4 μs for both cases shown in Figs. 2 and 4; however, different bubble dynamics were observed after the echo returned because of the difference in the bubble size, vessel diameter, distance from the microbubble to the vessel wall and the pressure level.
Figure 4.

(a) Dynamics of a MB in a venule of diameter 40 μm insonated by PNP = 4 MPa. A time stamp for each frame is located at the bottom left corner and the scale bar on the bottom right of the last frame represents 10 μm. Note that the last frame was captured at 0.5 ms, and shows that the invaginated vessel had recovered to its initial state by this time, suggesting an elastic deformation of the vessel. (b) Displacements of the vessel wall measured at the location pointed out by the arrow in the first frame. The displacement measured in the last frame was about 0.7 μm, which was not shown in the plot. The error bars indicate the standard deviation of three repeated measurements on the same image sets. In this case, the oscillating MB induced obvious invagination on the right side vessel wall; no distention was observed.
Figure 5a shows the corresponding TEM images for the same targeted microvessel seen in Fig. 4a, but outside of the targeted region. All layers of the vessel appear to be intact. The black particles seen inside the vessel lumen are green India ink, which appears to have a relatively high affinity for electron-dense TEM stain. Figure 5b shows a section of the vessel in Fig. 4a within the targeted region. Protrusions of cellular material (arrows) into the vessel lumen are noted at several locations around the internal/luminal surface of this vessel and they appear to be associated with damaged endothelial cells. When these sites are viewed at a higher magnification (Fig. 5c), the protruding material is clearly identified as extensions of cytoplasm originating from endothelial cells revealed by the numerous secretory vesicles (arrow) typical of such cells. These protrusions are continuous with nearby endothelial cells and indicate an area of damage/tearing of an endothelial cell plasma membrane permitting a portion of its cytoplasm to be displaced into the vessel lumen. These cellular protrusions are further evidence for cavitation-induced destruction of endothelial cells. The tearing of the plasma membrane was observed in each of six serial sections. Each section was 100 nm and was cut at a 10 μm step-size, which permits a first order estimate of the length of the region damaged by bubble activity to be around 60 μm. The characteristics of the vascular damage seen in the vessel illustrated in Figs. 5b and 5c were apparently associated with invagination-dominated vessel response, and the damage pattern is consistent with the histology results shown in Fig. 3. Three venules were selected for TEM analysis. The tearing of the plasma membrane from the vessel wall was observed in two of the three, and the damage corresponded directly to the invagination-dominated vessel deformation (summarized in Fig. 6).
Figure 5.

TEM results directly corresponding to the ultra-high speed image sequence shown in Fig. 4a. (a) A control section obtained out of the region that interacted with the MB recorded in Fig. 4a. It shows the venule was intact. (b) One section obtained within the region that interacted with the MB recorded in Fig. 4a. Protrusions of cellular material (arrows) into the vessel lumen are noted at several locations around the internal/luminal surface of this vessel and they appear to be associated with damaged endothelial cells. (c) High magnification view of the region near the arrow on the right in (b), showing that the protruding material is clearly identified as extensions of cytoplasm originating from endothelial cells revealed by the numerous secretory vesicles (arrow) typical of such cells. The vascular damage pattern is consistent with that observed in the histology images shown in Fig. 3b.
In this study, a total of 9 venules were selected for either histology or TEM analysis, based on the qualification criteria described earlier. Again, these venules were exposed to a single-shot, short ultrasound pulse. In all cases, invagination exceeded distension (see Fig. 6a). The vessel diameters ranged from 16 to 46 μm and the applied PNPs were 1.5, 4.0 or 5.6 MPa. Of the 9 cases, 3 out of 6 showed evidence of vascular damage in histology analysis and 2 out of 3 showed evidence of vascular damage in TEM images.
To compare among different vessels, two normalized parameters were defined: (1) vessel distention ratios were defined as the maximum vessel outward displacements normalized by the initial vessel radius, and (2) vessel invagination ratios were similarly defined by the maximum vessel inward displacements normalized by the initial vessel radius. It is worthwhile to plot the vessel invagination and distension ratios with respect to PNP. Figure 6b suggests that venular damage is associated with the vessel invagination ratio. At each pressure level, vascular damage was only observed in cases with higher invagination ratio. The mean of the invagination ratios for the normal (i.e., undamaged) group was 0.41 (standard deviation = 0.12), and for the damaged group was 0.66 (standard deviation = 0.15). A paired, one-tailed t-test on these two groups found the invagination ratio was significantly greater in vessels which were judged subsequently to be damaged relative to those which were not (p = 0.01). However, it bears remembering that the number of observations involved is small. For the damaged vessels, the normalized invagination ratios were all larger than 0.5, suggesting that microscopically detectable damage requires that the vessel be pulled inward by more than 50% of the its initial radius (note that this threshold behavior should be considered qualitative as we were only able to accurately measure the vessel wall motion in the image plane). At PNP = 1.5 MPa, there was one case that had an invagination ratio > 0.5, but was not discernibly damaged. In this case, the vessel was surrounded by fat cells, while all others did not have fat cells close by. These fat cells may provide some support to the vessel, increasing its tensile strength. Performing a similar analysis for distension found no simple correlation (Fig. 6c). The mean of the distention ratios for the normal group was 0.14 (standard deviation = 0.10), and for the damaged group was 0.15 (standard deviation = 0.12). A paired, one-tailed t-test on these two groups found there was no significant difference in their distention ratios (p = 0.45).
DISCUSSION
The objective of this preliminary study was to correlate, with a high degree of spatial and temporal resolution, MB and microvessel interaction dynamics with histologic or ultrastructural observable vessel wall damage. In particular, single-shot, short ultrasound pulses produced readily observable damage to the endothelium of affected vessels in five out of nine cases, characterized by the separation of part of the endothelium from the vessel wall. Histological staining also showed the nucleus and a portion of the cytoplasm of endothelial cells to have been displaced into the vessel lumen, while TEM analysis showed protrusion of endothelial cytoplasm within the lumen. No extravasation of cellular debris was observed because the basement membrane remained intact in all cases (note also that the damage being discussed is due to a single short MB ‘event’).
Similar vascular damage patterns induced by ultrasound-activated MBs have been reported before, although the acoustic parameters and animal models differ from ours. Stieger et al. (Stieger et al. 2007) reported that vessel permeability enhancement was associated with the separation of the venule endothelial layer from underlying pericytes in TEM images of chorioallantoic membrane tissue after being treated by ultrasound pulses with a center frequency of 1 MHz and PNP of 2.3 MPa, applied in 10-cycle pulses at a pulse repetition frequency of 500 Hz for 5 seconds. Zachary et al. (Zachary et al. 2006) performed histological studies of MB-induced bioeffects to auricular rabbit arteries at PNP = 9.5 MPa (MI = 4.4) for a treatment period of 30 min and found vascular damage with similar characteristics: the tunica intima was lifted off of the internal elastic lamina. Our results are also consistent with previous studies showing scanning electron microscopy images of rabbit auricular vein treated by MBs activated by 1 MHz ultrasound pulses with PNP = 3.3 MPa for 60 s (Hwang et al. 2005). There, the authors showed that at this pressure level, the luminal side of the plasma membrane was removed from some endothelial cells, exposing the cytoplasm and nucleus, at least parts of which remained associated with the vessel wall. (At higher PNP, more severe damage was observed; i.e., the basement membrane of the auricular vein appeared to have been denuded entirely of endothelial cells.)
Of particular interest is the question of whether distension driven by MB expansion, or invagination driven by MB collapse produced the vascular damage. Although the temporal resolution of the observed MB dynamics and the spatial correlation of the histology or TEM images to the region of MB activity were both high, the available evidence is not sufficiently strong to permit a definitive conclusion on this issue. However, reasonable inferences can be made and preliminary insights obtained:
In our previous work, we showed that confined flow (owing to the vessel boundary) and pressures emitted by the bubble can lead to asymmetric vessel displacements in which invagination exceeds distension (Chen et al. 2011b). In all cases here, the amount of invagination exceeded distension, in some cases by a large ratio (e.g., in Fig. 2 the maximum invagination was about five-fold greater than distention). Moreover, in the case shown in Fig. 4, no distension was measured, yet damage was observed. In addition, we analyzed the degree of displacement during distension and invagination. There appears to be a relatively good correlation between invagination and damage. For the five cases in which vascular damage was observed, the normalized invagination ratios were all larger than 0.5. No positive correlation was found with distension. The mechanism of damage however, most probably relates to the strains and stresses associated with distention and invagination. During invagination, the curvature of the vessel wall is often observed to be greater than during distention, suggesting that the associated strains and stresses are greater during invagination. Detailed modeling of this effect is needed. We should point out that there are certainly cases in which MB growth can distend a vessel to a larger extent than invagination. Those cases, however, appear to be more consistent with MB that fill the vessel and distend the vessel significantly (Chen et al. 2010). Our study did not address this condition.
This work is limited to rat mesenteric microvessels in which the blood was replaced by saline. The presence of red blood cells would probably influence the microbubble/vessel wall interactions. Such a study is being planned for future work. In total, the mesentery seems to be a useful model system for studying interactions between vessels and acoustically-driven microbubbles. Mechanically, the mesentery, as with other real tissues, exhibits nonlinear strain stiffening (Fung 1993), and thus mechanical effects observed in the mesenteric vessels are likely more representative of vessels in living tissues than are the synthetic tubes that have been studied in the past.
This study was limited to venules, and thus it may or may not be valid to generalize the observations and interpretations to cases involving capillaries, arterioles, veins, or arteries. Such generalizations should be approached with caution, because, as mentioned before: (1) vessel permeabilization effects occur principally in the microcirculation (Miller et al. 2008), (2) venules respond more than arterioles to nearby MB oscillations (Chen et al. 2011b), (3) endothelial cell damage in rat mesenteries was dominant in venules (Kobayashi et al. 2002), and (4) dye extravasation after treatment by ultrasound-activated MBs was observed in vessels with diameters smaller than 55 μm (Stieger et al. 2007). With these in mind, some reasonable but provisional inferences about capillaries and arterioles can nonetheless be made. In capillaries, the MB may fill the vessel during expansion, leading to larger distension. However, the confinement of the capillary vessel wall and the viscous and resistive effects of the fluid inside the capillaries may also hinder MB expansion. Meanwhile, flow confinement, especially when bubble expansion size approaches the vessel diameter, may enhance invagination (Chen et al. 2011b). Thus, vessel distention may become significant in capillaries, but vessel invagination may still play an important role in capillary damage. As for arterioles, we have found that they also show a greater degree of invagination than distension (Chen et al. 2011b), suggesting that a similar cavitation-induced vessel damage mechanism operates in arterioles and venules alike. Finally, we note an example of activated cavitation bubble-induced vascular damage in a rabbit femoral artery, in which the authors inferred that invagination was responsible for the observed damage (Van Leeuwen et al. 1993).
CONCLUSIONS
The interactions of MBs with microvessels were observed using ultra-high speed photomicrography, and the resulting vascular bioeffects were assessed by histological and TEM analyses. In the present study, it was found that the invagination-dominated vessel deformation was directly associated with endothelial cell damage, which was characterized by the separation of the endothelium from the vessel wall. Microscopically detectable damage seems to require that the vessel be pulled inward to about more than 50% of the vessel’s unperturbed initial radius. This damage pattern was consistent with forces applied on the vessel wall that are associated with vessel invagination. These observations support the hypothesis that vessel invagination may be the principal mechanism for microvessel bioeffects in venules by microbubbles.
Acknowledgments
The authors thank Drs. Lawrence A. Crum, Michael R. Bailey, Wayne Kreider, Joo Ha Hwang, Oleg A. Sapozhnikov and Yak-Nam Wang for many helpful discussions. They also thank Frank Starr, Francis Olson, Brian MacConaghy and Michael S. Canney for assistance with the experiments. This work was supported in part by NIH grants EB000350 (NIBIB), AR053652 (NIAMS) and P01DK043881 (NIDDKD).
Footnotes
Publisher's Disclaimer: This is a PDF file of an unedited manuscript that has been accepted for publication. As a service to our customers we are providing this early version of the manuscript. The manuscript will undergo copyediting, typesetting, and review of the resulting proof before it is published in its final citable form. Please note that during the production process errors may be discovered which could affect the content, and all legal disclaimers that apply to the journal pertain.
References
- Blake JR, Gibson DC. Cavitation bubbles near boundaries. Annu Rev Fluid Mech. 1987;19:99–123. [Google Scholar]
- Bohmer MR, Chlon CH, Raju BI, Chin CT, Shevchenko T, Klibanov AL. Focused ultrasound and microbubbles for enhanced extravasation. J Control Release. 2010;148:18–24. doi: 10.1016/j.jconrel.2010.06.012. [DOI] [PMC free article] [PubMed] [Google Scholar]
- Brujan EA, Nahen K, Schmidt P, Vogel A. Dynamics of laser-induced cavitation bubbles near an elastic boundary. J Fluid Mech. 2001;433:251–281. [Google Scholar]
- Chen H, Brayman AA, Bailey MR, Matula TJ. Blood vessel rupture by cavitation. Urol Res. 2010;38:321–326. doi: 10.1007/s00240-010-0302-5. [DOI] [PMC free article] [PubMed] [Google Scholar]
- Chen H, Brayman AA, Kreider W, Bailey MR, Matula TJ. Observations of translation and jetting of ultrasound-activated microbubbles in mesenteric microvessels. Ultrasound Med Biol. 2011a;37:2139–2148. doi: 10.1016/j.ultrasmedbio.2011.09.013. [DOI] [PMC free article] [PubMed] [Google Scholar]
- Chen H, Kreider W, Brayman AA, Bailey MR, Matula TJ. Blood vessel deformations on microsecond time scales by ultrasonic cavitation. Phys Rev Lett. 2011b;106:034301. doi: 10.1103/PhysRevLett.106.034301. [DOI] [PMC free article] [PubMed] [Google Scholar]
- Chen WS, Brayman AA, Matula TJ, Crum LA. Inertial cavitation dose and hemolysis produced in vitro with or without Optison (R) Ultrasound Med Biol. 2003a;29:725–737. doi: 10.1016/s0301-5629(03)00013-9. [DOI] [PubMed] [Google Scholar]
- Chen WS, Brayman AA, Matula TJ, Crum LA, Miller MW. The pulse length-dependence of inertial cavitation dose and hemolysis. Ultrasound Med Biol. 2003b;29:739–748. doi: 10.1016/s0301-5629(03)00029-2. [DOI] [PubMed] [Google Scholar]
- Choi JJ, Feshitan JA, Baseri B, Wang S, Tung YS, Borden MA, Konofagou EE. Microbubble-size dependence of focused ultrasound-induced blood-brain barrier opening in mice in vivo. IEEE Trans Biomed Eng. 2010;57:145–154. doi: 10.1109/TBME.2009.2034533. [DOI] [PMC free article] [PubMed] [Google Scholar]
- Fong SW, Klaseboer E, Turangan CK, Khoo BC, Hung KC. Numerical analysis of a gas bubble near bio-materials in an ultrasound field. Ultrasound Med Biol. 2006;32:925–942. doi: 10.1016/j.ultrasmedbio.2006.03.005. [DOI] [PubMed] [Google Scholar]
- Fung YC. Biomechanics: Mechanical Properties of Living Tissues. New York: Springer; 1993. [Google Scholar]
- Hwang JH, Brayman AA, Reidy MA, Matula TJ, Kimmey MB, Crum LA. Vascular effects induced by combined 1-MHz ultrasound and microbubble contrast agent treatments in vivo. Ultrasound Med Biol. 2005;31:553–564. doi: 10.1016/j.ultrasmedbio.2004.12.014. [DOI] [PubMed] [Google Scholar]
- Hwang JH, Tu J, Brayman AA, Matula TJ, Crum LA. Correlation between inertial cavitation dose and endothelial cell damage in vivo. Ultrasound Med Biol. 2006;32:1611–1619. doi: 10.1016/j.ultrasmedbio.2006.07.016. [DOI] [PubMed] [Google Scholar]
- Karnovsky MJ. A formaldehyde-glutaraldehyde fixative of high osmolarity for use in electron microscopy. J Cell Biol. 1965;27:137A–138A. [Google Scholar]
- Keller MW, Segal SS, Kaul S, Duling B. The behavior of sonicated albumin microbubbles within the microcirculation - a basis for their use during myocardial contrast echocardiography. Circ Res. 1989;65:458–467. doi: 10.1161/01.res.65.2.458. [DOI] [PubMed] [Google Scholar]
- Kobayashi N, Yasu T, Yamada S, Kudo N, Kuroki M, Kawakami M, Miyatake K, Saito M. Endothelial cell injury in venule and capillary induced by contrast ultrasonography. Ultrasound Med Biol. 2002;28:949–956. doi: 10.1016/s0301-5629(02)00532-x. [DOI] [PubMed] [Google Scholar]
- Kodama T, Takayama K. Dynamic behavior of bubbles during extracorporeal shock-wave lithotripsy. Ultrasound Med Biol. 1998;24:723–738. doi: 10.1016/s0301-5629(98)00022-2. [DOI] [PubMed] [Google Scholar]
- Liu Y, Miyoshi H, Nakamura M. Encapsulated ultrasound microbubbles: therapeutic application in drug/gene delivery. J Control Release. 2006;114:89–99. doi: 10.1016/j.jconrel.2006.05.018. [DOI] [PubMed] [Google Scholar]
- Miller DL, Averkiou MA, Brayman AA, Everbach EC, Holland CK, Wible JH, Wu JR. Bioeffects considerations for diagnostic ultrasound contrast agents. J Ultrasound Med. 2008;27:611–632. doi: 10.7863/jum.2008.27.4.611. [DOI] [PubMed] [Google Scholar]
- Ohl CD, Arora M, Ikink R, de Jong N, Versluis M, Delius M, Lohse D. Sonoporation from jetting cavitation bubbles. Biophys J. 2006;91:4285–4295. doi: 10.1529/biophysj.105.075366. [DOI] [PMC free article] [PubMed] [Google Scholar]
- Phillips LC, Klibanov AL, Wamhoff BR, Hossack JA. Localized ultrasound enhances delivery of rapamycin from microbubbles to prevent smooth muscle proliferation. J Control Release. 2011;154:42–49. doi: 10.1016/j.jconrel.2011.04.020. [DOI] [PMC free article] [PubMed] [Google Scholar]
- Prentice P, Cuschierp A, Dholakia K, Prausnitz M, Campbell P. Membrane disruption by optically controlled microbubble cavitation. Nat Phys. 2005;1:107–110. [Google Scholar]
- Rosenberg M, Bartl P, Leško J. Water-soluble methacrylate as an embedding medium for the preparation of ultrathin sections. J Ultrastruct Res. 1960;4:298–303. doi: 10.1016/s0022-5320(60)80024-x. [DOI] [PubMed] [Google Scholar]
- Skyba DM, Price RJ, Linka AZ, Skalak TC, Kaul S. Direct in vivo visualization of intravascular destruction of microbubbles by ultrasound and its local effects on tissue. Circulation. 1998;98:290–293. doi: 10.1161/01.cir.98.4.290. [DOI] [PubMed] [Google Scholar]
- Sorace AG, Warram JM, Umphrey H, Hoyt K. Microbubble-mediated ultrasonic techniques for improved chemotherapeutic delivery in cancer. J Drug Target. 2012;20:43–54. doi: 10.3109/1061186X.2011.622397. [DOI] [PMC free article] [PubMed] [Google Scholar]
- Stieger SM, Caskey CF, Adamson RH, Qin S, Curry F-RE, Wisner ER, Ferrara KW. Enhancement of vascular permeability with low-rrequency contrast-enhanced ultrasound in the chorioallantoic membrane model. Radiology. 2007;243:112–121. doi: 10.1148/radiol.2431060167. [DOI] [PubMed] [Google Scholar]
- Tu J, Hwang JH, Matula TJ, Brayman AA, Crum LA. Intravascular inertial cavitation activity detection and quantification in vivo with optison. Ultrasound Med Biol. 2006a;32:1601–1609. doi: 10.1016/j.ultrasmedbio.2006.07.015. [DOI] [PubMed] [Google Scholar]
- Tu J, Matula TJ, Brayman AA, Crum LA. Inertial cavitation dose produced in ex vivo rabbit ear arteries with Optison (R) by 1-MHz pulsed ultrasound. Ultrasound Med Biol. 2006b;32:281–288. doi: 10.1016/j.ultrasmedbio.2005.10.001. [DOI] [PubMed] [Google Scholar]
- Van Leeuwen TG, Meertens JH, Velema E, Post MJ, Borst C. Intraluminal vapor bubble induced by excimer laser-pulse causes microsecond arterial dilation and invagination leading to extensive wall damage in the rabbit. Circulation. 1993;87:1258–1263. doi: 10.1161/01.cir.87.4.1258. [DOI] [PubMed] [Google Scholar]
- Yasu T, Schmid-Schonbein GW, Cotter B, DeMaria AN. Flow dynamics of QW7437, a new dodecafluoropentane ultrasound contrast agent, in the microcirculation: microvascular mechanisms for persistent tissue echo enhancement. J Am Coll Cardiol. 1999;34:578–586. doi: 10.1016/s0735-1097(99)00209-0. [DOI] [PubMed] [Google Scholar]
- Zachary JF, Blue JP, Miller RJ, O’Brien WD., Jr Vascular lesions and s-thrombomodulin concentrations from auricular arteries of rabbits infused with microbubble contrast agent and exposed to pulsed ultrasound. Ultrasound Med Biol. 2006;32:1781–1791. doi: 10.1016/j.ultrasmedbio.2005.11.013. [DOI] [PMC free article] [PubMed] [Google Scholar]
- Zhong P, Zhou YF, Zhu SL. Dynamics of bubble oscillation in constrained media and mechanisms of vessel rupture in SWL. Ultrasound Med Biol. 2001;27:119–134. doi: 10.1016/s0301-5629(00)00322-7. [DOI] [PubMed] [Google Scholar]