Abstract
This study investigated the efficacy of frequency modulated ultrasound attenuation in the assessment of the trabecular structural properties. Four frequency modulated signals were created to represent four frequency bands centered at 500 kHz, 900 kHz, 1.3 MHz and 1.7 MHz with the bandwidth of 400 kHz. Five one-centimeter trabecular cubes were harvested from fresh bovine distal femur. The cubes underwent four steps of demineralization process to expand the sample size to twenty five with the greater variations of the structural properties for the better correlation study. Pearson correlation study was performed between the ultrasound attenuation in four frequency bands and the trabecular structural properties. The results showed that correlations of frequency modulated ultrasound attenuation to the trabecular structural properties are dependent on frequency bands. The attenuation in proximal-distal orientation had the highest correlation to BV/TV (R2=0.73, p<0.001) and trabecular thickness (R2=0.50, p<0.001) at the frequency band centered at 1.7 MHz. It was equivalent in the four frequency bands in correlation to the trabecular number (average R2=0.80, p<0.001) and to the trabecular separation (average R2 =0.83, p<0.001). The attenuation in anterio-posterial orientation had the highest correlation to BV/TV (R2=0.80, p<0.001) and trabecular thickness (R2=0.71, p<0.001) at the frequency band centered at 1.3 MHz. The attenuation in the first frequency band was the most sensitive to the trabecular number (R2=0.71, p<0.001) and trabecular separation (R2=0.80, p<0.001). No significant correlation was observed for the attenuation in medial-lateral orientation across the four frequency bands.
Keywords: ultrasound, ultrasound attenuation bone, bone density, frequency modulation
Introduction
Osteoporosis is a medical condition in skeleton system that plagues the elderly population. It is characterized as the loss of bone mass and the weakened trabecular structures resulting in non-traumatic fractures (Marcus, Feldman 2001). Patients suffering from hip fractures due to osteoporosis are most likely to become dependent or even die within one year following the injury. The annual cost for osteoporosis related treatment is well over billions of dollars. Currently, dual energy x-ray absorptiometry (DXA) is considered as the gold standard for the osteoporosis diagnosis. It measures the bone mineral density (BMD) or bone mineral content (BMC) derived from the x-ray attenuation in bone tissue. However, the density measured from DXA is not the true volume density but a plane density in the unit of g/cm2 because the x-ray image is the projection of 3-D volume onto a 2-D plane. It includes the average density from both cortical and trabecular bone where the latter is more sensitive to bone loss during the early stage of osteoporosis. Therefore, DXA has limitations to assess the key bone properties that are directly related to osteoporotic fracture. Alternatively, ultrasound, as a non-invasive and non-ionizing modality, has been proved to be a reliable diagnostic tool for osteoporosis. Ultrasound is a mechanical wave and its behavior in bone is determined by the bone structural and mechanical properties such as density and Young’s modulus. Broadband ultrasound attenuation (BUA) is the widely used index to be highly correlated to those properties. Commercialized quantitative ultrasound (QUS) devices developed based on this concept have been used as the preliminary diagnostic tool for osteoporosis in the past two decades.
BUA was first introduced by Langton in 1980s as the ultrasound index to characterize bone mineral density (Langton, Palmer 1984). Calcaneus is the primary BUA measurement site because it contains 90% of trabecular bone (Langton 2011). In addition, it is easily accessible and its relatively parallel medial and lateral surfaces enable the easy penetration of ultrasound waves for transmission tests. Ultrasound attenuation in bone is frequency dependent and it becomes linear with respect to frequency in trabecular bone in the frequency range approximately between 300 kHz and 700 kHz (Langton, Palmer 1984, Lin, Qin 2001). The slope of the attenuation curve is defined as BUA and it is often normalized to the sample thickness as the normalized BUA (nBUA) to minimize the effect from bone size.
BUA has demonstrated high correlation to density in trabecular bones (R2=0.75) (McKelvie, Fordham 1989). Langton et al indicated that nBUA was a good predictor of bone’s Young’s modulus (R2=0.76) and strength (R2=0.74) respectively (Langton, Njeh 1996). BUA in calcaneus was a good indicator of the femoral fracture risk (Bauer, Gluer 1997) and femoral strength (Bouxsein, Coan 1999, Bouxsein, Courtney 1995). It was also significantly correlated to BMD at lumbar spine and femoral neck (Salamone, Krall 1994). BUA is sensitive to the anisotropic structure of trabecular bone independent to BMD, indicating that BUA has the potential to assess the bone’s mechanical and structural properties that the BMD does not have the capability (Gluer, Wu 1993, Han and Rho 1998, Nicholson, Muller 1998, Nicholson, Haddaway 1994).
BUA has its own limitation as an index characterizing the ultrasound attenuation in bone. It requires the linearity between ultrasound attenuation and frequency to be a valid index. Therefore, BUA has to be calculated from the attenuation in trabecular bone within the specified frequency range. Wear reported the ultrasound attenuation in human calcaneus from 0.2 MHz to 1.7 MHz (Wear 2001). Chaffai et al indicated that the ultrasound attenuation in calcaneus trabecular bone was best modeled using a nonlinear power fit between 200 kHz and 2 MHz (Chaffai, Padilla 2000). Therefore, BUA cannot utilize the attenuation beyond the prescribed frequency band of linear attenuation that could be more sensitive to the bone properties. BUA is not the only ultrasound attenuation index sensitive to bone properties. Tavakoli and Evans reported that ultrasound attenuation at different frequencies between 300 kHz and 800 kHz had high correlations to bone density with the r value in the range between 0.68 and 0.97, which was equivalent to BUA (Tavakoli and Evans 1991). The data indicated that frequency specific ultrasound attenuation could be a valuable index without the linearity limitation.
Another restriction of BUA is the broadband ultrasound signal used in measurement. BUA only uses a portion of the frequency spectrum of the pulse and is not energy efficient. It is difficult to increase signal noise ratio at the frequencies away from the center frequency of the ultrasound transducer. Modulated ultrasound signal is a special designed signal pattern that can focus the ultrasound energy within the desired frequency band and thus has high signal to noise ratio (Misaridis and Jensen 2005). Nowicki et al applied the similar signal to measure BUA (Nowicki, Litniewski 2003). In our previous study, frequency modulated ultrasound attenuation (FMA) has demonstrated the equivalent or higher performance compared to BUA (Lin, Xia 2009) within the frequency range of 300 kHz and 700 kHz in the trabecular bone from sheep femoral condyle. Results showed that FMA demonstrated higher correlations to the trabecular structure properties in the proximal-distal orientation (R2=0.84 for BV/TV, R2=0.77 for Tb.Th, R2=0.7 for Tb.Sp) than BUA (R2=0.30 for BV/TV, R2=0.27 for Tb.Th, R2=0.33 for Tb.Sp). In the anterio-posterial orientation, FMA had higher correlation to Tr.Sp (R2=0.64) than BUA (R2=0.48), and relatively lower correlation to BV/TV (R2=0.48) and Tb.Th (R2=0.31) than BUA (R2=0.64 for BV/TV and R2=0.58 for Tb.Th). Since FMA does not have the restrictions of BUA, it can be used in any interested frequency bands. The objective of this study was to extend previous study and investigate the efficacy of FMA in four consecutive frequency bands in the range between 300 KHz and 1.9 MHz as a new ultrasound index characterizing the trabecular structure properties.
Methods and Materials
Five one-centimeter cubed trabecular samples were harvested from bovine distal femur obtained from local slaughter house. Soft tissue was first removed from the femur prior to the cutting. The orientation of the cube was carefully aligned to correspond to proximal-distal (PD), medial-lateral (ML) and anterial-posterial (AP) anatomic orientations of the femur. The cube was first cut using band-saw (Craftsman 21400) and then perfected into a 1 cm × 1 cm × 1 cm cube using a grinding machine. Water jet was used to clean out the bone marrow from each sample cubes. Bone samples were wrapped in gauze soaked with 10X Phosphate Buffered Saline (PBS) and stored at −20°C until the experiment.
Demineralization
Since the bone samples were from animals at the similar age, it is likely that the trabecular structural variation of the samples was small. In order to obtain a large variation in the trabecular bone properties, four demineralization treatments were performed on each sample. This effectively expanded the sample size to twenty-five with a broad variation in bone properties. 1.9% formic acid solution was made by diluting 88% formic acid solution with distilled water as the demineralization agent. The sample was immersed in the formic acid in a beaker and placed on a shaker at the rate of 120 rotations per minute. At the end of the demineralization, the sample was immediately placed in clear ammonia for 30 minutes to neutralize the acid and stop the demineralization.
An additional one-centimeter trabecular cube sample was made to verify the relationship between the demineralization time and the mineral loss using this acid solution. The dry weight of the sample was measured before the demineralization. It was then demineralized for ten minutes using the above protocol. The dry weight of the sample was measured again to obtain the loss of mineral after the demineralization. This procedure was repeated twelve times so that the curve representing percentage loss of sample dry weight versus the duration of demineralization was obtained up to two hours. It was the guideline to determine the time required to demineralize the five trabecular sample with up to 10% decrease of dry weight per demineralization process.
Ultrasound Measurement
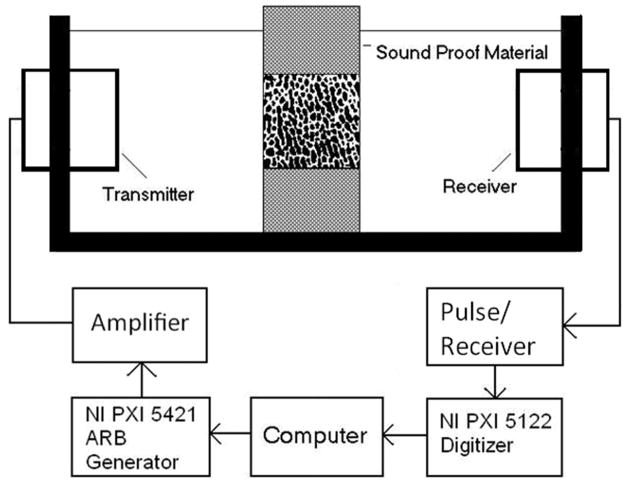
Ultrasound attenuation measurement was performed using insertion method (Langton, Palmer 1984). Two identical broadband plane ultrasound transducers of 12.7 mm in diameter with a center frequency at 1 MHz (Olympus NDT, MA, USA) were mounted on opposite sides of a 10×10×15 cm water tank (Fig. 1) filled with degassed water. The separation of the transducers was approximately 10 cm. The bone sample was positioned in the ultrasound path using a sample holder and surrounded with sound proof material to stop the bypassing ultrasound wave. The modulated ultrasound signal in this study was linear frequency sweep signals in four consecutive frequency bands, i.e. 300 KHz to 700 KHz, 700 kHz to 1.1 MHz, 1.1 MHz to 1.5MHz and 1.5MHz to 1.9 MHz. The ultrasound transducer is broadband with the center frequency at 1 MHz. It can effectively generate the ultrasound signals in the four frequency bands with the help of amplifier to enhance signal noise ratio. The modulated signal waveform was first created by software and downloaded to the arbitrary waveform generator (PXI5421, National Instruments, Austin, TX, USA) to drive the ultrasound transmitter via the power amplifier (2100L, Electronics and Innovation, Rochester, NY, USA). The output modulated signal amplitude was 30 V peak to peak and the duration of the signal was 10 μs. The ultrasound signal from the receiver was amplified by the pulser/receiver (Model 5072PR, Olympus NDT, MA, USA) and digitized using 14-bit resolution high speed digitizer (PXI 5122, National Instruments, Austin, TX, USA) for further analysis. The sampling frequency was 100 MHz and 5000 data points or 50 μs of signal was recorded for each signal. Both the arbitrary waveform generator and the high speed digitizer were connected to the computer through PXI bus, an industrial version of the PCI bus in personal computers. The entire system was automated by a personal computer (Dimension 8100, Dell, Round Rock, TX, USA) using LabVIEW (National Instruments, Austin, TX, USA) as the software platform for the control and measurement.
Figure 1.
The experiment setup for the ultrasound test: FMA signal is created by the arbitrary signal generator (NI PXI 5421) and amplified to drive the transmitter. Bone sample is submerged in degassed water, placed in the middle of the ultrasound pathway and surrounded by sound absorbent material. The received ultrasound signal is amplified by pulse/receiver and digitized by high speed digitizer (NI PXI 5122).
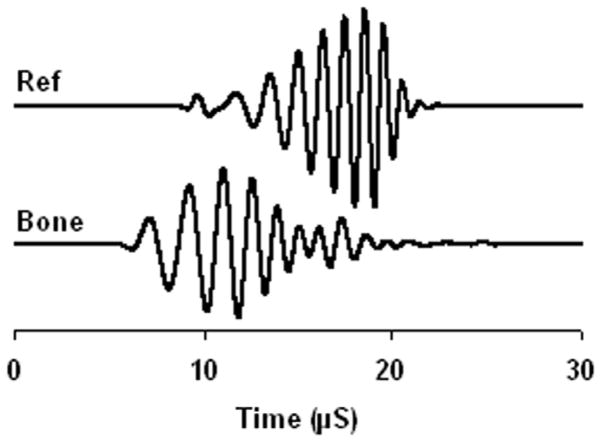
The insertion method requires measuring two ultrasound signals. One is the reference signal where the bone sample is not in the ultrasound path. The other signal is the bone signal where the bone sample is inserted in the ultrasound path. Figure 2 shows the frequency modulated reference signal and bone signal. The ultrasound energy is proportional to the square of the acoustic pressure and consequently the voltage of the electric signal from the ultrasound receiver. Therefore, we used the integral of the voltage squared to represent the ultrasound energy and the coefficient that converts the voltage back to acoustic pressure was canceled out during the attenuation calculation because it was the ratio of reference signal energy to the bone signal energy. In the measurement of FMA, the frequency modulated signal envelope was first extracted using Hilbert transformation. The signal energy was then calculated from the envelope using the following equation (Lin, Xia 2009).
Figure 2.
The sample FMA reference signal and bone signal.
| (2) |
Where E was the acoustic energy, f(t) was the signal envelope of receiving ultrasound and T is the duration of the signal. The FMA was then calculated as shown in equation (3).
| (3) |
where Er was the ultrasound energy of the reference signal and Eb was the ultrasound energy of the bone signal. FMA was normalized to the sample thickness in the orientation of the measurement. Due to the anisotropy of the trabecular sample, three orthogonal ultrasound measurements were conducted corresponding to the proximal-distal (PD), anterio-posterial (AP) and medial-lateral (ML) anatomic orientations. The PD orientation is the primary loading orientation as it is aligned with the weight bearing load. Four ultrasound attenuations were measured corresponding to the four frequency bands.
Micro Computed Tomography Measurement of trabecular structure
Micro Computed Tomography (μCT) (SCANCO μ75, SCANCO, Bassersdorf, Switzerland) was used to measure the structure parameters of the trabecular sample following the well established algorithms and protocol (Lublinsky, Ozcivici 2007). The phantom from manufacturer was used for calibration. A global threshold automatically selected by the software was used for the separation of bone tissue from non-bone tissue. A series of 2D gray-scale images were obtained at the resolution of 39μm for the threshold validation. Pixels with intensity equal or larger than the threshold were considered to be bone pixels of value 1, while those with intensities lower than the threshold were considered to be background with value 0. The threshold was confirmed manually as the binary image after thresholding best matched trabecular bone pattern from the original gray scale image where the area for bone tissue was preserved. A contour around the trabecular cube was drawn around each sample to calculate the trabecular structural parameter. The volume of the trabeculae (BV) was calculated using tetrahedrons representing the enclosed volume of the triangulated surface used for the surface area calculation. BV was also normalized to the total volume of the sample (TV) to obtain the relative bone volume (BV/TV). Mean trabecular thickness (Tb.Th) was computed from the local trabecular thickness from the voxels representing bone. With this technique, thickness can be estimated without a model assumption. Trabecular separation (Tb.Sp) was calculated by applying the same technique to the non-bone volume in the 3D data set. Trabecular number is defined as the ratio of BV/TV to the trabecular thickness (Parfitt, Drezner 1987).
Data Analysis
Pearson correlation analysis was performed between the FMA and the structural properties of the trabecular samples. FMA values in the four frequency bands and three orientations were correlated to the trabecular structure properties obtained from the micro CT measurements respectively. Those properties are BV/TV, trabecular number, trabecular thickness and trabecular separation. SPSS (IBM, Armonk, New York, USA) was the statistics analysis software. Correlation coefficients and related p values were reported.
Results
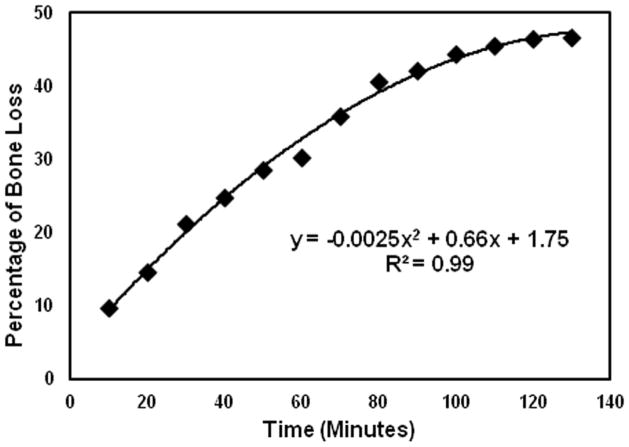
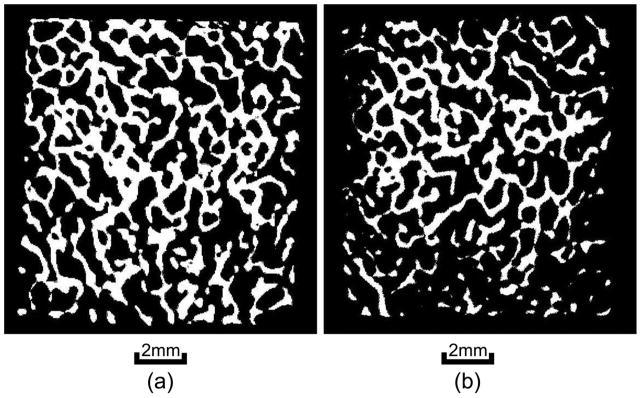
Figure 3 illustrates the percentage of bone loss in reference to the time of exposure of the trabecular bone sample in the formic acid. The demineralization process is almost linear in the first hour and approached plateau in the second hour. The relationship is fitted nicely using a second order polynomial. The bone sample lost approximately half of its mass after two hours of exposure. It also indicated that ten minutes of exposure to the formic acid could reduce 5 to 10% of the bone mass in the first four demineralization steps. Therefore, ten minutes was chosen as the time of exposure in the demineralization of the trabecular samples. Each sample went through four steps of demineralization process followed by the ultrasound and μCT measurements at each step. When the non-demineralized samples were included, the demineralization has expanded the samples size from five to twenty-five. The means and standard deviations of the samples structural properties are listed in table 1 and their coefficients of variation before and after demineralization are shown in table 2a. Table 2b illustrates the coefficients of variation of the FMA in four frequency bands and three orthogonal orientations before and after demineralization. Figure 4 are the μCT images before and after demineralization from the middle region of the same sample. Bone loss is throughout the sample with more loss at the peripheral than the center.
Figure 3.
The μCT images from the middle cross section of the same sample before demineralization (left) and after demineralization (right). Both bone density and morphology are changed after demineralization.
Table 1.
The means and standard deviations of trabecular number, BV/TV, trabecular thickness and trabecular space of the trabecular samples.
| Tr.N (mm−1) | BV/TV | Tr.Th (mm) | Tr.Sp (mm) |
|---|---|---|---|
| 1.86±0.28 | 0.28±0.13 | 0.18±0.03 | 0.50±0.12 |
Table 2.
The comparison of coefficients of variation of trabecular number, BV/TV, trabecular thickness and trabecular separation (a), and the coefficients of variation of FMA in four frequency bands before demineralization (n=5) and after demineralization (n=25) (b).
| Tr.N | BV/TV | Tr.Th | Tr.Sp |
|---|---|---|---|
| 0.09 (n=5) | 0.30 (n=5) | 0.10 (n=5) | 0.13 (n=5) |
| 0.15 (n=25) | 0.44 (n=25) | 0.17 (n=25) | 0.24 (n=25) |
| (a) | |||
| PD | AP | ML | |
|---|---|---|---|
| 300 kHz to 700 kHz | 0.16 (n=5) | 0.15 (n=5) | 0.09 (n=5) |
| 0.29 (n=25) | 0.28(n=25) | 0.32 (n=25) | |
| 700 kHz to 1.1 MHz | 0.15 (n=5) | 0.16 (n=5) | 0.07 (n=5) |
| 0.24 (n=25) | 0.23 (n=25) | 0.24 (n=25) | |
| 1.1 MHz to 1.5 MHz | 0.13 (n=5) | 0.17 (n=5) | 0.02 (n=5) |
| 0.21 (n=25) | 0.20 (n=25) | 0.17 (n=25) | |
| 1.5 MHz to 1.9 MHz | 0.13 (n=5) | 0.13 (n=5) | 0.03 (n=5) |
| 0.20 (n=25) | 0.25 (n=25) | 0.20 (n=25) | |
| (b) | |||
Figure 4.
The relationship between the percentage bone dry weight loss and the time of demineralization treatment. Ten minutes of treatment can cause 5 to 10% bone loss.
The frequency spectra of the four frequency modulated signals are illustrated in figure 5. They are normalized to the peak of the respective frequency band. The cutoff frequency is defined as the frequency where the spectra values drop to half of the peak. The four spectra have the same bandwidth and the prescribed cutoff frequencies.
Figure 5.
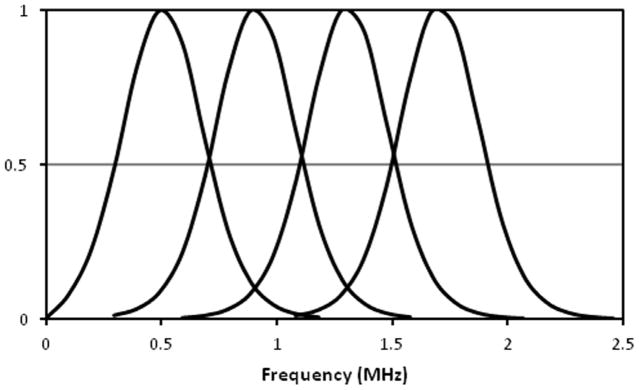
The normalized frequency spectra of the four FMA signals. Each signal has a band width of 400 kHz and the cutoff frequency was set at the half of the peak.
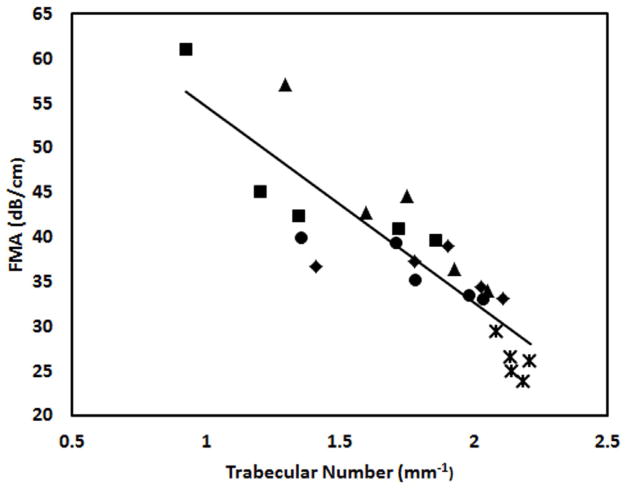
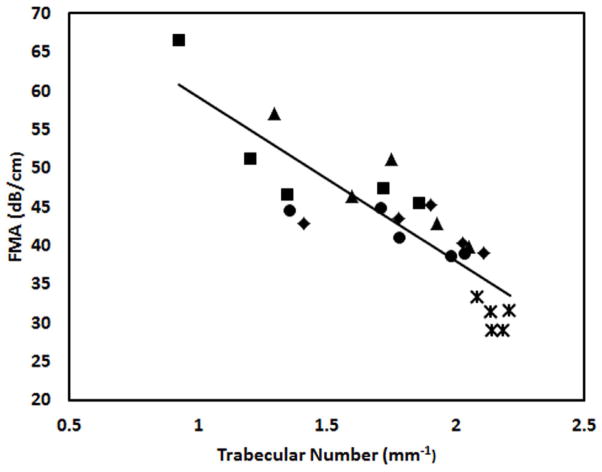
Figure 6 shows the average FMA in three orthogonal orientations in the four frequency bands. FMA in ML orientation are higher than the FMA in the other two orientations. Figure 7 illustrates the distribution of the trabecular number of the bone samples after demineralization and their correlation to the FMA in second and fourth frequency bands. The samples derived from four demineralization steps are represented using the same marker. Table 3 is the summary of the correlation coefficients. FMA in both PD and AP orientations show modest or high correlation to the trabecular properties with the p value less than 0.001. On the contrary, poor correlations are observed for the FMA in ML orientation. For the PD orientation, FMA is equivalent in the four frequency bands when it is correlated to the trabecular number with average R2 values close to 0.8 and to the trabecular separation with the average R2 values of 0.83. The FMA in the highest frequency band (1.5 MHz to 1.9 MHz) shows the highest correlation to BV/TV with the R2 value of 0.73. The FMA in the two highest frequency bands (1.1 MHz to 1.9 MHz) show the highest correlation to the trabecular thickness with the R2 values of 0.48 and 0.50.
Figure 6.
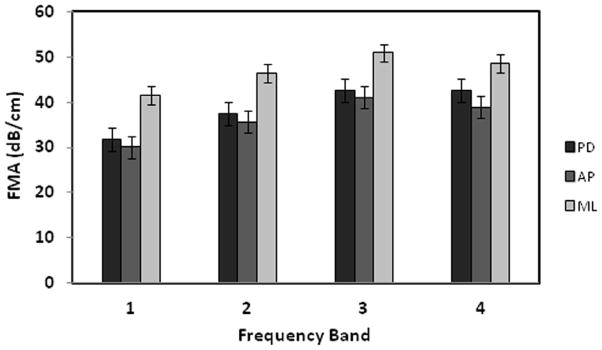
The means and the standard deviations of the FMA values in four frequency bands (1–4) with the bandwidth of 400 kHz and the center frequencies at 500 kHz, 900 kHz, 1.3 MHz, and 1.7 MHz respectively. The FMA in ML orientation is the highest followed by the FMA in PD and AP orientations.
Figure 7.
The relationship between trabecular number and the FMAs in PD orientation in the second (a) and the fourth frequency bands (b). Samples derived from the same original cube but at different demineralization stages are grouped using the same marker.
Table 3.
The correlation coefficients (R2) between the ultrasound attenuation in four frequency bands and the trabecular structural properties of the samples. Table 3a is for the attenuation measured in PD orientation. Table 3b is for the attenuation measured in the AP orientation. Table 3c is for the attenuation measured in the ML orientation.
| Tr.N | BV/TV | Tr.Th | Tr.Sp | |
|---|---|---|---|---|
| 300 kHz to 700 kHz | 0.78* | 0.62* | 0.38* | 0.85* |
| 700 kHz to 1.1 MHz | 0.81* | 0.68* | 0.45* | 0.84* |
| 1.1 MHz to 1.5 MHz | 0.78* | 0.70* | 0.48* | 0.78* |
| 1.5 MHz to 1.9 MHz | 0.81* | 0.73* | 0.50* | 0.83* |
| (a) | ||||
| Tr.N | BV/TV | Tr.Th | Tr.Sp | |
|---|---|---|---|---|
| 300 kHz to 700 kHz | 0.71* | 0.68* | 0.48* | 0.80* |
| 700 kHz to 1.1 MHz | 0.63* | 0.75* | 0.60* | 0.73* |
| 1.1 MHz to 1.5 MHz | 0.58* | 0.80* | 0.71* | 0.66* |
| 1.5 MHz to 1.9 MHz | 0.54* | 0.61* | 0.43* | 0.63* |
| (b) | ||||
| Tr.N | BV/TV | Tr.Th | Tr.Sp | |
|---|---|---|---|---|
| 300 kHz to 700 kHz | 0.27 (p=0.01) | 0.22 (p=0.012) | 0.15 (p=0.033) | 0.33 (p=0.002) |
| 700 kHz to 1.1 MHz | 0.20 (p=0.025) | 0.17 (p=0.026) | 0.14 (p=0.045) | 0.25 (p=0.007) |
| 1.1 MHz to 1.5 MHz | 0.16 (p=0.04) | 0.15 (p=0.047) | 0.13 (p=0.072) | 0.21 (p= 0.015) |
| 1.5 MHz to 1.9 MHz | 0.16 (p=0.051) | 0.15 (p=0.062) | 0.09 (p=0.15) | 0.21 (p=0.023) |
| (c) | ||||
indicates the p value of the correlation coefficient was less than 0.001.
For the AP orientation, the frequency band has more distinctive effect on the correlation between FMA and the trabecular properties. The FMA in the first frequency band (300 kHz to 700 kHz) is the most sensitive to the trabecular number and trabecular separation. The FMA in the third frequency band (1.1 MHz to 1.5 MHz) is the most sensitive to the BV/TV and the trabecular thickness. The FMA in the ML orientation does not show significant correlation to the trabecular properties compared to the FMA in the other two orientations. Its correlation coefficients are better in the low frequency bands than in the high frequency bands.
Discussion
The demineralization process expanded the variation of the samples. The μCT images showed that the bone loss was across the sample with more at the peripheral than in the center after the process. The demineralization effectively created a different sample with lower bone mass and modified morphology. Therefore, those samples were not suitable to study the correlation of FMA to the demineralization alone because the accompanied morphologic change was also contributed to the FMA change. The demineralization treatment was not intended to create osteoporotic bone samples. however, the localized bone loss was similar to osteoporosis where bone loss starts in local regions of the bone (Rupprecht, Pogoda 2006). The coefficient of variance confirmed that the increase of variability of both bone properties and FMA values after the demineralization treatment for the better correlation analysis.
The FMA in four consecutive frequency bands demonstrated distinct correlations to the trabecular structure. The FMA in PD and AP orientations were better indicators of BV/TV and trabecular thickness at higher frequency bands compared to the FMA between 300 kHz and 700 kHz. The maximum R2 values were observed in high frequency bands, i.e. frequency band (1.5 MHz to 1.9 MHz) for FMA in PD orientation and in the third frequency band (1.1 MHz to 1.5MHz) for the FMA in AP orientation. The trabecular bone can be considered as a filter of the ultrasound wave. The ultrasound attenuation is the frequency response of the filter determined by the trabecular structure. It is derived from the acoustic energy difference as the result of the insertion of the trabecular bone sample. In principle, the energy difference is caused by ultrasound absorption in bone, which turns the acoustic energy to heat, and the ultrasound scattering, which turns the acoustic energy away from the receiving transducer. The ultrasound scattering is significant and has been studied extensively as an alternative means to characterize the bone properties (Chaffai, Peyrin 2002, Laugier, Chaffai 2000, Wear 1999, Wear 2008). Wear investigated the mechanism using a phantom mimicking trabecular bone (Wear 2008). He divided the ultrasound attenuation into three components, the absorption in simulating marrow, the absorption of shear wave in trabecular mimicking nylon wires converted from the incident longitudinal wave, and the longitudinal scattering wave from the nylon wires. It also indicated that the attenuation from scattering demonstrated high nonlinearity and was a significant component in the ultrasound attenuation at high frequencies. The recent work by Pinton et al also demonstrated that attenuation due to absorption in bone was small compared the attenuation due to reflection, scattering, and mode conversion (Pinton, Aubry 2012). The alignment of the trabeculae is highly directional and the trabecular architecture usually presents a quasi-periodic structure intervened with trabeculae and marrow. Therefore, the diffracted ultrasound waves through the trabecular bone often contain repeated scattered waves from the quasi-periodic structure (Pereira, Bridal 2004). The scattered waves can either enhance the ultrasound signals if they are in phase or attenuate the signals if they are out of phase. Such behaviors are controlled by the ultrasound wavelength as well as the size of trabeculae and marrow spaces. Ultrasound wavelength is determined by the ultrasound wave velocity and the frequency. When the wavelength is much larger than the size of the scatter, ultrasound wave can travel around it as if it did not exist. When the wavelength is much smaller than the scatter size, the ultrasound behaves like hitting a wall. In both scenarios, the ultrasound wave is not sensitive to the dimension change of the scatter. However, when the wavelength is in the same order as the scatter size, the ultrasound wave will become sensitive to the dimension change of the scatter. The ultrasound frequency used in this study is from 300 kHz to 1.9 MHz. Assuming the ultrasound velocity of 2000 m/s in the trabecular bone (Lin, Mittra 2006, Lin, Qin 2001), the ultrasound wavelength ranges from 1 mm to 6.7 mm. Small wavelength corresponds to the high ultrasound frequency. The size of the trabeculae is in the order of sub millimeter (0.18±0.03 mm in this study) and thus it is conceivable that the high frequency ultrasound is more sensitive to the trabeculae size change than low frequency ultrasound because its wavelength is short and comparable to the scatter size. The ultrasound attenuation appeared to be leveled off at high frequencies. This was the indication that ultrasound attenuation was non-linear at those frequencies where the ultrasound wavelength was on the same order of the trabecular size and may reach a local peak. Similar nonlinearity was also observed in the ultrasound attenuation in sheep femoral condyle (Lin, Qin 2001). Wear also demonstrated the nonlinearity in his phantoms mimicking trabecular bone (Wear 2008). The data showed an attenuation peak between 1 MHz and 2 MHz and the peak location shifted towards high frequency as the size of the trabecular mimicking filament decreased.
BV/TV and trabecular thickness are the best indicators of the bone density and the trabecular size respectively. Their good correlations to high frequency ultrasound attenuation in PD and AP orientations are the reflection of the high sensitivity of the high frequency ultrasound wave to the changing geometry of the trabeculae. On the other hand, trabecular number and trabecular separation are the indexes for the distribution of trabeculae within the trabecular bone. Trabecular number is not the good indicator of the trabecular size or trabecular density. Thus it tends to have less effect on the ultrasound attenuation in different frequency bands compared to the BV/TV and trabecular thickness. Trabecular separation represents the distance between the middle lines of two trabeculae. It is not the measurement of the size of the marrow space between trabeculae. Therefore, it is not expected to have the similar correlation pattern as the trabecular thickness or BV/TV.
The trabecular orientation attributes to the difference of FMA in the three orthogonal orientations. The interaction between the ultrasound wave and the trabecular structure is complicated. The PD orientation corresponds to the primary loading orientation of the trabecular bone and is most likely in line with the trabecular orientation. Therefore the FMA in PD orientation should behave different from the FMAs in other two orientations. Although both AP and ML orientations are perpendicular to PD orientation, the geometry of the trabecular bone may contribute to their difference. For example, trabecular bones often take the plate shape. Therefore, they may maintain different angles to the AP and ML orientations. This could partially explain the difference of the FMA in AP orientation from the FMA in the ML orientation. Although the orientation can be predicted from the 3D μCT data set, it is only meaningful when all samples are aligned precisely inside the μCT chamber, i.e. the computed trabecular orientations are in reference to the same coordinate system and thus the angle between the trabecular orientation and ultrasound bean can be quantified. The experiment design in this study did not require the sample alignment because trabecular number, BV/TV, trabecular thickness and trabecular separation are independent to the trabecular orientation. Therefore, our data are not sufficient to investigate the correlation between the trabecular orientation and the ultrasound attenuation.
There is no convincing evidence for the explanation of the poor correlation of FMA in ML orientation with the trabecular properties. Since the phenomenon was consistent for all four signals, it was unlikely caused by the experiment error. FMA is dependent on the measurement orientation because of the anisotropic structure of trabecular bone, The FMA in PD orientation was slightly higher that the FMA in AP orientation. However, FMA in ML orientation was considerably higher than the other two counterparts. This could indicate that there were trabecular structure factors other than those represented in BV/TV and trabecular thickness played a significant role in the ultrasound propagation in ML orientation. Such factors were insignificant to ultrasound attenuation if the ultrasound wave were in PD and AP orientations.
Previous study indicated that FMA in the frequency band between 300 kHz and 700 kHz was equivalent to the BUA derived from the same frequency band in characterizing the structure properties in trabecular bone (Lin, Xia 2009). However, FMA is significantly different from BUA. BUA is derived from attenuation in the fixed frequency band (300 kHz to 700 kHz) and represents the special relationship of ultrasound attenuation with respect to the ultrasound frequency. Its effectiveness relies on the linearity of the attenuation frequency relationship. BUA is not applicable beyond the prescribed frequency band where the ultrasound attenuation is linear to frequency. FMA is the simplest form of ultrasound attenuation derived directly from the ultrasound energy difference between the reference signal and bone signal and does not have the restriction of linear ultrasound attenuation. It uses frequency modulated signal to restrict the ultrasound energy within a specific frequency band. It can be considered as the extension of the single frequency attenuation, which was confirmed to be an effective indicator of bone properties (Tavakoli and Evans 1991). Since FMA is independent on the linear relationship between the attenuation and frequency, it can be easily applied in any frequency bands. This allows FMA to be a potential index to use ultrasound in the various frequency bands to interrogate bone properties.
The frequency modulated signals were designed to cover four equal frequency bands within 300 kHz and 1.9 MHz. The ultrasound transducer is broadband with the center frequency at 1 MHz. It can generate the ultrasound signals in the four frequency bands. It is obvious that the transducer is less efficient generating ultrasound at frequency away from its working frequency due to the frequency response of the transducer. The signal loss at those frequencies was compensated using the power amplifier. In addition, frequency sweep signal can also enhance the signal noise ratio as it focuses the energy in the designated frequency band. Therefore, the influence of background noise was minimal in the study.
FMA can be applied at any anatomic site and in any frequency band where ultrasound attenuation can be measured. The same concept can also be used in the ultrasound backscattering studies to investigate the frequency specific backscattering. However, additional work needs to be done before FMA can be served as a true index of bone properties. The sensitivity of FMA to bone properties is specific to anatomic site because the trabecular architecture varies among locations. The result from this study cannot be extrapolated to other anatomic site and species. The FMA at the interested anatomic sites should be thoroughly investigated before it can be used in diagnostics. This includes the identification of the optimal frequency band for FMA so that the FMA will not only have the highest correlation to the bone structure properties but also be indicative of the bone mechanical property directly related to osteoporotic fractures. Large sample size is also required to generate the narrow confidence interval to enhance the accuracy of the correlation coefficient and the linear regression equations that enable the prediction of the bone properties from the ultrasound attenuations.
In conclusion, FMA is a valuable index to explore the information pertinent to bone properties embedded in ultrasound attenuation. It will not be the replacement of BUA but rather the supplementary index in the applications of ultrasound in the skeletal system especially in the frequency band where nonlinear relationship between ultrasound attenuation and frequency exists.
Acknowledgments
This work is kindly supported by the National Space Biomedical Research Institute (SMST01603) through NASA Cooperative Agreement NCC 9-58, NIH (AR49286 and AR52379), and NYSTAR. The authors would like to thank Aileen Jiang, lab intern, for her assistance in the sample preparation and ultrasound measurement.
Footnotes
Publisher's Disclaimer: This is a PDF file of an unedited manuscript that has been accepted for publication. As a service to our customers we are providing this early version of the manuscript. The manuscript will undergo copyediting, typesetting, and review of the resulting proof before it is published in its final citable form. Please note that during the production process errors may be discovered which could affect the content, and all legal disclaimers that apply to the journal pertain.
References
- Bauer DC, Gluer CC, Cauley JA, Vogt TM, Ensrud KE, Genant HK, Black DM. Broadband ultrasound attenuation predicts fractures strongly and independently of densitometry in older women. A prospective study. Arch Intern Med. 1997;157:629–34. [PubMed] [Google Scholar]
- Bouxsein ML, Coan BS, Lee SC. Prediction of the strength of the elderly proximal femur by bone mineral density and quantitative ultrasound measurements of the heel and tibia. Bone. 1999;25:49–54. doi: 10.1016/s8756-3282(99)00093-9. [DOI] [PubMed] [Google Scholar]
- Bouxsein ML, Courtney AC, Hayes WC. Ultrasound and densitometry of the calcaneus correlate with the failure loads of cadaveric femurs. Calcif Tissue Int. 1995;56:99–103. doi: 10.1007/BF00296338. [DOI] [PubMed] [Google Scholar]
- Chaffai S, Padilla F, Berger G, Laugier P. In vitro measurement of the frequency-dependent attenuation in cancellous bone between 0. 2 and 2 MHz. Journal of the Acoustical Society of America. 2000;108:1281–89. doi: 10.1121/1.1288934. [DOI] [PubMed] [Google Scholar]
- Chaffai S, Peyrin F, Nuzzo S, Porcher R, Berger G, Laugier P. Ultrasonic characterization of human cancellous bone using transmission and backscatter measurements: Relationships to density and microstructure. Bone. 2002;30:229–37. doi: 10.1016/s8756-3282(01)00650-0. [DOI] [PubMed] [Google Scholar]
- Gluer CC, Wu CY, Genant HK. Broadband ultrasound attenuation signals depend on trabecular orientation: an in vitro study. Osteoporos Int. 1993;3:185–91. doi: 10.1007/BF01623674. [DOI] [PubMed] [Google Scholar]
- Han S, Rho JY. Dependence of broadband ultrasound attenuation on the elastic anisotropy of trabecular bone. Proc Inst Mech Eng [H] 1998;212:223–27. doi: 10.1243/0954411981534006. [DOI] [PubMed] [Google Scholar]
- Langton CM. The 25th anniversary of BUA for the assessment of osteoporosis: time for a new paradigm? Proceedings of the Institution of Mechanical Engineers Part H-Journal of Engineering in Medicine. 2011;225:113–25. doi: 10.1243/09544119JEIM777. [DOI] [PubMed] [Google Scholar]
- Langton CM, Njeh CF, Hodgskinson R, Currey JD. Prediction of mechanical properties of the human calcaneus by broadband ultrasonic attenuation. Bone. 1996;18:495–503. doi: 10.1016/8756-3282(96)00086-5. [DOI] [PubMed] [Google Scholar]
- Langton CM, Palmer SB, Porter RW. The measurement of broadband ultrasonic attenuation in cancellous bone. Eng Med. 1984;13:89–91. doi: 10.1243/emed_jour_1984_013_022_02. [DOI] [PubMed] [Google Scholar]
- Laugier P, Chaffai S, Peyrin F, Berger GG. Theoretical models of ultrasonic backscatter in human cancellous bone. Osteoporosis International. 2000;11:7–7. [Google Scholar]
- Lin W, Mittra E, Qin YX. Determination of ultrasound phase velocity in trabecular bone using time dependent phase tracking technique. Journal of Biomechanical Engineering-Transactions of the Asme. 2006;128:24–29. doi: 10.1115/1.2132369. [DOI] [PubMed] [Google Scholar]
- Lin W, Qin YX, Rubin C. Ultrasonic wave propagation in trabecular bone predicted by the stratified model. Ann Biomed Eng. 2001;29:781–90. doi: 10.1114/1.1397787. [DOI] [PubMed] [Google Scholar]
- Lin W, Xia Y, Qin YX. Characterization of the trabecular bone structure using frequency modulated ultrasound pulse. Journal of the Acoustical Society of America. 2009;125:4071–77. doi: 10.1121/1.3126993. [DOI] [PMC free article] [PubMed] [Google Scholar]
- Lublinsky S, Ozcivici E, Judex S. An automated algorithm to detect the trabecular-cortical bone interface in micro-computed tomographic images. Calcified Tissue International. 2007;81:285–93. doi: 10.1007/s00223-007-9063-8. [DOI] [PubMed] [Google Scholar]
- Marcus R, Feldman D, Kelsey J. Osteoporosis. San Diego: Academic Press; 2001. p. 32. [Google Scholar]
- McKelvie ML, Fordham J, Clifford C, Palmer SB. In vitro comparison of quantitative computed tomography and broadband ultrasonic attenuation of trabecular bone. Bone. 1989;10:101–04. doi: 10.1016/8756-3282(89)90005-7. [DOI] [PubMed] [Google Scholar]
- Misaridis T, Jensen JA. Use of modulated excitation signals in medical ultrasound. Part I: Basic concepts and expected benefits. Ieee Transactions on Ultrasonics Ferroelectrics and Frequency Control. 2005;52:177–91. doi: 10.1109/tuffc.2005.1406545. [DOI] [PubMed] [Google Scholar]
- Nicholson PH, Muller R, Lowet G, Cheng XG, Hildebrand T, Ruegsegger P, van der PG, Dequeker J, Boonen S. Do quantitative ultrasound measurements reflect structure independently of density in human vertebral cancellous bone? Bone. 1998;23:425–31. doi: 10.1016/s8756-3282(98)00128-8. [DOI] [PubMed] [Google Scholar]
- Nicholson PHF, Haddaway MJ, Davie MWJ. The Dependence of Ultrasonic Properties on Orientation in Human Vertebral Bone. Physics in Medicine and Biology. 1994;39:1013–24. doi: 10.1088/0031-9155/39/6/007. [DOI] [PubMed] [Google Scholar]
- Nowicki A, Litniewski J, Secomski W, Lewin PA, Trots I. Estimation of ultrasonic attenuation in a bone using coded excitation. Ultrasonics. 2003;41:615–21. doi: 10.1016/s0041-624x(03)00181-1. [DOI] [PubMed] [Google Scholar]
- Parfitt AM, Drezner MK, Glorieux FH, Kanis JA, Malluche H, Meunier PJ, Ott SM, Recker RR. BONE HISTOMORPHOMETRY - STANDARDIZATION OF NOMENCLATURE, SYMBOLS, AND UNITS. Journal of Bone and Mineral Research. 1987;2:595–610. doi: 10.1002/jbmr.5650020617. [DOI] [PubMed] [Google Scholar]
- Pereira WCA, Bridal SL, Coron A, Laugier P. Singular spectrum analysis applied to backscattered ultrasound signals from in vitro human cancellous bone specimens. Ieee Transactions on Ultrasonics Ferroelectrics and Frequency Control. 2004;51:302–12. [PubMed] [Google Scholar]
- Pinton G, Aubry JF, Bossy E, Muller M, Pernot M, Tanter M. Attenuation, scattering, and absorption of ultrasound in the skull bone. Med Phys. 2012;39:299–307. doi: 10.1118/1.3668316. [DOI] [PubMed] [Google Scholar]
- Rupprecht M, Pogoda P, Mumme M, Rueger JM, Puschel K, Amling M. Bone microarchitecture of the calcaneus and its changes in aging: A histomorphometric analysis of 60 human specimens. Journal of Orthopaedic Research. 2006;24:664–74. doi: 10.1002/jor.20099. [DOI] [PubMed] [Google Scholar]
- Salamone LM, Krall EA, Harris S, Dawson-Hughes B. Comparison of broadband ultrasound attenuation to single X-ray absorptiometry measurements at the calcaneus in postmenopausal women. Calcif Tissue Int. 1994;54:87–90. doi: 10.1007/BF00296056. [DOI] [PubMed] [Google Scholar]
- Tavakoli MB, Evans JA. Dependence of the velocity and attenuation of ultrasound in bone on the mineral content. Phys Med Biol. 1991;36:1529–37. doi: 10.1088/0031-9155/36/11/012. [DOI] [PubMed] [Google Scholar]
- Wear KA. Frequency dependence of ultrasonic backscatter from human trabecular bone: theory and experiment. J Acoust Soc Am. 1999;106:3659–64. doi: 10.1121/1.428218. [DOI] [PMC free article] [PubMed] [Google Scholar]
- Wear KA. Ultrasonic attenuation in human calcaneus from 0.2 to 1. 7 MHz. Ieee Transactions on Ultrasonics Ferroelectrics and Frequency Control. 2001;48:602–08. doi: 10.1109/58.911743. [DOI] [PMC free article] [PubMed] [Google Scholar]
- Wear KA. Mechanisms for Attenuation in Cancellous-Bone-Mimicking Phantoms. Ieee Transactions on Ultrasonics Ferroelectrics and Frequency Control. 2008;55:2418–25. doi: 10.1109/TUFFC.949. [DOI] [PMC free article] [PubMed] [Google Scholar]
- Wear KA. Ultrasonic scattering from cancellous bone: A review. Ieee Transactions on Ultrasonics Ferroelectrics and Frequency Control. 2008;55:1432–41. doi: 10.1109/TUFFC.2008.818. [DOI] [PMC free article] [PubMed] [Google Scholar]


