Abstract
Vascular calcification is common in chronic kidney disease, where cardiovascular mortality remains the leading cause of death. Patients with kidney disease are often prescribed vitamin D receptor agonists (VDRAs) that confer a survival benefit, but the underlying mechanisms remain unclear. Here we tested two VDRAs in a mouse chronic kidney disease model where dietary phosphate loading induced aortic medial calcification. Mice were given intraperitoneal calcitriol or paricalcitol three times per week for three weeks. These treatments were associated with half of the aortic calcification compared to no therapy, and there was no difference between the two agents. In the setting of a high phosphate diet, serum parathyroid hormone and calcium levels were not significantly altered by treatment. VDRA therapy was associated with increased serum and urine klotho levels, increased phosphaturia, correction of hyperphosphatemia, and lowering of serum fibroblast growth factor-23. There was no effect on elastin remodeling or inflammation, however, the expression of the anti-calcification factor, osteopontin, in aortic medial cells was increased. Paricalcitol upregulated osteopontin secretion from mouse vascular smooth muscle cells in culture. Thus, klotho and osteopontin were upregulated by VDRA therapy in chronic kidney disease, independent of changes in serum parathyroid hormone and calcium.
Keywords: Vascular calcification, chronic kidney disease, vitamin D, klotho, osteopontin
INTRODUCTION
There is a heavy burden of cardiovascular morbidity and mortality in patients with chronic kidney disease (CKD)1. Disordered mineral metabolism occurs early in CKD and is characterized by secondary hyperparathyroidism, elevated fibroblast growth factor-23 (FGF23) levels, and klotho and 1,25-dihydroxyvitamin D deficiency. Higher 25-hydroxyvitamin D levels are associated with lower mortality in CKD patients2, and observational studies have noted a survival advantage when dialysis patients are treated with vitamin D receptor agonists (VDRAs)3, 4. VDRAs are currently approved for the treatment of secondary hyperparathyroidism, but their association with improved survival is independent of parathyroid hormone (PTH) levels5, 6, suggesting that other pleiotropic effects of VDRAs are involved. In contrast to its beneficial effects, high dose calcitriol has also been associated with hypercalcemia and VDRAs were associated with vascular calcification (VC) in some animal models7, 8. In vitro data are also conflicting; calcitriol has been shown to increase vascular smooth muscle cell (VSMC) calcification in some studies9, 10 but not others11, 12. Paricalcitol (19-nor-1α,25(OH)2D2) is an analog of calcitriol that causes less hypercalcemia13 and may have a survival benefit over calcitriol14. Data from rodent studies are mixed, but suggest a beneficial effect of VDRAs, especially paricalcitol, on VC7, 8, 12, 15, 16. Despite human and experimental data suggesting benefits with VDRA therapy, the underlying mechanisms remain to be clarified.
Many mechanisms contribute to uremic VC, including systemic calcium/phosphate imbalances, decreased expression of calcification inhibitors, VSMC osteogenic differentiation, and elastin remodeling17. The VSMC phenotype change is particularly striking, and can be triggered by elevated extracellular phosphate18-20. Large observational studies have correlated elevated serum phosphate with increased cardiovascular mortality in end-stage kidney disease (ESKD)21, CKD22 and the general population23. Of note, phosphate loading occurs early in CKD stage 3, as evidenced by increased serum levels of FGF23 which precedes overt hyperphosphatemia24.
The outcome of VDRA therapy is difficult to predict due to the myriad of vasculotropic effects (both anti-calcific and pro-calcific) downstream of vitamin D receptor activation25. This complexity emphasizes the need for in vivo studies to assess the overall consequence of VDRA therapy on VC. In the present study, we evaluated calcitriol and paricalcitol in DBA/2J mice that develop marked arterial medial calcification (AMC) when subjected to CKD and high phosphate diet26, 27. We demonstrate that both VDRAs decreased the extent of VC independently of serum calcium and PTH, and identify underlying beneficial mechanisms that include 1) increased serum klotho, and 2) upregulation of VSMC osteopontin.
RESULTS
VDRA therapy was associated with ~50% less AMC and normalized serum phosphate
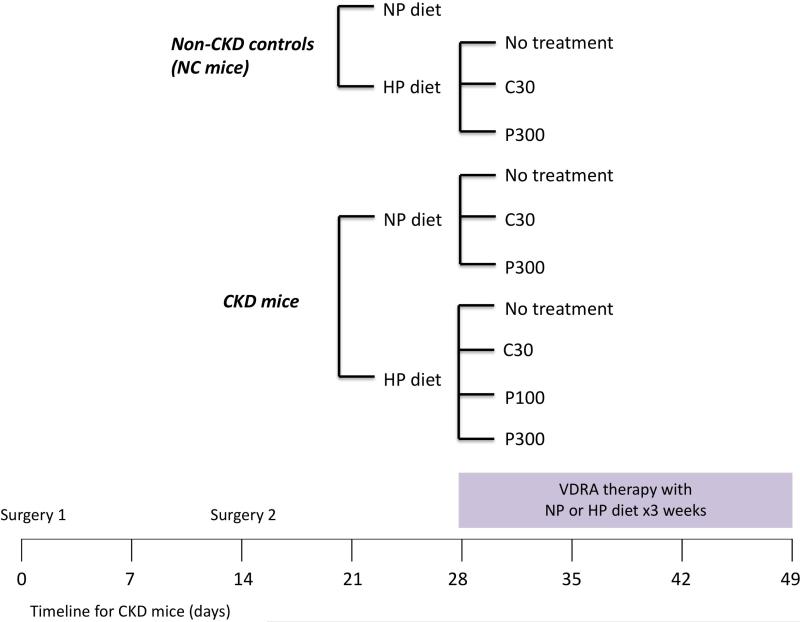
CKD was surgically induced using partial renal ablation; non-CKD (NC) controls were not surgically manipulated. Mice were randomized to receive VDRA therapy i.p. for 3 weeks (see Figure 1 for experimental timeline). The doses tested were calcitriol 30 ng/kg (C30), paricalcitol 100 ng/kg (P100), and paricalcitol 300 ng/kg (P300). C30 and P100 reflect doses used in current clinical practice, and we also tested a higher dose of paricalcitol to look for dosage effect. Diets used were normal 0.5% phosphate (NP) and high 1.5% phosphate (HP) diets.
Figure 1.
Experimental design. CKD was induced by partial renal ablation: the right kidney was exposed, decapsulated, and electrocauterized (surgery 1), followed by left total nephrectomy two weeks later (surgery 2). Non-CKD control (NC) or CKD mice were placed on normal 0.5% phosphate diet (NP) or high 1.5% phosphate diet (HP) for three weeks. Concurrently, mice were given no treatment, calcitriol 30 ng/kg (C30), paricalcitol 100 ng/kg (P100) or paricalcitol 300 ng/kg (P300). The vitamin D receptor agonists (VDRAs) were given via intraperitoneal injections three times a week for three weeks.
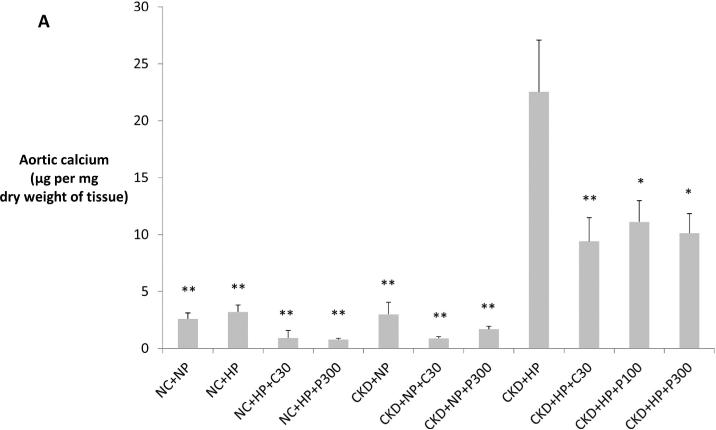
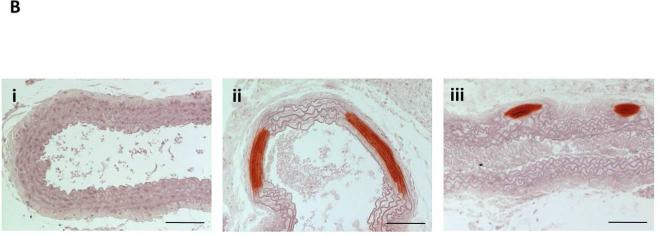
Extent of VC was assessed via aortic arch calcium content in all mice. Aortic calcium content in CKD+HP mice was 8.5-fold higher than in NC+NP mice. Consistent with prior reports26, 27, CKD+NP mice did not develop aortic calcification. CKD+HP mice on calcitriol and paricalcitol developed significantly less AMC and there was no statistical difference between the two VDRAs (Figure 2A). Alizarin Red-S staining of thoracic aorta sections confirmed that calcification was restricted to the medial layer (Figure 2B). H&E staining showed straightening of elastic fibers and no atherosclerotic lesions at areas of calcification; BM8 staining for macrophages confirmed lack of inflammation (data not shown).
Figure 2.
(A) CKD mice on high phosphate diet (CKD+HP) developed vascular calcification that was significantly decreased by VDRA therapy. Aortic arch calcium content expressed as μg calcium normalized to mg dry weight (mean ± s.e.m.). *P<0.01 and **P<0.001 compared to CKD+HP group. Calcification was not different between the NC+NP, NC+HP and CKD+NP subgroups (P=1 for all posthoc Tukey analyses). Aortic calcium content was analyzed from all mice in the study (refer to Table 1 for n per group). (B) Thoracic aorta with Alizarin Red-S stain showing marked medial calcification in CKD+HP animal (ii) compared to NC+NP animal (i), and significantly less calcification in an animal treated with paricalcitol (CKD+HP+P300, iii). Scale bars are 150 μm and objective is 10X.
C30 = calcitriol 30 ng/kg i.p. three times per week × three weeks, HP = high 1.5% phosphate diet, NC = non-CKD control mice, NP = normal 0.5% phosphate diet, P100 = paricalcitol 100 ng/kg, P300 = paricalcitol 300 ng/kg, CKD = chronic kidney disease mice.
Serum parameters for the 11 treatment groups are summarized in Table 1. At the time of randomization, average BUN in CKD mice was 35±4.7 mg/dL versus 28±4.6 mg/dL in non-CKD mice; at termination, average BUN in CKD mice (38.7±6.4 mg/dL) remained significantly higher than in control mice (26.9±5.3 mg/dL; P<0.05). CKD+HP mice developed significant hyperphosphatemia and markedly elevated FGF23 levels. Serum phosphate was corrected to normal levels and FGF23 was significantly lowered with VDRA therapy. In CKD+NP mice, calcitriol significantly raised serum calcium whereas paricalcitol did not. There was a non-significant trend for higher serum calcium in the CKD+HP mice treated with VDRAs. PTH levels were not significantly affected by VDRA therapy in CKD mice, but VDRA therapy significantly raised PTH levels in the NC+HP group. We noted less mortality in the VDRA-treated CKD+HP groups (19/20 mice per group survived until termination of the study, versus 16/20 mice in the CKD+HP group), however our study was not designed for survival analysis.
Table 1.
Serum parameters in the various treatment groups.
| Treatment group | n | BUN (mg/dL) | Ca (mg/dL) | P (mg/dL) | PTH (pg/mL) | FGF23 (pg/mL) | OPN (ng/mL) |
|---|---|---|---|---|---|---|---|
| Non-CKD groups | |||||||
| NC+NP | 9 | 22 ± 6a | 9.9 ± 0.9 | 9.5 ± 2.2 | 249 ± 24 | 203 ± 98 | 173 ± 41 |
| NC+HP | 10 | 29 ± 5a | 9.9 ± 0.6 | 8.3 ± 0.8 | 681±173d | 473 ± 147f | 495 ± 93 |
| NC+HP+C30 | 10 | 26 ± 3a | 8.9 ± 0.6 | 10.3 ± 1.3 | 1699 ± 154d | n.d. | 435 ± 119 |
| NC+HP+P300 | 9 | 30 ± 4a | 9.3 ± 0.6 | 9.6 ± 1.6 | 1253 ± 214d | n.d. | 441 ± 120 |
|
CKD groups | |||||||
| CKD+NP | 10 | 40 ± 8 | 10 ± 1.5 | 10.3 ± 1.1 | 451 ± 81 | 229 ± 108 | 185 ± 84 |
| CKD+NP+C30 | 10 | 34 ± 5 | 11.9 ± 1.4b | 9.8 ± 0.8 | 726 ± 188 | n.d. | 367 ± 79 |
| CKD+NP+P300 | 10 | 45 ± 5 | 10.1 ± 0.6 | 10.6 ± 1 | 457 ± 145 | n.d. | 219 ± 64 |
| CKD+HP | 16 | 41 ± 6 | 9.1 ± 1.6 | 12.2 ± 1.4 | 1822 ± 168e | 1176 ± 368 | 746 ± 196 |
| CKD+HP+C30 | 19 | 36 ± 5 | 10.4 ± 0.6 | 9.1 ± 0.7c | 1728 ± 127e | 386 ± 168g | 610 ± 108 |
| CKD+HP+P100 | 19 | 34 ± 3 | 10.2 ± 0.8 | 8.3 ± 1.2c | 1684 ± 262e | n.d. | 359 ± 67h |
| CKD+HP+P300 | 19 | 40 ± 5 | 9.8 ± 0.8 | 9 ± 0.7c | 1701 ± 113e | 336 ± 124g | 436 ± 93h |
Non-CKD control (NC) or CKD mice were placed on normal or high phosphate diet for three weeks, and given no treatment, calcitriol 30 ng/kg (C30), paricalcitol 100 ng/kg (P100) or paricalcitol 300 ng/kg (P300). Each drug was given intraperitoneally three times a week. All parameters were measured at time of termination except for PTH which was measured within 24 hours following the penultimate VDRA injection. For BUN and OPN, 1=10 per group except for NC+NP and NC+HP+P300 groups where n=9. For serum Ca, n=8 per group except for NC+NP, NC+HP, NC+HP+C30, CKD+NP+C30 and CKD+NP+P300 groups where n=5. For serum P, n=8 per group; for intact PTH, n=6 per group. For FGF23, n=9 except for NC+NP group where n=8. Data are mean ± s.d.
Abbreviations: BUN = blood urea nitrogen, Ca = calcium, n = number of mice in each treatment group, FGF23 = fibroblast growth factor 23, n.d. = not determined due to insufficient serum, OPN = osteopontin, P = phosphate, PTH = parathyroid hormone.
The non-CKD control groups had significantly lower BUN compared with the CKD+HP group (P<0.001).
Calcitriol significantly raised serum calcium in normal phosphate-fed CKD mice (P<0.05 versus CKD+NP group). While there was a trend for increased serum calcium in the high phosphate-fed CKD mice treated with calcitriol and paricalcitol, the differences were not statistically significant compared to the CKD+HP group.
Calcitriol and paricalcitol lowered serum phosphate in CKD, high phosphate-fed mice (P<0.001 versus CKD+HP group).
PTH levels were significantly higher when control mice were placed on the high phosphate diet (P=0.001 compared to NC+NP group); there was a further significant rise in PTH with C30 and P300 treatment (P<0.001 compared to NC+HP group).
PTH levels in high phosphate-fed CKD mice were not significantly affected by VDRA therapy (P value not significant compared to CKD+HP group). Similarly, PTH levels were not significantly different among the CKD+NP groups.
FGF23 levels were significantly increased in high phosphate-fed control mice (P<0.05 compared to NC+NP group).
FGF23 levels were decreased with VDRA therapy (P<0.001 compared to CKD+HP group).
OPN levels were significantly lower in paricalcitol-treated groups (P<0.001 versus CKD+HP group). OPN was also decreased in the CKD+HP+C30 group but P value was not significant.
VDRA effects on AMC were independent of serum PTH levels
To determine whether development of tertiary hyperparathyroidism might explain the lack of serum PTH lowering by VDRA therapy, a separate cohort of CKD mice (n=8) were placed on the HP diet for 18.5 days and then switched to the NP diet for 3 weeks. The PTH levels in these mice fell from 1349±612 pg/mL to 406±346 pg/mL and were equivalent to levels in the original CKD+NP group, thus ruling out tertiary hyperparathyroidism. Alternatively, we considered that the very high (1.5%) phosphate diet used in the present studies might have blunted the ability of VDRA to reduce PTH levels. The influence of dietary phosphate content was examined using a lower (but still above normal) 0.9% phosphate diet that was previously shown to induce VC in CKD mice26. CKD mice fed the 0.9% phosphate diet and treated with the P300 dose showed lowering of serum PTH to 184±211 pg/mL (n=5) compared to 608±285 pg/mL in the untreated group (n=3) (P=0.05). Taken together, these data suggest that the 1.5% phosphate diet drove PTH secretion even in the presence of pharmacological VDRA doses, allowing us to uncover PTH-independent VDRA inhibitory effects against VC.
Serum and urine klotho, and tubular phosphate excretion, were increased in CKD+HP mice treated with VDRA
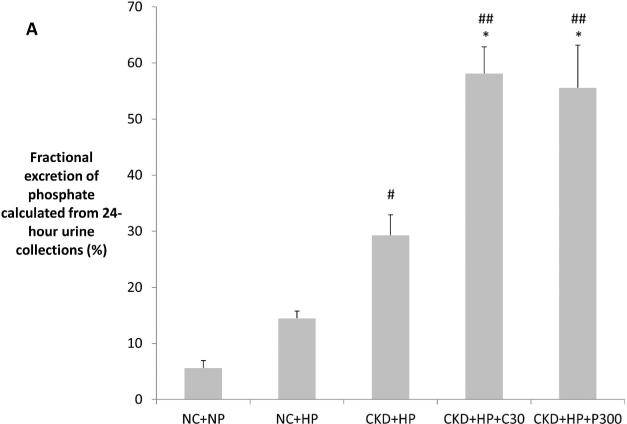
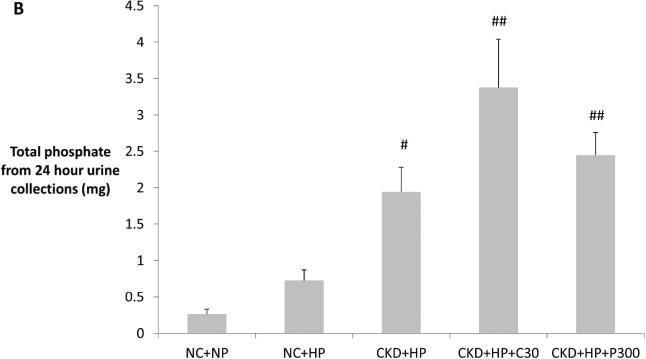
Fractional excretion of phosphate (FEphos) was significantly higher in VDRA-treated CKD+HP mice, compared to NC+NP and CKD+HP mice (Figure 3A). Furthermore, 24-hour phosphate excretion mirrored the changes in FEphos (Figure 3B). Since PTH levels were not significantly changed by VDRA therapy and could not account for the increased tubular phosphate excretion and correction of hyperphosphatemia, the FGF23/klotho axis was examined. FGF23 levels in CKD+HP mice were ~5-fold higher than in NC+NP mice, and were significantly lowered by VDRA therapy (Table 1). This FGF23 drop was likely in response to normalization of serum phosphate levels, since FGF23 levels were highly correlated with serum phosphate levels in this study (R=0.58; P<0.001).
Figure 3.
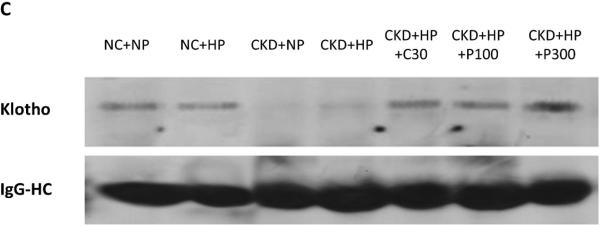
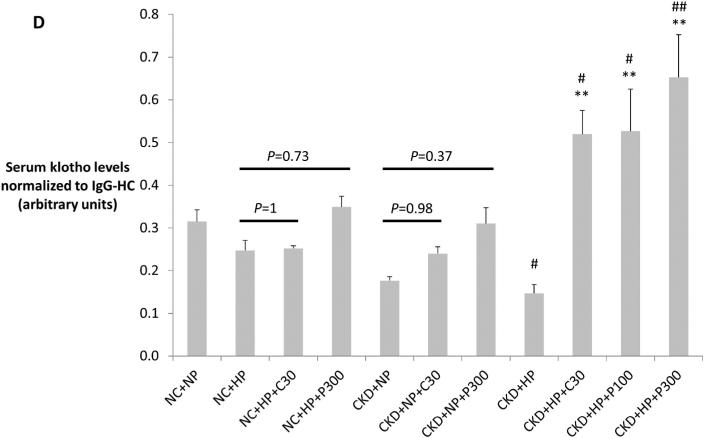
(A) Correction of hyperphosphatemia correlated with increased fractional excretion of phosphate in VDRA-treated CKD+HP animals (FEphos calculated from 24-hour urine collections expressed as mean percentage ± s.e.m., n=6 for NC+NP and NC+HP groups, n=4 for CKD+HP group, n=5 for CKD+HP+C30 and CKD+HP+P300 groups). (B) Total urinary phosphate from 24-hour urine collections was significantly increased in CKD+HP animals compared to the NC+NP group. There was a trend for increased total phosphate excretion in VDRA-treated CKD+HP mice (P=0.06 and P=0.9 for CKD+HP+C30 and CKD+HP+P300 groups respectively, compared to CKD+HP animals). (C) Representative blot of serum klotho protein in individual mice from select groups (upper panel, 130 kDa band). Same blot was stripped and reprobed for immunoglobulin G heavy chain (IgG-HC) as loading control (lower panel). (D) Serum klotho levels were decreased in CKD, and were increased by VDRA therapy in high phosphate-fed CKD mice to levels that were significantly higher than in control mice. VDRAs did not significantly raise serum klotho in NC+HP and CKD+NP groups (posthoc Tukey P values shown on chart). Levels expressed as arbitrary units normalized to IgG-HC using densitometric analyses (mean ± s.e.m.), n=5 for NC+NP group, n=6 for NC+HP, CKD+NP and CKD+HP groups, n=3 in remaining groups.
*P<0.01 and **P<0.001 compared to CKD+HP group, #P<0.05 and ##P<0.001 compared to NC+NP group.
Serum levels of klotho, a cofactor for FGF23, were then examined using immunoprecipitation-immunoblot. Figures 3C-D demonstrate that serum klotho levels were depressed in CKD. In striking contrast to serum FGF23 levels, calcitriol and paricalcitol both markedly increased serum klotho in CKD+HP mice (130 kDa band), and these levels were significantly higher even when compared to non-CKD controls. Interestingly, co-existence of CKD and phosphate loading was required for VDRA upregulation of serum klotho; VDRA therapy per se did not significantly increase klotho levels in NC+HP or CKD+NP mice (Figure 3D). In addition, immunoblot detected a trend for increased urine klotho in VDRA-treated CKD+HP mice compared to untreated CKD+HP animals (Supplementary Figure S1). Urinary klotho concentrations did not correlate with proteinuria; moreover, average proteinuria was the same in the control and CKD groups (4.4 mg/day).
Elevated serum and urine klotho were not explained by increased renal or parathyroid gland klotho protein levels following VDRA treatment
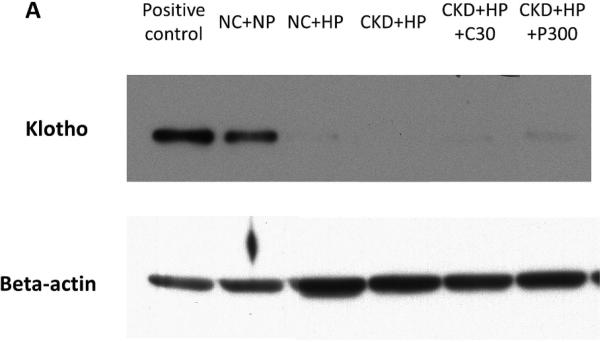
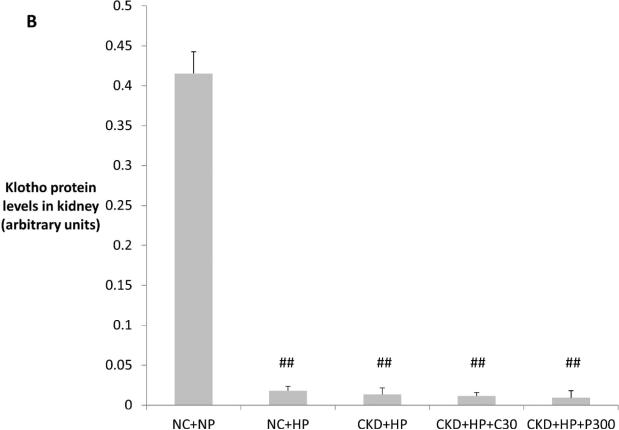
In an attempt to identify the source of klotho upregulation by VDRAs, we first examined the kidney (the major site of klotho synthesis under healthy conditions28, 29). Immunoblot of kidney lysates is shown in Figure 4A, with corresponding densitometric analysis graphed in Figure 4B. Klotho protein levels were depressed with high phosphate feeding alone (NC+HP mice), consistent with a prior report whereby high phosphate feeding was associated with decreased klotho expression and ectopic calcifications in the kidneys of healthy mice30. Klotho protein levels were low in CKD mice (decreased by 30-45x compared to NC+NP mice) and remained low following VDRA therapy, which was also evident on kidney immunostaining (Figure 4C). Quantitative RT-PCR showed ~50% decrease in kidney klotho mRNA levels in CKD mice regardless of VDRA treatment (data not shown).
Figure 4.
(A) Representative Western blot showing klotho protein (130 kDa band) from whole kidney lysates (upper panel). Same blot was stripped and reprobed for beta-actin as loading control (lower panel). (B) Klotho protein in the kidney was significantly decreased by high phosphate diet (in both non-CKD control and CKD mice, ##P<0.001 compared to NC+NP group). VDRA treatment did not increase expression of kidney klotho in CKD mice. Levels expressed as arbitrary units normalized to beta-actin using densitometric analyses (mean ± s.e.m., n=3 for all groups). (C) Decreased klotho immunostaining in kidneys from NC+HP and CKD mice; i) NC+NP animal, ii) NC+HP animal, iii) CKD+HP animal, iv) CKD+HP+P300 animal. Scale bars are 50 μm and objective is 20X.
Klotho expression in parathyroid glands was next examined by immunostaining of neck tissues that had been dissected out en bloc (Supplementary Figure S2A). Analysis of fractional area with positive staining showed equivalent parathyroid gland klotho expression in VDRA-treated versus untreated CKD+HP mice (Supplementary Figure S2B). To determine whether degree of parathyroid gland hyperplasia might contribute to increased serum klotho, serial sectioning and three-dimensional reconstruction was performed31. We found no difference in parathyroid gland volumes following VDRA treatment (Supplementary Figure S2C-D). Thus, elevated serum klotho levels could not be explained by parathyroid hyperplasia in response to VDRA treatment.
Similarly, there was no klotho upregulation in other tissues surveyed. Klotho expression in human aortas was recently reported32, but klotho was not detected in aortas from healthy or CKD mice by RNA or protein analyses (Supplementary Figures S3A-B). Finally, we examined archival tissue from CKD mice that had been placed on 0.9% phosphate diet and treated with VDRA. No upregulation of klotho expression was observed by immunoblot of brain, heart, lung and liver lysates (Supplementary Figure S3C), suggesting that increased steady state expression in these tissues does not contribute to elevated serum klotho in VDRA-treated mice. The current data cannot rule out simultaneous increased expression and shedding as a mechanism of increasing circulating Klotho.
VDRA therapy increased VSMC osteopontin (OPN) expression in vivo and in vitro
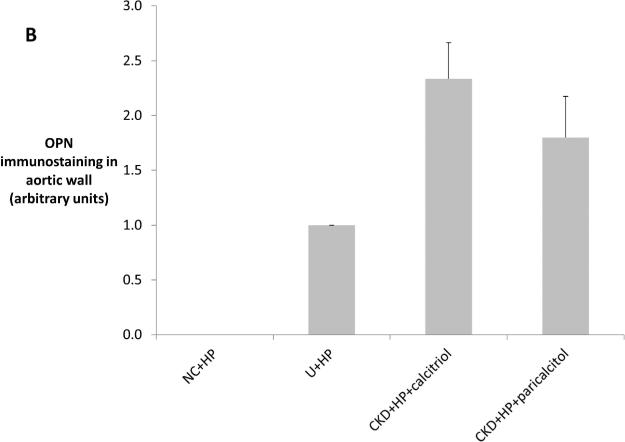
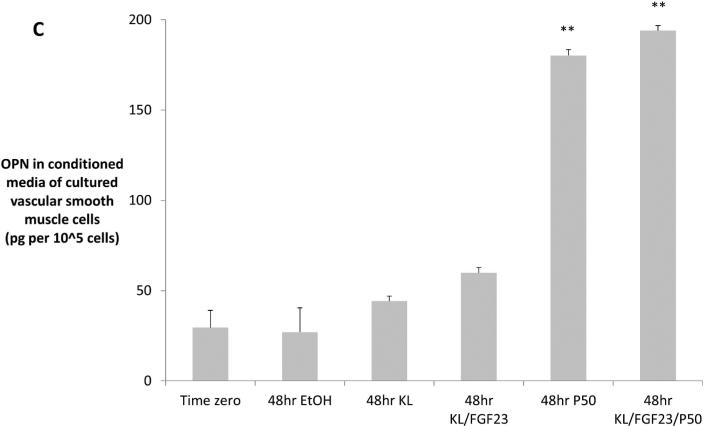
In contrast to serum OPN, which decreased in parallel with decreased VC (Table 1), aorta immunostaining showed increased VSMC cytoplasmic expression of OPN in the VDRA-treated CKD+HP mice (Figures 5A-B). Consistent with previous findings26, no OPN staining was observed in aortas from non-CKD mice (data not shown). As serum klotho was elevated in VDRA-treated CKD+HP mice, the question was raised whether OPN upregulation was mediated by VDRA or by klotho. This was tested in vitro by treating mouse VSMCs with 2 ng/mL klotho (with/without FGF23) or 50 nM paricalcitol. Paricalcitol significantly increased OPN levels in the conditioned media after 48 hours while klotho with/without FGF23 had no significant effect (Figure 5C). OPN mRNA levels were unchanged (data not shown). We further evaluated other major regulators of VSMC calcification including matrix gla protein and the sodium-phosphate cotransporters PiT-1 and PiT-2, and VDRA therapy did not change expression of any of these genes (Supplementary Figure S4).
Figure 5.
(A) Arterial medial osteopontin (OPN) levels were increased by VDRA treatment. (i) OPN expression was low but detectable in the aortic media of CKD mice fed a high phosphate diet (CKD+HP). VDRA treatment increased smooth muscle cell expression of OPN in the aortic media in (ii) CKD+HP+C30 animal; and (iii) CKD+HP+P300 animal. Arrows point to aortic medial cells expressing OPN. Scale bars are 30 μm and objective is 40X. (B) Quantitation of OPN immunostaining showed no OPN expression in aortas from non-CKD controls, weak staining in CKD high phosphate-fed mice, and increased levels in VDRA-treated CKD mice (mean ± s.e.m., n=3 for all except CKD+HP+paricalcitol, n=5 where P100 and P300 samples were grouped). (C) Treatment of cultured VSMCs with 50 nM paricalcitol increased OPN levels in the media (significantly higher levels by ELISA at 48hr compared to time zero, **P<0.001). Klotho (2 ng/mL) with/without FGF23 (2 ng/mL) did not upregulate OPN secretion. Three wells were sampled per time-point per treatment group, data are mean ± s.e.m. EtOH = ethanol control, KL = klotho, P50 = paricalcitol 50 nM.
VDRA therapy did not affect elastin remodeling in CKD mice
Elastin degradation is prominent in our mouse CKD model, irrespective of dietary phosphate, and precedes overt AMC27. In ESKD, elastin breakdown has been reported alongside upregulation of matrix metalloproteinase-2 (MMP-2)33, and vitamin D deficiency has been associated with higher circulating concentrations of MMP-934. Examination of elastin integrity by eosin fluorescence showed prominent elastin degradation in the aortas from all CKD groups (30-50 lamellae breaks per cross-sectional area versus 4 lamellae breaks in the NC+NP group). VDRA treatment did not decrease the extent of elastin breaks. There was also no significant difference between CKD groups in terms of aortic arch desmosine content (data not shown), indicating no difference in amount of functional elastin. Finally, immunostaining showed equivalent levels of elastolytic MMP-2 across CKD groups (data not shown). Taken together, these data suggest that the improvement in AMC following VDRA treatment was not due to changes in elastin remodeling.
DISCUSSION
We describe a mouse CKD model that, when challenged with a high phosphate diet, develops robust AMC in conjunction with metabolic derangements that include hyperphosphatemia, elevated serum PTH, FGF23 and OPN, and klotho deficiency. VDRA therapy for three weeks with either calcitriol or paricalcitol resulted in significantly less aortic calcification, and this effect was independent of changes in serum PTH and calcium levels. The lower extent of AMC was associated with elevated serum klotho levels (significantly higher than in non-CKD controls), increased phosphaturia, and normalized serum phosphate and FGF23 levels. Also, OPN expression in aortic VSMCs was increased by VDRA treatment in vivo and in vitro, in contrast to circulating OPN levels that decreased in conjunction with reduced VC.
High doses of VDRAs stimulate VC, often in association with hypercalcemia12, 15, 16, 35. As in our current study, Mathew et al. noted a protective effect of both calcitriol and paricalcitol against VC when they used lower (more physiologic) dosages15. Other groups have reported differential stimulation of VC by calcitriol but not by paricalcitol in CKD rats12, 16 but their experimental protocols differed in two major aspects: 1) the CKD animals did not develop VC and therefore the studies were not capable of detecting beneficial anti-calcification effects, and 2) the degree of experimental CKD was more severe.
While VDRA therapy was associated with a slight lowering of PTH and a trend for increased serum calcium, these changes were not significant (Table 1). Our data suggest that the high dietary phosphate content (1.5%) used in the present study to achieve more rapid onset of AMC in mice with mild CKD, compared to the 0.9% phosphate12, 26, 36 and 1.2% phosphate8, 16, 37 diets used for longer time periods in prior studies, drove PTH secretion despite VDRA supplementation. Indeed, CKD mice on a 0.9% phosphate diet showed the expected lowering of PTH levels when treated with VDRA. Dietary phosphate influence was also evident in the NC+HP group, where VDRA therapy was associated with increased PTH levels. A possible explanation is that VDRAs increased intestinal phosphate uptake, leading to induction of PTH secretion as a mechanism to maintain phosphate homeostasis. The increased 24-hour total urinary phosphate in VDRA-treated CKD+HP mice (Figure 3B) is consistent with increased intestinal phosphate uptake, especially with calcitriol therapy (P=0.06 between CKD+HP+C30 and CKD+HP groups). Overall, our study provided a unique opportunity to examine the beneficial vascular effects of VDRAs independent of changes in PTH and calcium.
CKD is a state of klotho deficiency38, 39, and restoration of circulating klotho is an attractive therapeutic target. There has been accumulating evidence that soluble klotho can mediate phosphaturia independent of FGF23. Soluble klotho in the absence of FGF23 inhibits NaPi cotransporters in cultured OK cells and in cell-free membrane vesicles.40 Also, intravenous administration of klotho leads to decreased renal expression of NaPi-2a and hypophosphatemia, even in FGF23-null mice.40 On the other hand, transmembrane klotho is the co-receptor for renal FGF23 signaling which results in phosphaturia via downregulation of NaPi-2a and -2c in the proximal tubule41. The ectodomain of klotho has been shown to bind to exogenously expressed FGF receptors (FGFRs), suggesting that soluble klotho may be able to mediate formation of the FGF23-FGFR-klotho complex.42, 43 The potential role of soluble klotho in FGF23 signaling in vivo remains unknown at this time, but appears to be a less plausible mechanism for phosphaturia since in vitro assays have shown that the affinity of FGFRs for the klotho ectodomain is log-fold lower than their affinity for full-length transmembrane klotho.42
Hyperphosphatemia can perpetuate VC via several pathways44 and correction of this metabolic derangement has been shown to impede the development of VC in clinical trials45, 46. Indeed, transgenic mice that overexpress klotho, when subjected to CKD, showed increased phosphaturia and less VC39. Klotho was also recently shown to have direct anti-calcification effects at the vascular wall, via inhibition of sodium-dependent phosphate uptake and VSMC osteoblastic transformation39.
The VDRA-associated increased serum klotho was modulated by phosphate excess (Figure 3D). A striking and significant increase in serum klotho was evident only in the setting of both CKD and dietary phosphate loading. Interestingly, a phosphate modulatory effect was previously described with respect to vitamin D effects on gene expression in cultured human VSMCs47.
Serum klotho is thought to arise from shedding of membrane-bound klotho from tissues where it is normally expressed, and the major site of klotho synthesis is the kidney28, 29. Calcitriol upregulates klotho in the kidneys of healthy mice48, and functional vitamin D responsive elements have been located upstream of both the human and mouse klotho genes49. VDRAs have also been shown to upregulate klotho in cultured human and mouse kidney-derived cell lines50. Thus, it was surprising that our study found persistently low klotho mRNA and protein levels from the remnant kidneys of VDRA-treated CKD mice (Figure 4), suggesting that that the kidney was not the source of serum klotho. Furthermore, while klotho was easily detected in parathyroid glands by immunostaining, no difference was detected in CKD+HP mice following VDRA treatment (Supplementary Figure S2). We have not ruled out inhibition of klotho degradation, or the possibility that accelerated shedding of klotho into serum and urine accounted for the increased levels. Recent studies have identified the proteases involved in klotho shedding51, 52 although the in vivo significance of the various shed/secreted isoforms remains unknown. Additional studies are needed to determine the mechanisms underlying increased klotho in the setting of CKD and VDRA therapy.
Serum FGF23 levels fell significantly in the VDRA-treated CKD+HP mice, and it is likely that production of FGF23 was downregulated in parallel with correction of hyperphosphatemia. FGF23 strongly correlated with serum phosphate levels in the current studies (R=0.58; P<0.001). Although VDRAs have been shown to dramatically increase FGF23 expression from bone in healthy53 and CKD mice54, studies in vitamin D receptor null (VDR-/-) mice demonstrated that phosphate can upregulate FGF23 expression independent of vitamin D55. Lowering of FGF23 may confer cardiovascular benefits, since FGF23 has been shown to induce left ventricular hypertrophy independent of klotho56. Interestingly, heterogeneity in the response of FGF23 levels to calcitriol treatment was recently reported in a cohort of CKD patients; additionally, the study noted a significant correlation between change in serum phosphate levels and change in FGF2357.
Upregulation of OPN in aortic VSMCs was the other major finding of this study. OPN is a potent local inhibitor of VC58 and has been detected in calcified medial wall deposits from CKD patients59. Wu-Wong et al. previously reported that OPN mRNA levels in human coronary VSMCs were upregulated after treatment with 100 nM paricalcitol x6 days47. We noted upregulation of secreted OPN protein from mouse VSMCs after 48 hours of culture with 50 nM paricalcitol. Klotho with/without FGF23 did not upregulate OPN expression in vitro, suggesting that the increased OPN expression observed in aortic VSMCs was stimulated by VDRA treatment and not by klotho. Recently, increased aortic wall expression of OPN was reported in CKD rats treated with a supra-therapeutic dose of calcitriol60. Whether this upregulation of OPN signifies an overall osteogenic transformation of VSMCs that, while deterring mineral deposition, may be maladaptive in terms of vascular wall contractility, remains unclear.
In summary, calcitriol and paricalcitol decreased phosphate-induced AMC in CKD mice. We describe novel mechanisms, including increased serum klotho levels and upregulation of vascular wall OPN, that could contribute to the beneficial anti-calcification effects of these VDRAs. Further studies are needed to determine whether these findings are clinically relevant in terms of cardiovascular end-points.
METHODS
Animal Studies
Female DBA/2J mice aged 8-10 weeks were purchased from Jackson Laboratory (Bar Harbor, ME). Diets were normal phosphate (NP) diet containing 0.5% phosphate or high phosphate (HP) diet containing 1.5% phosphate (Dyets, Bethlehem, PA). Mice underwent partial renal ablation as previously described26, while non-CKD control (NC) mice were not surgically manipulated. HP diet and VDRA treatment (intraperitoneal injections 3x/week for 3 weeks) were started 2 weeks after renal ablation. Calcitriol (Sigma-Aldrich, St. Louis, MO) and paricalcitol from Abbott (Abbott Park, IL) were dissolved in 100% ethanol and diluted in 5% ethanol to desired concentrations. Further details are available in Supplementary Information.
Serum Chemistries
Saphenous vein blood-draw was done 4-7 days following surgery 2 to measure blood urea nitrogen (randomization BUN). Interim blood-draw was done within 24 hours after penultimate VDRA dose to assess PTH levels. Terminal blood was collected via cardiac puncture following a 2-4 hours fast. The following assays were used: QuantiChrom™ Urea Assay Kit (BioAssay Systems, Hayward, CA) for BUN; o-cresolphthalein complexone kit from Teco Diagnostics (Anaheim, CA) for calcium; standard bioanalyzer at Phoenix Central Laboratory (Everett, WA) for phosphate; mouse FGF23 C-terminus ELISA kit (Immutopics, San Clemente, CA); DuoSet mouse osteopontin ELISA kit (R&D Systems, Minneapolis, MN); mouse intact PTH enzyme-linked immunosorbent assay kits (ALPCO Diagnostics, Salem, NH and Immutopics). Reference ranges based on levels in NC+NP mice: PTH 213.9-274.8 pg/mL, FGF23 76.3-423.5 pg/mL.
Klotho Immunoblot
Rat anti-human klotho monoclonal antibody (KM2076) was used for klotho Western blot in urine and immunoprecipitation-enriched serum, as well as tissue lysates. Details are available in the Supplementary Information.
Quantitation of Aortic Calcium and Desmosine
Aortic arch segments were lyophilized and decalcified with 0.6N HCl at 37°C for 24 hours. The calcium content of the supernatant was determined with the o-cresolphthalein complexone kit (Teco Diagnostics). Aortic calcium content was normalized to the dry weight of the tissue (μg Ca/mg dry weight). Decalcified aortic arch segments were hydrolyzed in 6N HCl at 100°C for 24 hours and the supernatant analyzed for desmosine content as previously described61.
Metabolic Cage Studies
Mice underwent 24-hour urine collection in individual metabolic cages (Tecniplast). Urine collections coincided with blood collections so as to have corresponding serum data. Serum creatinine was measured using the Quantichrom Creatinine assay kit (BioAssay Systems). Serum phosphate, urine phosphate and urine creatinine were measured by autoanalyzer (Phoenix Central Laboratory). Fractional excretion of phosphate was calculated using FEphos = serum creatinine urine phosphate / urine creatinine serum phosphate. Urinary protein was determined using the Pierce Micro BCA Protein Assay Kit (Thermo Scientific).
Histology and Immunohistochemistry
The following primary antibodies were used for immunostaining: klotho (R&D Systems, AF1819), osteopontin (R&D Systems, AF808), MMP-2 (R&D Systems, AF1488), BM8 (eBioscience, 14-4321). Details are available in Supplementary Information.
Quantitative RT-PCR
Details are available in Supplementary Information.
VSMC Osteopontin Expression
VSMCs from C57BL/6 mice (passage 7) were a gift from Mei Speer. Cells were grown up in Dulbecco's modified Eagle's medium (DMEM; Invitrogen, Carlsbad, CA) containing antibiotics/antimycotic and 10% FBS. At passage 9, VSMCs were seeded 2×10⁴ cells/well in 6-well plates. At confluence, serum concentration was lowered to 1% FBS. After initial 24-hour incubation with 1% FBS (time zero), five treatment groups were initiated: 1) vehicle (EtOH) control because paricalcitol is dissolved in 5% EtOH, 2) klotho 2 ng/mL, 3) klotho and FGF23 each at 2 ng/mL, 4) paricalcitol 50 nM, and 5) klotho+FGF23+paricalcitol. Recombinant mouse FGF23 (2629-FG/CF) and klotho (1819-KL) were purchased from R&D Systems; paricalcitol was provided by Abbott. OPN in the conditioned media was detected using the DuoSet mouse osteopontin ELISA kit (R&D Systems), and normalized to #cells/well (averaged from 3 wells; Beckman Coulter Z1 Particle Counter). RNA was extracted using the RNeasy Mini Kit (Qiagen, Valencia, CA) for quantitative RT-PCR analysis.
Statistical Analysis
SPSS software v16.0 (SPSS, Chicago, IL) was used to compare group means using one-way ANOVA with Tukey post-hoc analysis. Simple linear regression was used to obtain correlation coefficients between two parameters. Significance for all tests was set at P<0.05.
Supplementary Material
Acknowledgments
This study was funded by a grant from Abbott Laboratories and NIH grants to CM Giachelli (R01 HL62329 and R01 HL081785). WL Lau received funding from T32 HL007828 and T32 DK007467. MC Hu was in part supported by the American Heart Association (0865235F), a seed grant from the Charles and Jane Pak Center for Mineral Metabolism and Clinical Research, University of Texas Southwestern Medical Center, and NIH grant R01 DK0092461. OW Moe, M Kuro-o, and MC Hu were in part supported by NIH grant R01 DK091392, the Simmons Family Foundation, and the O'Brien Kidney Research Center (P30 DK-079328). The authors gratefully acknowledge use of the UWEB Optical Microscopy and Image Analysis Shared Resource, funded by the National Science Foundation through grants EEC-9872882 and EEC-9529161. The authors thank Dr. Mohga El-Abbadi and Ms. Danielle F. Peterson for assistance with data collection.
Footnotes
DISCLOSURES
This study was funded in part by a grant from Abbott Laboratories.
Contributor Information
Wei Ling Lau, Department of Nephrology, University of Washington, Seattle, Washington.
Elizabeth M. Leaf, Department of Bioengineering, University of Washington, Seattle, Washington.
Ming Chang Hu, Charles and Jane Pak Center for Mineral Metabolism and Clinical Research and Departments of Internal Medicine and Pediatrics, University of Texas Southwestern Medical Center, Dallas, Texas.
Marc M. Takeno, Department of Bioengineering, University of Washington, Seattle, Washington.
Makoto Kuro-o, Charles and Jane Pak Center for Mineral Metabolism and Clinical Research and Department of Pathology, University of Texas Southwestern Medical Center, Dallas, Texas.
Orson W. Moe, Charles and Jane Pak Center for Mineral Metabolism and Clinical Research and Departments of Internal Medicine and Physiology, University of Texas Southwestern Medical Center, Dallas, Texas
Cecilia M. Giachelli, Department of Bioengineering, University of Washington, Seattle, Washington.
REFERENCES
- 1.Go AS, Chertow GM, Fan D, et al. Chronic kidney disease and the risks of death, cardiovascular events, and hospitalization. N Engl J Med. 2004;351:1296–1305. doi: 10.1056/NEJMoa041031. [DOI] [PubMed] [Google Scholar]
- 2.Pilz S, Iodice S, Zittermann A, et al. Vitamin D Status and Mortality Risk in CKD: A Meta-analysis of Prospective Studies. Am J Kidney Dis. 2011 doi: 10.1053/j.ajkd.2011.03.020. [DOI] [PubMed] [Google Scholar]
- 3.Tentori F, Hunt WC, Stidley CA, et al. Mortality risk among hemodialysis patients receiving different vitamin D analogs. Kidney Int. 2006;70:1858–1865. doi: 10.1038/sj.ki.5001868. [DOI] [PubMed] [Google Scholar]
- 4.Teng M, Wolf M, Ofsthun MN, et al. Activated injectable vitamin D and hemodialysis survival: a historical cohort study. J Am Soc Nephrol. 2005;16:1115–1125. doi: 10.1681/ASN.2004070573. [DOI] [PubMed] [Google Scholar]
- 5.Shoben AB, Rudser KD, de Boer IH, et al. Association of oral calcitriol with improved survival in nondialyzed CKD. J Am Soc Nephrol. 2008;19:1613–1619. doi: 10.1681/ASN.2007111164. [DOI] [PMC free article] [PubMed] [Google Scholar]
- 6.Naves-Díaz M, Alvarez-Hernández D, Passlick-Deetjen J, et al. Oral active vitamin D is associated with improved survival in hemodialysis patients. Kidney Int. 2008;74:1070–1078. doi: 10.1038/ki.2008.343. [DOI] [PubMed] [Google Scholar]
- 7.Becker LE, Koleganova N, Piecha G, et al. Effect of paricalcitol and calcitriol on aortic wall remodeling in uninephrectomized ApoE knockout mice. Am J Physiol Renal Physiol. 2011;300:F772–782. doi: 10.1152/ajprenal.00042.2010. [DOI] [PubMed] [Google Scholar]
- 8.Lopez I, Mendoza FJ, Aguilera-Tejero E, et al. The effect of calcitriol, paricalcitol, and a calcimimetic on extraosseous calcifications in uremic rats. Kidney Int. 2008;73:300–307. doi: 10.1038/sj.ki.5002675. [DOI] [PubMed] [Google Scholar]
- 9.Cardús A, Panizo S, Parisi E, et al. Differential effects of vitamin D analogs on vascular calcification. J Bone Miner Res. 2007;22:860–866. doi: 10.1359/jbmr.070305. [DOI] [PubMed] [Google Scholar]
- 10.Jono S, Nishizawa Y, Shioi A, et al. 1,25-Dihydroxyvitamin D3 increases in vitro vascular calcification by modulating secretion of endogenous parathyroid hormone-related peptide. Circulation. 1998;98:1302–1306. doi: 10.1161/01.cir.98.13.1302. [DOI] [PubMed] [Google Scholar]
- 11.Li X, Speer MY, Yang H, et al. Vitamin D receptor activators induce an anticalcific paracrine program in macrophages: requirement of osteopontin. Arterioscler Thromb Vasc Biol. 2010;30:321–326. doi: 10.1161/ATVBAHA.109.196576. [DOI] [PMC free article] [PubMed] [Google Scholar]
- 12.Wu-Wong JR, Noonan W, Ma J, et al. Role of phosphorus and vitamin D analogs in the pathogenesis of vascular calcification. J Pharmacol Exp Ther. 2006;318:90–98. doi: 10.1124/jpet.106.101261. [DOI] [PubMed] [Google Scholar]
- 13.Brown AJ, Finch J, Slatopolsky E. Differential effects of 19-nor-1,25-dihydroxyvitamin D(2) and 1,25-dihydroxyvitamin D(3) on intestinal calcium and phosphate transport. J Lab Clin Med. 2002;139:279–284. doi: 10.1067/mlc.2002.122819. [DOI] [PubMed] [Google Scholar]
- 14.Teng M, Wolf M, Lowrie E, et al. Survival of patients undergoing hemodialysis with paricalcitol or calcitriol therapy. N Engl J Med. 2003;349:446–456. doi: 10.1056/NEJMoa022536. [DOI] [PubMed] [Google Scholar]
- 15.Mathew S, Lund RJ, Chaudhary LR, et al. Vitamin D receptor activators can protect against vascular calcification. J Am Soc Nephrol. 2008;19:1509–1519. doi: 10.1681/ASN.2007080902. [DOI] [PMC free article] [PubMed] [Google Scholar]
- 16.Mizobuchi M, Finch JL, Martin DR, et al. Differential effects of vitamin D receptor activators on vascular calcification in uremic rats. Kidney Int. 2007;72:709–715. doi: 10.1038/sj.ki.5002406. [DOI] [PubMed] [Google Scholar]
- 17.Giachelli CM. The emerging role of phosphate in vascular calcification. Kidney Int. 2009;75:890–897. doi: 10.1038/ki.2008.644. [DOI] [PMC free article] [PubMed] [Google Scholar]
- 18.Jono S, McKee M, Murry C, et al. Phosphate regulation of vascular smooth muscle cell calcification. Circ Res. 2000;87:E10–17. doi: 10.1161/01.res.87.7.e10. [DOI] [PubMed] [Google Scholar]
- 19.Steitz S, Speer M, Curinga G, et al. Smooth muscle cell phenotypic transition associated with calcification: upregulation of Cbfa1 and downregulation of smooth muscle lineage markers. Circ Res. 2001;89:1147–1154. doi: 10.1161/hh2401.101070. [DOI] [PubMed] [Google Scholar]
- 20.Reynolds J, Joannides A, Skepper J, et al. Human vascular smooth muscle cells undergo vesicle-mediated calcification in response to changes in extracellular calcium and phosphate concentrations: a potential mechanism for accelerated vascular calcification in ESRD. J Am Soc Nephrol. 2004;15:2857–2867. doi: 10.1097/01.ASN.0000141960.01035.28. [DOI] [PubMed] [Google Scholar]
- 21.Block G, Hulbert-Shearon T, Levin N, et al. Association of serum phosphorus and calcium × phosphate product with mortality risk in chronic hemodialysis patients: a national study. Am J Kidney Dis. 1998;31:607–617. doi: 10.1053/ajkd.1998.v31.pm9531176. [DOI] [PubMed] [Google Scholar]
- 22.Kestenbaum B, Sampson J, Rudser K, et al. Serum phosphate levels and mortality risk among people with chronic kidney disease. J Am Soc Nephrol. 2005;16:520–528. doi: 10.1681/ASN.2004070602. [DOI] [PubMed] [Google Scholar]
- 23.Dhingra R, Sullivan L, Fox C, et al. Relations of serum phosphorus and calcium levels to the incidence of cardiovascular disease in the community. Arch Intern Med. 2007;167:879–885. doi: 10.1001/archinte.167.9.879. [DOI] [PubMed] [Google Scholar]
- 24.Isakova T, Wahl P, Vargas GS, et al. Fibroblast growth factor 23 is elevated before parathyroid hormone and phosphate in chronic kidney disease. Kidney Int. 2011;79:1370–1378. doi: 10.1038/ki.2011.47. [DOI] [PMC free article] [PubMed] [Google Scholar]
- 25.Towler DA. Calciotropic hormones and arterial physiology: “D”-lightful insights. J Am Soc Nephrol. 2007;18:369–373. doi: 10.1681/ASN.2006121367. [DOI] [PubMed] [Google Scholar]
- 26.El-Abbadi MM, Pai AS, Leaf EM, et al. Phosphate feeding induces arterial medial calcification in uremic mice: role of serum phosphorus, fibroblast growth factor-23, and osteopontin. Kidney Int. 2009;75:1297–1307. doi: 10.1038/ki.2009.83. [DOI] [PMC free article] [PubMed] [Google Scholar]
- 27.Pai A, Leaf EM, El-Abbadi M, et al. Elastin degradation and vascular smooth muscle cell phenotype change precede cell loss and arterial medial calcification in a uremic mouse model of chronic kidney disease. Am J Pathol. 2011;178:764–773. doi: 10.1016/j.ajpath.2010.10.006. [DOI] [PMC free article] [PubMed] [Google Scholar]
- 28.Kuro-o M, Matsumura Y, Aizawa H, et al. Mutation of the mouse klotho gene leads to a syndrome resembling ageing. Nature. 1997;390:45–51. doi: 10.1038/36285. [DOI] [PubMed] [Google Scholar]
- 29.Li SA, Watanabe M, Yamada H, et al. Immunohistochemical localization of Klotho protein in brain, kidney, and reproductive organs of mice. Cell Struct Funct. 2004;29:91–99. doi: 10.1247/csf.29.91. [DOI] [PubMed] [Google Scholar]
- 30.Morishita K, Shirai A, Kubota M, et al. The progression of aging in klotho mutant mice can be modified by dietary phosphorus and zinc. J Nutr. 2001;131:3182–3188. doi: 10.1093/jn/131.12.3182. [DOI] [PubMed] [Google Scholar]
- 31.Ewald AJ, McBride H, Reddington M, et al. Surface imaging microscopy, an automated method for visualizing whole embryo samples in three dimensions at high resolution. Dev Dyn. 2002;225:369–375. doi: 10.1002/dvdy.10169. [DOI] [PubMed] [Google Scholar]
- 32.Lim K, Lu TS, Molostvov G, et al. Vascular Klotho Deficiency Potentiates the Development of Human Artery Calcification and Mediates Resistance to FGF-23. Circulation. 2012 doi: 10.1161/CIRCULATIONAHA.111.053405. [DOI] [PubMed] [Google Scholar]
- 33.Chung AW, Yang HH, Kim JM, et al. Upregulation of matrix metalloproteinase-2 in the arterial vasculature contributes to stiffening and vasomotor dysfunction in patients with chronic kidney disease. Circulation. 2009;120:792–801. doi: 10.1161/CIRCULATIONAHA.109.862565. [DOI] [PubMed] [Google Scholar]
- 34.Wasse H, Cardarelli F, De Staercke C, et al. 25-hydroxyvitamin D concentration is inversely associated with serum MMP-9 in a cross-sectional study of African American ESRD patients. BMC Nephrol. 2011;12:24. doi: 10.1186/1471-2369-12-24. [DOI] [PMC free article] [PubMed] [Google Scholar]
- 35.Price PA, Faus SA, Williamson MK. Warfarin-induced artery calcification is accelerated by growth and vitamin D. Arterioscler Thromb Vasc Biol. 2000;20:317–327. doi: 10.1161/01.atv.20.2.317. [DOI] [PubMed] [Google Scholar]
- 36.Slatopolsky E, Cozzolino M, Lu Y, et al. Efficacy of 19-Nor-1,25-(OH)2D2 in the prevention and treatment of hyperparathyroid bone disease in experimental uremia. Kidney Int. 2003;63:2020–2027. doi: 10.1046/j.1523-1755.2003.00029.x. [DOI] [PubMed] [Google Scholar]
- 37.Finch JL, Tokumoto M, Nakamura H, et al. Effect of paricalcitol and cinacalcet on serum phosphate, FGF-23, and bone in rats with chronic kidney disease. Am J Physiol Renal Physiol. 2010;298:F1315–1322. doi: 10.1152/ajprenal.00552.2009. [DOI] [PMC free article] [PubMed] [Google Scholar]
- 38.Koh N, Fujimori T, Nishiguchi S, et al. Severely reduced production of klotho in human chronic renal failure kidney. Biochem Biophys Res Commun. 2001;280:1015–1020. doi: 10.1006/bbrc.2000.4226. [DOI] [PubMed] [Google Scholar]
- 39.Hu MC, Shi M, Zhang J, et al. Klotho deficiency causes vascular calcification in chronic kidney disease. J Am Soc Nephrol. 2011;22:124–136. doi: 10.1681/ASN.2009121311. [DOI] [PMC free article] [PubMed] [Google Scholar]
- 40.Hu MC, Shi M, Zhang J, et al. Klotho: a novel phosphaturic substance acting as an autocrine enzyme in the renal proximal tubule. FASEB J. 2010;24:3438–3450. doi: 10.1096/fj.10-154765. [DOI] [PMC free article] [PubMed] [Google Scholar]
- 41.Larsson TE. The role of FGF-23 in CKD-MBD and cardiovascular disease: friend or foe? Nephrol Dial Transplant. 2010;25:1376–1381. doi: 10.1093/ndt/gfp784. [DOI] [PubMed] [Google Scholar]
- 42.Kurosu H, Ogawa Y, Miyoshi M, et al. Regulation of fibroblast growth factor-23 signaling by klotho. J Biol Chem. 2006;281:6120–6123. doi: 10.1074/jbc.C500457200. [DOI] [PMC free article] [PubMed] [Google Scholar]
- 43.Goetz R, Nakada Y, Hu MC, et al. Isolated C-terminal tail of FGF23 alleviates hypophosphatemia by inhibiting FGF23-FGFR-Klotho complex formation. Proc Natl Acad Sci U S A. 2010;107:407–412. doi: 10.1073/pnas.0902006107. [DOI] [PMC free article] [PubMed] [Google Scholar]
- 44.Lau WL. Pai A, Moe SM, et al., editors. Direct effects of phosphate on vascular cell function. Adv Chronic Kidney Dis. 2011. pp. 105–12. [DOI] [PMC free article] [PubMed]
- 45.Block G, Raggi P, Bellasi A, et al. Mortality effect of coronary calcification and phosphate binder choice in incident hemodialysis patients. Kidney Int. 2007;71:438–441. doi: 10.1038/sj.ki.5002059. [DOI] [PubMed] [Google Scholar]
- 46.Chertow G, Burke S, Raggi P. Sevelamer attenuates the progression of coronary and aortic calcification in hemodialysis patients. Kidney Int. 2002;62:245–252. doi: 10.1046/j.1523-1755.2002.00434.x. [DOI] [PubMed] [Google Scholar]
- 47.Wu-Wong JR, Nakane M, Ma J, et al. Elevated phosphorus modulates vitamin D receptor-mediated gene expression in human vascular smooth muscle cells. Am J Physiol Renal Physiol. 2007;293:F1592–1604. doi: 10.1152/ajprenal.00492.2006. [DOI] [PubMed] [Google Scholar]
- 48.Tsujikawa H, Kurotaki Y, Fujimori T, et al. Klotho, a gene related to a syndrome resembling human premature aging, functions in a negative regulatory circuit of vitamin D endocrine system. Mol Endocrinol. 2003;17:2393–2403. doi: 10.1210/me.2003-0048. [DOI] [PubMed] [Google Scholar]
- 49.Forster RE, Jurutka PW, Hsieh JC, et al. Vitamin D receptor controls expression of the anti-aging klotho gene in mouse and human renal cells. Biochem Biophys Res Commun. 2011;414:557–562. doi: 10.1016/j.bbrc.2011.09.117. [DOI] [PMC free article] [PubMed] [Google Scholar]
- 50.Haussler MR, Haussler CA, Whitfield GK, et al. The nuclear vitamin D receptor controls the expression of genes encoding factors which feed the “Fountain of Youth” to mediate healthful aging. J Steroid Biochem Mol Biol. 2010;121:88–97. doi: 10.1016/j.jsbmb.2010.03.019. [DOI] [PMC free article] [PubMed] [Google Scholar]
- 51.Chen CD, Podvin S, Gillespie E, et al. Insulin stimulates the cleavage and release of the extracellular domain of Klotho by ADAM10 and ADAM17. Proc Natl Acad Sci U S A. 2007;104:19796–19801. doi: 10.1073/pnas.0709805104. [DOI] [PMC free article] [PubMed] [Google Scholar]
- 52.Bloch L, Sineshchekova O, Reichenbach D, et al. Klotho is a substrate for alpha-, beta- and gamma-secretase. FEBS Lett. 2009;583:3221–3224. doi: 10.1016/j.febslet.2009.09.009. [DOI] [PMC free article] [PubMed] [Google Scholar]
- 53.Kolek OI, Hines ER, Jones MD, et al. 1alpha,25-Dihydroxyvitamin D3 upregulates FGF23 gene expression in bone: the final link in a renal-gastrointestinal-skeletal axis that controls phosphate transport. Am J Physiol Gastrointest Liver Physiol. 2005;289:G1036–1042. doi: 10.1152/ajpgi.00243.2005. [DOI] [PubMed] [Google Scholar]
- 54.Saito H, Maeda A, Ohtomo S, et al. Circulating FGF-23 is regulated by 1alpha,25-dihydroxyvitamin D3 and phosphorus in vivo. J Biol Chem. 2005;280:2543–2549. doi: 10.1074/jbc.M408903200. [DOI] [PubMed] [Google Scholar]
- 55.Yu X, Sabbagh Y, Davis SI, et al. Genetic dissection of phosphate- and vitamin D-mediated regulation of circulating Fgf23 concentrations. Bone. 2005;36:971–977. doi: 10.1016/j.bone.2005.03.002. [DOI] [PubMed] [Google Scholar]
- 56.Faul C, Amaral AP, Oskouei B, et al. FGF23 induces left ventricular hypertrophy. J Clin Invest. 2011;121:4393–4408. doi: 10.1172/JCI46122. [DOI] [PMC free article] [PubMed] [Google Scholar]
- 57.Isakova T, Xie H, Barchi-Chung A, et al. Daily variability in mineral metabolites in CKD and effects of dietary calcium and calcitriol. Clin J Am Soc Nephrol. 2012;7:820–828. doi: 10.2215/CJN.11721111. [DOI] [PMC free article] [PubMed] [Google Scholar]
- 58.Wada T, McKee M, Steitz S, et al. Calcification of vascular smooth muscle cell cultures: inhibition by osteopontin. Circ Res. 1999;84:166–178. doi: 10.1161/01.res.84.2.166. [DOI] [PubMed] [Google Scholar]
- 59.Schlieper G, Aretz A, Verberckmoes SC, et al. Ultrastructural analysis of vascular calcifications in uremia. J Am Soc Nephrol. 2010;21:689–696. doi: 10.1681/ASN.2009080829. [DOI] [PMC free article] [PubMed] [Google Scholar]
- 60.Zebger-Gong H, Müller D, Diercke M, et al. 1,25-Dihydroxyvitamin D3-induced aortic calcifications in experimental uremia: up-regulation of osteoblast markers, calcium-transporting proteins and osterix. J Hypertens. 2011;29:339–348. doi: 10.1097/HJH.0b013e328340aa30. [DOI] [PubMed] [Google Scholar]
- 61.Starcher BC. Determination of the elastin content of tissues by measuring desmosine and isodesmosine. Anal Biochem. 1977;79:11–15. doi: 10.1016/0003-2697(77)90372-4. [DOI] [PubMed] [Google Scholar]
Associated Data
This section collects any data citations, data availability statements, or supplementary materials included in this article.


