

Abstract
Thermal fluctuations strongly modify the large length-scale elastic behavior of cross-linked membranes, giving rise to scale-dependent elastic moduli. Whereas thermal effects in flat membranes are well understood, many natural and artificial microstructures are modeled as thin elastic shells. Shells are distinguished from flat membranes by their nonzero curvature, which provides a size-dependent coupling between the in-plane stretching modes and the out-of-plane undulations. In addition, a shell can support a pressure difference between its interior and its exterior. Little is known about the effect of thermal fluctuations on the elastic properties of shells. Here, we study the statistical mechanics of shape fluctuations in a pressurized spherical shell, using perturbation theory and Monte Carlo computer simulations, explicitly including the effects of curvature and an inward pressure. We predict novel properties of fluctuating thin shells under point indentations and pressure-induced deformations. The contribution due to thermal fluctuations increases with increasing ratio of shell radius to thickness and dominates the response when the product of this ratio and the thermal energy becomes large compared with the bending rigidity of the shell. Thermal effects are enhanced when a large uniform inward pressure acts on the shell and diverge as this pressure approaches the classical buckling transition of the shell. Our results are relevant for the elasticity and osmotic collapse of microcapsules.
The elastic theory of thin plates and shells (1), a subject over a century old, has recently found new applications in understanding the mechanical properties of a wide range of natural and artificial structures at microscopic length scales. The mechanical properties of viral capsids (2–4), red blood cells (5), and hollow polymer and polyelectrolyte capsules (6–10) have been measured and interpreted in terms of elastic constants of the materials making up these thin-walled structures. Theoretically, models that quantify the deformation energy of a 2D membrane have been used to investigate the shapes of viral capsids (11–13) and their expected response to point forces and pressures (14–17), as well as shape transitions of pollen grains (18).
Like its counterparts in other areas of science, such as fluid dynamics and the theory of electrical conduction in metals, thin shell theory aims to describe the physics of slowly varying disturbances in terms of a few macroscopic parameters, such as the shear viscosity of incompressible fluids and the electrical conductivity of metals. Despite such venerable underpinnings as the Navier–Stokes equations and Ohm’s law, these hydrodynamic theories can break down, sometimes in spectacular ways. For example, it is known from mode coupling theory (19) and from renormalization group calculations (20) that thermal fluctuations cause the shear viscosity of incompressible fluids to diverge logarithmically with system size in a 2D incompressible fluid. In the theory of electrical conduction, quenched disorder due to impurities coupled with interactions between electrons lead to a dramatic breakdown of Ohm’s law in thin films and one-dimensional wires at low temperatures, with a conductance that depends on the sample dimensions (21).
Even more dramatic breakdowns of linear response theory can arise in thin plates and shells. Unlike the macroscopic shell structures of interest to civil engineers, thermal fluctuations can strongly influence structures with size of order microns, because the elastic deformation energies of extremely thin membranes (with nanoscale thicknesses) can be of the order of the thermal energy  (where
  is the Boltzmann constant and T the temperature) for typical deformations. The statistical mechanics of flat solid plates and membranes (i.e., membranes with no curvature in the unstrained state) have been studied previously (see refs. 22 and 23 and references therein). Thermal fluctuations lead to scale-dependent elastic moduli for flat membranes, causing the in-plane elastic moduli to vanish at large length scales while the bending rigidity diverges (24, 25). These anomalies arise from the the nonlinear couplings between out-of-plane deformations (transverse to the plane of the undeformed membrane) and the resultant in-plane strains, which are second order in the out-of-plane displacements.
Much less is known about spherical shells subject to thermal fluctuations (Fig. 1A). In fact, the coupling between in-plane and out-of-plane modes is significantly different. Geometry dictates that a closed spherical shell cannot be deformed without stretching; as a result, out-of-plane deformations provide a first-order contribution to the in-plane strain tensor (1). This introduces new nonlinear couplings between in-plane and out-of-plane deformations, which are forbidden by symmetry in flat membranes. We can also consider the buckling of spherical shells under uniform external pressure, which has no simple analog for plates (Fig. 1B). An early exploration with computer simulations combined an analysis of the elastic energy due to the linear strain contributions of a spherical membrane with the nonlinear corrections from flat membranes to suggest new scaling behavior for thermally fluctuating spherical membranes (26). However, an important nonlinear coupling triggered by the curved background metric was not considered, nor was the effect of an external pressure investigated. Here, we study the mechanics of fluctuating spherical shells, using perturbation theory and numerical simulations, taking into account the nonlinear couplings introduced by curvature as well as the effects of a uniform external pressure.
Fig. 1.

Simulated thermally fluctuating shells. (A) Triangulated shell with 5,530 points separated by average nearest-neighbor distance  with Young’s modulus
  and bending rigidity
  at temperature
  , where ɛ is the energy scale of the Lennard-Jones potential used to generate the disordered mesh. (B) Same as in A with external pressure
  , where
  is the classical buckling pressure. The thermally excited shell has already buckled under pressure to a shape with a much smaller enclosed volume than in A.
Results and Discussion
Elastic Energy of a Thin Shell.
The elastic energy of a deformed spherical shell of radius R is calculated using shallow-shell theory (27). This approach considers a shallow section of the shell, small enough so that slopes measured relative to the section base are small (Fig. S1). The in-plane displacements of the shallow section are parameterized by a two-component phonon field  ,
,  ; the out-of-plane displacements are described by a field
  in a coordinate system
  tangent to the shell at the origin. We focus on amorphous shells, with uniform elastic properties, and can thus neglect the effect of the 12 inevitable disclinations associated with crystalline order on the surface of a sphere (11). In the presence of an external pressure p acting inward, the elastic energy for small displacements in terms of the bending rigidity κ and Lamé coefficients μ and λ reads (details in SI Text)
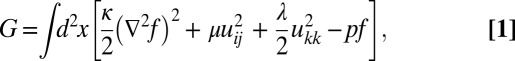 |
where the nonlinear strain tensor is
 |
Here,  , where g is the determinant of the metric tensor associated with the spherical background metric. Within shallow shell theory,
  (SI Text).
If we represent the normal displacements in the form  , where
  represents the uniform contraction of the sphere in response to the external pressure, and
  is the deformation with reference to this contracted state so that
  , then the energy is quadratic in fields
  ,
,  , and
, and  . These variables can be eliminated in a functional integral of
  by Gaussian integration (details in SI Text). The effective free energy
  that results is the sum of a harmonic part
  and an anharmonic part
  in the remaining variable
  ,
,
 |
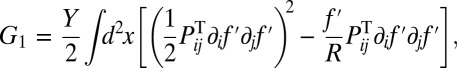 |
where  is the 2D Young's modulus and
  is the transverse projection operator. The “mass” term
  in the harmonic energy functional reflects the coupling between out-of-plane deformation and in-plane stretching due to curvature, absent in the harmonic theory of flat membranes (plates). The cubic interaction term with a coupling constant
  is also unique to curved membranes and is prohibited by symmetry for flat membranes. These terms are unusual because they have system-size–dependent coupling constants. Note that an inward pressure (
 ) acts like a negative R-dependent surface tension in the harmonic term. As required, the effective elastic energy of fluctuating flat membranes is retrieved for
  and
and  . In the following, we exclusively use the field
  and thus drop the prime without ambiguity.
When only the harmonic contributions are considered, the equipartition result for the thermally generated Fourier components  with 2D wavevector
  are
are
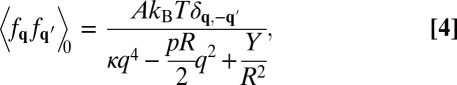 |
where A is the area of integration in the  plane. Long-wavelength modes are restricted by the finite size of the sphere; i.e.,
  . In contrast to flat membranes for which the amplitude of long-wavelength (
 ) modes diverges as
 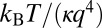 , the coupling between in-plane and out-of-plane deformations of curved membranes cuts off fluctuations with wave vectors smaller than a characteristic inverse length scale (26),
 |
where we have introduced the dimensionless Föppl-von Kármán number  (11). We focus here on the case
  , so
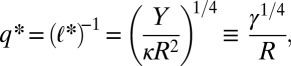
, so  . As p approaches
  , the modes with
  become unstable and their amplitude diverges. This corresponds to the well-known buckling transition of spherical shells under external pressure (27). When
  , the shape of the deformed shell is no longer described by small deformations from a sphere, and the shallow shell approximation breaks down.
Anharmonic Corrections to Elastic Moduli.
The anharmonic part of the elastic energy, neglected in the analysis described above, modifies the fluctuation spectrum by coupling Fourier modes at different wave vectors. Upon rescaling all lengths by  , it can be shown that the size of anharmonic contributions to
  is set by the dimensionless quantities
  and
and  . The correlation function including the anharmonic terms in Eq. 3 is given by the Dyson equation,
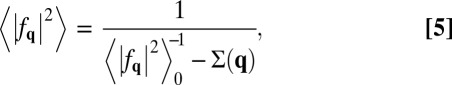 |
where  is the self-energy, which we evaluate to one-loop order, using perturbation theory. Whereas
  can be numerically evaluated at any
  , an approximate but concise description of the fluctuation spectrum is obtained by expanding the self-energy up to order
  and defining renormalized values
  ,
,  , and
, and  of the Young’s modulus, bending rigidity, and pressure, from the coefficients of the expansion:
 |
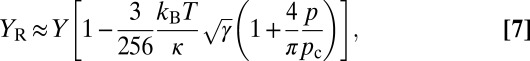
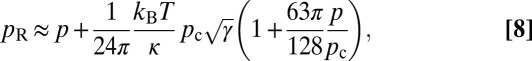
To lowest order in  and
and  we obtain the approximate expressions (details in SI Text)
 |
 |
and
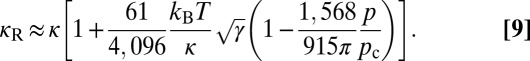 |
(See SI Text and Figs. S2 and S3 for details of the calculation and the complete dependence on  .) Thus, the long-wavelength deformations of a thermally fluctuating shell are governed by a smaller effective Young’s modulus, a larger effective bending rigidity, and a nonzero negative surface tension even when the external pressure is zero. At larger
  , however, both the Young’s modulus and the bending modulus fall compared with their zero-temperature values, and the negative effective surface tension determined by
  gets very large. The complete expressions for the effective elastic parameters, including the full
  dependence, show that all corrections diverge as
  . Furthermore, the effective elastic constants are not only temperature dependent, but also system size dependent, because
  . Although the corrections are formally small for
  , they nevertheless diverge as
  ! The thermally generated surface tension, strong dependence on external pressure, and size dependence of elastic constants are unique to spherical membranes, with no analog in planar membranes.
Simulations of Thermally Fluctuating Shells.
We complement our theoretical calculations with Monte Carlo simulations of randomly triangulated spherical shells with discretized bending and stretching energies that translate directly into a macroscopic 2D Young's modulus Y and a bending ridigity κ (28, 29). (Details are provided in Materials and Methods.) Here we study shells with 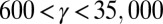 and
and  . The anharmonic effects are negligible at the low end of this temperature range.
The fluctuation spectra of the simulated spherical shells are evaluated using an expansion of the radial displacement field in spherical harmonics (30). The radial position of a node i at angles ( ) can be written as
 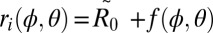 with
with  the average radius of the fluctuating vesicle. The function
  can be expanded in (real) spherical harmonics,
 |
where  is the large wave-number cutoff determined by the number of nodes in the lattice
 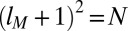 (30). The theoretical prediction for the fluctuation spectrum including anharmonic effects is (SI Text)
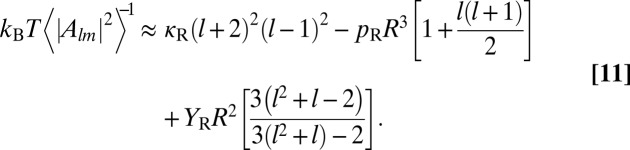 |
Fig. 2 displays our theoretical and simulation results for the fluctuation spectrum. At the lowest temperature (corresponding to  ), the spectrum is well described by the bare elastic parameters Y, κ, and p. At the intermediate temperature (
 ) anharmonic corrections become significant, enhancing the fluctuation amplitude for some values of l by about 20–40% compared with the purely harmonic contribution. At this temperature, one-loop perturbation theory successfully describes the fluctuation spectrum. However, at the highest temperature simulated (
 ), the anharmonic corrections observed in simulations approach 50% of the harmonic contribution at zero pressure and over 100% for the pressurized shell. With such large corrections, we expect that higher-order terms in the perturbation expansion contribute significantly to the fluctuation spectrum and the one-loop result overestimates the fluctuation amplitudes.
Fig. 2.

Fluctuation spectrum in spherical harmonics. Spherical harmonic amplitude of the shape fluctuations of elastic shells is plotted against the dimensionless spherical wave number l for a shell with 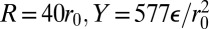 , and
, and  at temperatures
  (blue), 0.07 (red), and 0.18 (yellow). The fluctuation amplitudes are scaled by
  so that the spectra at different temperatures would coincide in the harmonic approximation. Each section corresponds to a different value of the external pressure:
  (A) and
  (B). The symbols are from Monte Carlo simulations, and the solid lines are the theoretical prediction (Eq. 11), using the renormalized elastic constants from perturbation theory (Eqs. 7–9), except for the lowest temperature, where the bare elastic constants are used because the anharmonic effects are negligible.
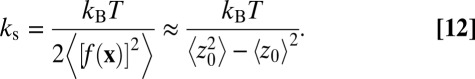
Similarly, thermal fluctuations modify the mechanical response when a shell is deformed by a deliberate point-like indentation. In experiments, such a deformation is accomplished using an atomic force microscope (2, 9). In our simulations, two harmonic springs are attached to the north and south pole of the shell. By changing the position of the springs the depth of the indentation can be varied (Fig. 3A, Inset). The thermally averaged pole-to-pole distance  is measured and compared with its average value in the absence of a force,
  . For small deformations, the relationship between the force applied at each pole and the corresponding change in pole–pole distance is spring-like with a spring constant
  :
:  . The spring constant is related to the amplitude of thermal fluctuations in the normal displacement field in the absence of forces by (detailed derivation in SI Text)
 |
This fluctuation-response relation is used to measure the temperature dependence of  from simulations on fluctuating shells with no indenters. At finite temperature, anharmonic effects computed above make this spring constant both size and temperature dependent:
 |
Fig. 3.

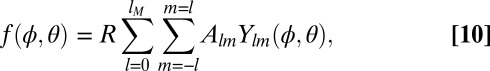
Temperature dependence of response to point forces. (A) Force-compression curves for simulations of indented shells (symbols) with  ,
,  , and
, and  at low (
 ) and high (
 ) temperatures. The lines show the expected linear response at small deformations with the spring constant
  measured independently from fluctuations in
  (
( for
for  ,
,  for
for 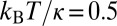 ). For indentation depths larger than
 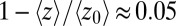 , the regions around the poles become inverted and the response becomes nonlinear. (Inset) Schematic showing the definition of
  (the pole-to-pole distance in the absence of indentations) and z (pole-to-pole distance following an indentation imposed by harmonic springs whose free ends are brought close together) for a snapshot of the fluctuating shell. (B) Blow-up of the boxed region near the origin in A, highlighting the linear response regime. (C) Spring constants extracted from fluctuations for shells with three different radii as a function of temperature, rescaled by the classical result for linear response of thin shells at zero temperature. The dashed line shows the perturbation theory prediction, Eq. 13. The low-temperature spring constant deviates from the classical result due to a finite mesh size effect that falls with increasing R (increasing mesh size).
Fig. 3A shows the force-compression relation for a shell with  and dimensionless temperatures
 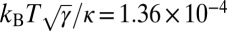 and
and 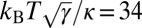 . The linear response near the origin (Fig. 3B) is very well described by
  measured indirectly from the fluctuations in
  at each temperature, Eq. 12. The thermal fluctuations lead to an appreciable 20% reduction of the spring constant for this case. Measuring spring constants over a range of temperatures (Fig. 3C) confirms that the shell response softens as the temperature is increased, in agreement with the perturbation theory prediction. We note, however, a small but systematic shift due to the finite mesh size of the shells, an ∼5% effect for the largest systems simulated here. At the higher temperatures (
 ), the measured spring constants deviate from the perturbation theory prediction, once again we believe due to the effect of higher-order terms.
We also simulate the buckling of thermally excited shells under external pressure. When the external pressure increases beyond a certain value (which we identify as the renormalized buckling pressure), the shell collapses from a primarily spherical shape (Fig. 1A) to a shape with one or more large volume-reducing inversions (Fig. 1B). For zero-temperature shells, this buckling is associated with the appearance of an unstable deformation mode in the fluctuation spectrum. At finite temperature, the appearance of a mode with energy of order  is sufficient to drive buckling. Anharmonic contributions, strongly enhanced by an external pressure, also reduce the effective energy associated with modes in the vicinity of
  primarily due to the enhanced negative effective surface tension
  (Eq. 8). As a result, unstable modes arise at lower pressures and we expect thermally fluctuating shells to collapse at pressures below the classical buckling pressure
  . This is confirmed by simulations of pressurized shells (Fig. 4). When anharmonic contributions are negligible (
 ), the buckling pressure observed in simulations is only
  of the theoretical value because the buckling transition is highly sensitive to the disorder introduced by the random mesh. Relative to this low temperature value, the buckling pressure is reduced significantly when
  becomes large.
Fig. 4.

Temperature dependence of the buckling pressure. Shown is buckling pressure for simulated shells at various radii and temperatures, normalized by the classical (i.e., zero temperature) critical buckling pressure  for perfectly uniform, zero-temperature shells with the same parameters. For all shells,
  . In separate sets of symbols, we either vary the shell radius over the range
  while keeping the temperature constant (
 , blue circles;
  , yellow squares) or vary the temperature over the range
  while keeping the radius constant at
  (red triangles). The parameter
  sets the strength of anharmonic corrections for thermally fluctuating shells. Inset shows the
  dependence of the buckling pressure as the radius is varied, for shells at low and high temperatures.
Conclusion and Outlook.
In summary, we have demonstrated that thermal corrections to the elastic response become significant when  and that first-order corrections in
  already become inaccurate when
  . Human red blood cell (RBC) membranes are known examples of curved solid structures that are soft enough to exhibit thermal fluctuations. Typical measured values of the shear and bulk moduli of RBC membranes correspond to
  μN/m (5, 31), whereas reported values of the bending rigidity κ vary widely from 6
  to 40
to 40  (5, 32). Using an effective radius of curvature
  μm (5) gives
  in the range 2–35. Thus, RBCs could be good candidates to observe our predicted thermal effects, provided their bending rigidity is in the lower range of the reported values.
For continuum shells fabricated from an elastic material with a 3D Young’s modulus E, thickness h, and typical Poisson ratio  ,
,  . Hence very thin shells with a sufficiently high radius-to-thickness ratio (
 ) must display significant thermal effects. Polyelectrolyte (9) and protein-based (33) shells with
  have been fabricated, but typical solid shells have a bending rigidity κ several orders of magnitude higher than
  unless
  nm. Microcapsules of 6 nm thickness fabricated from reconstituted spider silk (33) with
 and
and  GPa have
  and could exhibit measurable anharmonic effects.
Thermal effects are particularly pronounced under finite external pressure—an indentation experiment carried out at  on the aforementioned spider silk capsules would show corrections of 10% from the classical zero-temperature theory. For similar capsules with half the thickness, perturbative corrections at
  are larger than 100%, reflecting a drastic breakdown of shell theory because of thermal fluctuations. The breakdown of classical shell theory explored here points to the need for a renormalization analysis, similar to that carried out already for flat plates (34).
Materials and Methods
Monte Carlo Simulations of Randomly Triangulated Shells.
A random triangulation of radius  is constructed by distributing N nodes on the surface of a sphere with the required radius. The first two of these nodes are fixed at the north and the south pole of the sphere whereas the positions of the remaining
  nodes are randomized and equilibrated in a Monte Carlo simulation. During this equilibration process the nodes interact via a steeply repulsive potential (the repulsive part of a Lennard-Jones potential). After equilibration, when the energy has reached a constant value on average, the simulation is stopped and the final configuration is “frozen.” The neighbors of all nodes are determined using a Delaunay triangulation (35). The spherical configurations as well as the connection lists are used in further simulations.
In subsequent simulations nearest neighbors are permanently linked by a harmonic potential giving rise to a total stretching energy (36),
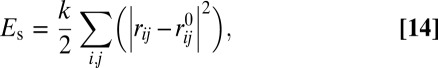 |
where the sum runs over all pairs of nearest neighbors,  is the distance between two neighbors, and
  is the equilibrium length of a spring. The equilibrium length
  is determined at the start of the simulation, when the shell is still perfectly spherical and thus the stretching energy vanishes for the spherical shape. The spring constant k is related to the 2D Lamé coefficients
  and the 2D Young’s modulus
  (36).
(36).
The mean curvature (more precisely, twice the mean curvature) at node i is discretized using (30, 37, 38)
 |
where  is the surface (unit) normal at node i (the average normal of the faces surrounding node i),
  is the area of the dual cell of node i,
  is the length of a bond in the dual lattice, and
  is the distance between the nodes i and j. The total curvature energy is
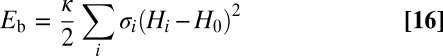 |
with κ the bending rigidity and  the spontaneous curvature at node i. In all simulations
  (because
  is twice the mean curvature). In the cases of elastic shells under pressure a term
  is added to the Hamiltonian, where P is the external pressure and V the volume of the shell.
Similar elastic networks with stretching and bending potentials have been studied in relation to the stability of membranes and to icosahedral and spherical shells that contain defects (11, 17, 29, 36, 39, 40) or defect scars (38, 41–43) as well as to the deformation of icosahedral viruses (14–16) and the crumpling of elastic sheets (28).
Simulations are performed for shells of 5,530 ( ), 22,117 (
 ), and 41,816 (
 ) nodes. The Hookean spring constant and the bending rigidity are taken such that the shells have Föppl–von Kármán numbers in the range
  and that the dimensionless temperature is in the range
  . Monte Carlo production runs consist typically of
  Monte Carlo steps, where in a single Monte Carlo step an attempt is made to update the positions of all nodes once on average. Configurations were stored for analysis typically every
  Monte Carlo steps. For the largest system (41,816 nodes), such a run took about 700 d of net central processing unit (CPU) time spread over several simultaneous runs in a Linux cluster of Intel XEON X5355 CPUs. For the smaller shells, the computational time scaled down roughly linearly with system size.
Fluctuation Spectrum from Computer Simulations.
For a particular configuration of a simulated shell, the coefficients  of the expansion of the radial displacements in spherical harmonics (Eq. 10) are determined by a least-squares fit of the node positions to a finite number
  of (real) spherical harmonics. In practice we have used
  as the upper wave-number cutoff for all simulations. At each temperature and pressure, this procedure is repeated for about 10,000 independent configurations and the results are averaged to obtain the curves presented in Fig. 2.
Simulations of Shells Indented by Point-Like Forces.
To perform indentation simulations, two harmonic springs are attached to the north and the south pole of the shell. This leads to an additional term in the Hamiltonian  , where
  is the spring constant of the indenter. Here, one end of the springs, at positions
  and
and  , is attached to the vertices at the north and the south pole, respectively. The positions of the other end of the springs, at
  and
and  , are fixed externally and determine the indentation force and depth, as indicated in Fig. S4.
By changing  and
and  , the depth of the indentation can be varied. After the springs are fixed a certain distance apart, the thermally averaged pole-to-pole distance
  is measured and compared with its value in the absence of a force,
  . The instantaneous force at the poles is calculated from the instantaneous extension of the harmonic springs after each
  Monte Carlo step; thermal averaging then determines the average corresponding to
  . This provides the force-indentation curves in Fig. 3 A and B.
It is very difficult to unambiguously identify the linear regime in the force-indentation curves. Extracting the effective spring constant of shell deformation  from a linear fit in the small indentation region is subject to inaccuracies and sensitivity to the number of points included in fitting. Instead, we extract the spring constants of thermally fluctuating shells by using a relation between
  and the fluctuations in
  (derivation in SI Text):
 |
This procedure was used to measure the temperature-dependent spring constants in Fig. 3C.
Supplementary Material
Acknowledgments
We thank J. Hutchinson and F. Spaepen for pointing us to relevant shell theory literature, and A. Kosmrlj and Z. Zeravcic for useful discussions about theory and simulation details, respectively. Work by J.P. and D.R.N. was supported by the National Science Foundation via Grant DMR1005289 and through the Harvard Materials Research Science and Engineering Center through Grant DMR0820484.
Footnotes
The authors declare no conflict of interest.
This article is a PNAS Direct Submission.
This article contains supporting information online at www.pnas.org/lookup/suppl/doi:10.1073/pnas.1212268109/-/DCSupplemental.
References
- 1.Landau L, Lifshitz E. Theory of Elasticity. 3rd Ed. Boston: Butterworth-Heinemann; 1986. [Google Scholar]
- 2.Ivanovska IL, et al. Bacteriophage capsids: Tough nanoshells with complex elastic properties. Proc Natl Acad Sci USA. 2004;101(20):7600–7605. doi: 10.1073/pnas.0308198101. [DOI] [PMC free article] [PubMed] [Google Scholar]
- 3.Michel JP, et al. Nanoindentation studies of full and empty viral capsids and the effects of capsid protein mutations on elasticity and strength. Proc Natl Acad Sci USA. 2006;103(16):6184–6189. doi: 10.1073/pnas.0601744103. [DOI] [PMC free article] [PubMed] [Google Scholar]
- 4.Klug WS, et al. Failure of viral shells. Phys Rev Lett. 2006;97(22):228101. doi: 10.1103/PhysRevLett.97.228101. [DOI] [PubMed] [Google Scholar]
- 5.Park Y, et al. Measurement of red blood cell mechanics during morphological changes. Proc Natl Acad Sci USA. 2010;107:6731–6736. doi: 10.1073/pnas.0909533107. [DOI] [PMC free article] [PubMed] [Google Scholar]
- 6.Gao C, Donath E, Moya S, Dudnik V, Möhwald H. Elasticity of hollow polyelectrolyte capsules prepared by the layer-by-layer technique. Eur Phys J E. 2001;5:21–27. [Google Scholar]
- 7.Gordon VD, et al. Self-assembled polymer membrane capsules inflated by osmotic pressure. J Am Chem Soc. 2004;126(43):14117–14122. doi: 10.1021/ja0474749. [DOI] [PubMed] [Google Scholar]
- 8.Lulevich VV, Andrienko D, Vinogradova OI. Elasticity of polyelectrolyte multilayer microcapsules. J Chem Phys. 2004;120(8):3822–3826. doi: 10.1063/1.1644104. [DOI] [PubMed] [Google Scholar]
- 9.Elsner N, et al. Mechanical properties of freestanding polyelectrolyte capsules: A quantitative approach based on shell theory. In: Grundke K, Stamm M, Adler H-J, editors. Characterization of Polymer Surfaces and Thin Films. Vol 132. Berlin: Springer-Verlag; 2006. pp. 117–123. [Google Scholar]
- 10.Zoldesi CI, Ivanovska IL, Quilliet C, Wuite GJL, Imhof A. Elastic properties of hollow colloidal particles. Phys Rev E Stat Nonlin Soft Matter Phys. 2008;78(5 Pt 1):051401. doi: 10.1103/PhysRevE.78.051401. [DOI] [PubMed] [Google Scholar]
- 11.Lidmar J, Mirny L, Nelson DR. Virus shapes and buckling transitions in spherical shells. Phys Rev E Stat Nonlin Soft Matter Phys. 2003;68(5 Pt 1):051910. doi: 10.1103/PhysRevE.68.051910. [DOI] [PubMed] [Google Scholar]
- 12.Nguyen TT, Bruinsma RF, Gelbart WM. Elasticity theory and shape transitions of viral shells. Phys Rev E Stat Nonlin Soft Matter Phys. 2005;72(5 Pt 1):051923. doi: 10.1103/PhysRevE.72.051923. [DOI] [PubMed] [Google Scholar]
- 13.Nguyen TT, Bruinsma RF, Gelbart WM. Continuum theory of retroviral capsids. Phys Rev Lett. 2006;96(7):078102. doi: 10.1103/PhysRevLett.96.078102. [DOI] [PubMed] [Google Scholar]
- 14.Vliegenthart GA, Gompper G. Mechanical deformation of spherical viruses with icosahedral symmetry. Biophys J. 2006;91(3):834–841. doi: 10.1529/biophysj.106.081422. [DOI] [PMC free article] [PubMed] [Google Scholar]
- 15.Buenemann M, Lenz P. Mechanical limits of viral capsids. Proc Natl Acad Sci USA. 2007;104(24):9925–9930. doi: 10.1073/pnas.0611472104. [DOI] [PMC free article] [PubMed] [Google Scholar]
- 16.Buenemann M, Lenz P. Elastic properties and mechanical stability of chiral and filled viral capsids. Phys Rev E Stat Nonlin Soft Matter Phys. 2008;78(5 Pt 1):051924. doi: 10.1103/PhysRevE.78.051924. [DOI] [PubMed] [Google Scholar]
- 17.Siber A, Podgornik R. Stability of elastic icosadeltahedral shells under uniform external pressure: application to viruses under osmotic pressure. Phys Rev E Stat Nonlin Soft Matter Phys. 2009;79(1 Pt 1):011919. doi: 10.1103/PhysRevE.79.011919. [DOI] [PubMed] [Google Scholar]
- 18.Katifori E, Alben S, Cerda E, Nelson DR, Dumais J. Foldable structures and the natural design of pollen grains. Proc Natl Acad Sci USA. 2010;107(17):7635–7639. doi: 10.1073/pnas.0911223107. [DOI] [PMC free article] [PubMed] [Google Scholar]
- 19.Pomeau Y, Résibois P. Time dependent correlation functions and mode-mode coupling theories. Phys Rep. 1975;19:63–139. [Google Scholar]
- 20.Forster D, Nelson DR, Stephen MJ. Large-distance and long-time properties of a randomly stirred fluid. Phys Rev A. 1977;16(2):732–749. [Google Scholar]
- 21.Lee PA, Ramakrishnan TV. Disordered electronic systems. Rev Mod Phys. 1985;57:287–337. [Google Scholar]
- 22.Nelson DR. Theory of the crumpling transition. In: Nelson DR, Piran T, Weinberg S, editors. Statistical Mechanics of Membranes and Surfaces. 2nd Ed. Singapore: World Scientific; 2004. pp. 131–148. [Google Scholar]
- 23.Bowick M, Travesset A. The statistical mechanics of membranes. Phys Rep. 2001;344:255–308. [Google Scholar]
- 24.Nelson DR, Peliti L. Fluctuations in membranes with crystalline and hexatic order. J Phys. 1987;48:1085–1092. [Google Scholar]
- 25.Aronovitz J, Golubovic L, Lubensky TC. Fluctuations and lower critical dimensions of crystalline membranes. J Phys. 1989;50:609–631. [Google Scholar]
- 26.Zhang Z, Davis HT, Kroll DM. Scaling behavior of self-avoiding tethered vesicles. Phys Rev E Stat Phys Plasmas Fluids Relat Interdiscip Topics. 1993;48(2):R651–R654. doi: 10.1103/physreve.48.r651. [DOI] [PubMed] [Google Scholar]
- 27.van der Heijden AMA. W. T. Koiter’s Elastic Stability of Solids and Structures. Cambridge, UK: Cambridge Univ Press; 2009. [Google Scholar]
- 28.Vliegenthart GA, Gompper G. Forced crumpling of self-avoiding elastic sheets. Nat Mater. 2006;5(3):216–221. doi: 10.1038/nmat1581. [DOI] [PubMed] [Google Scholar]
- 29.Vliegenthart GA, Gompper G. Compression, crumpling and collapse of spherical shells and capsules. New J Phys. 2011;13:045020. [Google Scholar]
- 30.Gompper G, Kroll D. Random surface discretizations and the renormalization of the bending rigidity. J Phys I. 1996;6:1305–1320. [Google Scholar]
- 31.Waugh R, Evans EA. Thermoelasticity of red blood cell membrane. Biophys J. 1979;26(1):115–131. doi: 10.1016/S0006-3495(79)85239-X. [DOI] [PMC free article] [PubMed] [Google Scholar]
- 32.Evans EA. Bending elastic modulus of red blood cell membrane derived from buckling instability in micropipet aspiration tests. Biophys J. 1983;43(1):27–30. doi: 10.1016/S0006-3495(83)84319-7. [DOI] [PMC free article] [PubMed] [Google Scholar]
- 33.Hermanson K, Huemmerich D, Scheibel T, Bausch A. Engineered microcapsules fabricated from reconstituted spider silk. Adv Mater. 2007;19:1810–1815. [Google Scholar]
- 34.Nelson DR, Piran T, Weinberg S. Statistical Mechanics of Membranes and Surfaces. 2nd Ed. Singapore: World Scientific; 2004. [Google Scholar]
- 35.Renka RJ. Algorithm 772: STRIPACK: Delaunay triangulation and Voronoi diagram on the surface of a sphere. ACM Trans Math Softw. 1997;23:416–434. [Google Scholar]
- 36.Seung HS, Nelson DR. Defects in flexible membranes with crystalline order. Phys Rev A. 1988;38(2):1005–1018. doi: 10.1103/physreva.38.1005. [DOI] [PubMed] [Google Scholar]
- 37.Itzykson C. In: Proceedings of the GIFT Seminar, Jaca 85. Abad J, et al., editors. Singapore: World Scientific; 1986. pp. 130–188. [Google Scholar]
- 38.Kohyama T, Kroll DM, Gompper G. Budding of crystalline domains in fluid membranes. Phys Rev E Stat Nonlin Soft Matter Phys. 2003;68(6 Pt 1):061905. doi: 10.1103/PhysRevE.68.061905. [DOI] [PubMed] [Google Scholar]
- 39.Gompper G, Kroll DM. Triangulated-surface models of fluctuating membranes. In: Nelson DR, Piran T, Weinberg S, editors. Statistical Mechanics of Membranes and Surfaces. 2nd Ed. Singapore: World Scientific; 2004. pp. 359–426. [Google Scholar]
- 40.Widom M, Lidmar J, Nelson DR. Soft modes near the buckling transition of icosahedral shells. Phys Rev E Stat Nonlin Soft Matter Phys. 2007;76(3 Pt 1):031911. doi: 10.1103/PhysRevE.76.031911. [DOI] [PubMed] [Google Scholar]
- 41.Bowick MJ, Nelson DR, Travesset A. Interacting topological defects on frozen topographies. Phys Rev B. 2000;62:8738–8751. [Google Scholar]
- 42.Bausch AR, et al. Grain boundary scars and spherical crystallography. Science. 2003;299(5613):1716–1718. doi: 10.1126/science.1081160. [DOI] [PubMed] [Google Scholar]
- 43.Kohyama T, Gompper G. Defect scars on flexible surfaces with crystalline order. Phys Rev Lett. 2007;98(19):198101. doi: 10.1103/PhysRevLett.98.198101. [DOI] [PubMed] [Google Scholar]
Associated Data
This section collects any data citations, data availability statements, or supplementary materials included in this article.